Norwegian Americans
 | |
| Total population | |
|---|---|
|
(Norwegian Americans 4,642,526 Up from 13,000 in 1850 1.5% of the US population [1]) | |
| Regions with significant populations | |
| Midwest | 2,273,683 |
| West | 1,552,462 |
| South | 545,699 |
| Northeast |
266,881 |
| 868,361 | |
| 466,469 | |
| 412,177 | |
| 410,818 | |
| 199,154 | |
| 173,640 | |
| 171,745 | |
| 164,676 | |
| 129,081 | |
| 124,618 | |
| 119,164 | |
| 117,444 | |
| 113,543 | |
| 92,796 | |
| 90,425 | |
| Languages | |
| English, Norwegian | |
| Religion | |
|
Predominantly Evangelical Lutheran Church in America and Lutheran Church–Missouri Synod with some in other denominations. | |
| Related ethnic groups | |
| Norwegians, Norwegian Canadians, Scandinavian Americans, Danish Americans, Norwegian Australians, Norwegian New Zealanders | |
Norwegian Americans (Norwegian: norskamerikanere) comprise Americans with ancestral roots from Norway. Norwegian immigrants went to the United States primarily in the later half of the 19th century and the first few decades of the 20th century. There are more than 4.5 million Norwegian Americans according to the most recent U.S. census, and most live in the Upper Midwest. Norwegian Americans currently comprise the 10th largest European ancestry group in the United States.
History
Early history
Viking-era exploration
Norsemen from Greenland and Iceland were the first Europeans to reach North America. Leif Ericson reached North America via Norse settlements in Greenland around the year 1000. Norse settlers from Greenland founded the settlement of L'Anse aux Meadows and Point Rosee in Vinland, in what is now Newfoundland, Canada.[2] These settlers failed to establish a permanent settlement because of conflicts with indigenous people and within the Norse community.
Colonial settlement
There was a Norwegian presence in New Amsterdam (New York after 1664) in the early part of 17th century. Hans Hansen Bergen, a native of Bergen, Norway, was one of the earliest settlers of the Dutch colony of New Amsterdam having immigrated in 1633.
Another of the first Norwegian settlers was Albert Andriessen Bradt who arrived in New Amsterdam in 1637. Pieter Van Brugh, Mayor of Albany, New York was the grandson of Norwegian immigrants. His mother's parents were Roelof Janse (1602–1637), born in Marstrandsön, a small island situated in Båhuslen province in Norway (it was ceded to Sweden in 1658) and Anneke Jans (1605–1663), born on Flekkerøy, an island situated outside the town of Kristiansand, Vest-Agder county, Norway.[3]
Approximately 60 persons had settled in the Manhattan area before the British take-over in 1664. How many Norwegians that settled in New Netherland (the area up the Hudson River to Fort Oranje—now Albany) is not known. The Netherlands (and especially Amsterdam and Hoorn) had strong commercial ties with the coastal lumber trade of Norway during the 17th century and many Norwegians immigrated to Amsterdam. Some of them settled in Dutch colonies, although never in large numbers. (For further reading, see for example J.H. Innes, New Amsterdam and its people.) There were also Norwegian settlers in Pennsylvania in the first half of the 18th century, upstate New York in the latter half of the same century, and in New England during both halves.

Sloopers
The earliest immigrants from Norway to America emigrated mostly because of religious motives, as Religious Society of Friends and Haugeans. Organized Norwegian immigration to North America began in 1825, when several dozen Norwegians left Stavanger bound for North America on the sloop Restauration (often called the "Norwegian Mayflower) under the leadership of Cleng Peerson. To a great extent, this early emigration from Norway was borne out of religious persecution, especially for Quakers and a local religious group, the Haugianerne.[4]
The ship landed in New York City, where it was at first impounded for exceeding its passenger limit. After intervention from President John Quincy Adams, the passengers moved on to settle in Kendall, New York with the help of Andreas Stangeland, witnessing the opening of the Erie Canal en route. Many of these immigrants moved on from the Kendall Settlement, settling in Illinois and Wisconsin. Cleng Peerson became a traveling emissary for Norwegian immigrants and died in a Norwegian Settlement near Cranfills Gap, Texas in 1865.[5]
...in 1825, during a period of particularly fierce religious strife in Norway. In July of that year, a group of six dissenting families, seeking a haven from the official Norwegian state church, set sail from Stavanger in an undersized sloop, the Restaurationen. When it arrived in New York harbor after an arduous 14-week journey, the Restaurationen caused a sensation, and the local press marveled at the bravery of these Norwegian pilgrims. Local Quakers helped the destitute emigrants, who eventually established a community in upstate New York. Today, their descendants are still known as 'sloopers'."[6]

Organized immigration
While there were about 65 Norwegian individuals who emigrated via ports in Sweden and elsewhere in the intervening years, the next emigrant ship did not leave Norway for the New World until 1836, when the ships Den Norske Klippe and Norden departed. In 1837, a group of immigrants from Tinn emigrated via Gothenburg to the Fox River Settlement, near present-day Sheridan, Illinois. But it was the writings of Ole Rynning (1809–1838), who traveled to the U.S. on the Ægir in 1837 that energized Norwegian immigration.[7][8]
The good majority of Norwegian immigrants, close to 500,000, came to the USA via the Canadian Port of Quebec. The British Government repealed the Navigation Acts in 1849, and from 1850 on Canada became the port of choice. Initially, most ships departed from Norwegian ports directly to Quebec as ships carried passengers to Canada and took lumber back to Britain. However, with time, increasing numbers of ships transported passengers from Norwegian ports to English North Sea ports such as Kingston upon Hull. Emigrants were transported overland to Liverpool, where they transferred to trans-Atlantic ships.
The Canadian route offered many advantages to the emigrant over traveling to the USA directly. "They moved on from Quebec both by rail and by steamer for another thousand or more miles (1600 km) for a steerage fare of slightly less than $9.00. Steamers from Quebec, Canada brought them to Toronto, Canada then the immigrants often traveled by rail for 93 miles to Collingwood, Ontario, Canada on Lake Huron, from where steamers transported them across Lake Michigan to Chicago, Milwaukee and Green Bay. Not until the start of the 20th century did Norwegians accept Canada as a land of the second chance. This was also true of the many American-Norwegians who moved to Canada seeking homesteads and new economic opportunities. By 1921 one-third of all Norwegians in Canada had been born in the U.S.

Norwegian immigration through the years was predominantly motivated by economic concerns. Compounded by crop failures, Norwegian agricultural resources were unable to keep up with population growth, and the Homestead Act promised fertile, flat land. As a result, settlement trended westward with each passing year.
Early Norwegian settlements were in Pennsylvania, Massachusetts, and Illinois, but moved westward into Wisconsin, Minnesota, and the Dakotas. Later waves of Norwegian immigration went to the Western states such as Washington and Oregon, and Utah through missionary efforts of gaining Norwegian and Swedish converts by the Mormons. Additionally, craftsmen also immigrated to a larger, more diverse market. Until recently, there was a Norwegian area in Sunset Park, Brooklyn originally populated by Norwegian craftsmen.
Between 1825 and 1925, more than 800,000 Norwegians immigrated to North America—about one-third of Norway's population with the majority immigrating to the USA, and lesser numbers immigrating to the Dominion of Canada. With the exception of Ireland, no single country contributed a larger percentage of its population to the United States than Norway.[9]
Settlements

The majority of the pioneer immigrants, the so-called "Sloopers," assisted by the kindly services of American Quakers, went to Orleans County in western New York state and settled in what became Kendall Township. In the mid-1830s the Kendall settlers gave impetus to the westward movement of Norwegians by founding a settlement in the Fox River area of Illinois. A small urban colony of Norwegians had its genesis in Chicago at about the same time.
Immigrant settlements now stood ready to welcome Norwegian newcomers, who, beginning in 1836, arrived annually. From Illinois, Norwegian pioneers followed the general spread of population northwestward into Wisconsin. Wisconsin remained the center of Norwegian American activity up until the American Civil War, a war in which a number of Norwegian Americans fought for the Union, such as in the 15th Wisconsin Volunteer Regiment. In the 1850s Norwegian land seekers began moving into both Iowa and Minnesota, and serious migration to the Dakotas was underway by the 1870s.
The majority of Norwegian agrarian settlements developed in the northern region of the so-called Homestead Act Triangle between the Mississippi and the Missouri rivers. The upper Midwest became the home for most immigrants. In 1910 almost 80 percent of the one million or more Norwegian Americans—the immigrants and their children—lived in that part of the United States. In 1990, 51.7 percent of the Norwegian American population lived in the Midwest; Minnesota had the largest number. Minneapolis functioned as a Norwegian American "capital" for secular and religious activities.
In the Pacific Northwest, the Puget Sound region, and especially the city of Seattle, became another center of immigrant life. Enclaves of Norwegian immigrants emerged as well in greater Brooklyn, New York, in Alaska, and Texas. After Minnesota, Wisconsin had the most Norwegians in 1990, followed by California, Washington, and North Dakota.
In a letter from Chicago dated 9 November 1855, Elling Haaland from Stavanger, Norway, assured his relatives back home that "of all nations Norwegians are those who are most favored by Americans."
A newcomer from Norway who arrives here will be surprised indeed to find in the heart of the country, more than a thousand miles from his landing place, a town where language and way of life so unmistakably remind him of his native land. Svein Nilsson, a Norwegian American journalist (in Billed-Magazin, May 14, 1870).
This sentiment was expressed frequently as the immigrants attempted to seek acceptance and negotiate entrance into the new society. In their segregated farming communities, Norwegians were spared direct prejudice and might indeed have been viewed as a welcome ingredient in a region's development. Still, a sense of inferiority was inherent in their position. The immigrants were occasionally referred to as "guests" in the United States and they were not immune to condescending and disparaging attitudes by old-stock Americans. Economic adaptation required a certain amount of interaction with a larger commercial environment, from working for an American farmer to doing business with the seed dealer, the banker, and the elevator operator. Products had to be grown and sold— all of which pulled Norwegian farmers into social contact with their American neighbors.
In places like Brooklyn, Chicago, Minneapolis, and Seattle, Norwegian-Americans interacted with the multi-cultural environment of the city while constructing a complex ethnic community that met the needs of its members. It might be said that a Scandinavian melting pot existed in the urban setting among Norwegians, Swedes, and Danes, evidenced in residential and occupational patterns, in political mobilization, and in public commemoration. Inter-marriage promoted inter-ethnic assimilation. There are no longer any Norwegian immigrant enclaves or neighborhoods in America's great cities. Beginning in the 1920s, Norwegian-Americans increasingly became suburban, and one might claim, more American.[10]

Settlements in Minnesota
Settlements in the Dakotas
20th century
Norwegian Americans cultivated bonds with Norway, sending gifts home often and offering aid during natural disasters and other hardships in Norway. Relief in the form of collected funds was forthcoming without delay. Only during conflicts within the Swedish-Norwegian union, however, did Norwegian Americans become involved directly in the political life of Norway. In the 1880s they formed societies to assist Norwegian liberals, collecting money to assist rifle clubs in Norway should the political conflict between liberals and conservatives call for arms.
The ongoing tensions between Sweden and Norway and Norway's humiliating retreat in 1895 fueled nationalism and created anguish. Norwegian Americans raised money to strengthen Norway's military defenses. The unilateral declaration by Norway on June 7, 1905, to dissolve its union with Sweden yielded a new holiday of patriotic celebration.
In American popular culture, Norwegian Americans were the central characters in the popular CBS network television series, "Mama" (1949-1956). Set in San Francisco around 1900, The weekly program focused on working-class family life.[11] They also form the background to Garrison Keillor's "Lake Wobegon" series of novels.

21st century
- There are more than 4.5 million people of Norwegian ancestry in the United States today. Of these, approximately three million claim "Norwegian" as their sole or primary ancestry. The population of Norway itself in 2013 was 5.1 million.
- A little more than 2% of whites in the United States are of Norwegian descent. In the Upper Midwest, especially Minnesota, western Wisconsin, northern Iowa, and the Dakotas, more than 15% of whites are of Norwegian descent. Nearly one-third of all North Dakotans claim Norwegian as their ancestry.
- 55% of Norwegian Americans live in the Midwest; 21% live in California, Oregon and Washington.
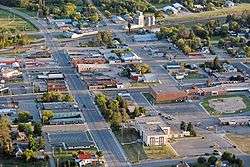
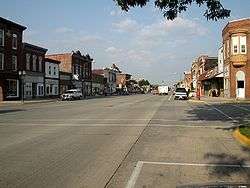
- Norwegian Americans actively celebrate and maintain their heritage in many ways. Much of it centers on the Lutheran-Evangelical churches they were born into. Culinary customs (e.g., lutefisk and lefse), costumes (bunad), and Norwegian holidays (Syttende Mai, May 17) are also popular. A number of towns in the United States, particularly in the Upper Midwest, display very strong Norwegian influences.
Demographics
Historical population by year
| Year | United States | Norwegian Americans | Percent |
|---|---|---|---|
| 1850 | 23,191,876 | 13,000 | 0.0% |
| 1910 | 92,228,496 | 1,000,000 | 1.0% |
| 1980 | 226,545,805 | 3,453,839 | 1.5% |
| 1990 | 248,709,873 | 3,869,395 | 1.5% |
| 2000 | 281,421,906 | 4,477,725 | 1.6% |
| 2009 | 304,059,728 | 4,642,526 | 1.5% |
| ||||||||||||||||||||||||
Immigrants by year or period
| Year/period | Number of immigrants every year/period[12] |
|---|---|
| 1836–1840 | 1,200 |
| 1841–1845 | 5,000 |
| 1846–1850 | 12,000 |
| 1851–1855 | 20,270 |
| 1856–1860 | 15,800 |
| 1861 | 8,900 |
| 1862 | 5,250 |
| 1863 | 1,100 |
| 1864 | 4,300 |
| 1865 | 4,000 |
| 1866 | 15,455 |
| 1867 | 12,828 |
| 1868 | 13,209 |
| 1869 | 18,055 |
| 1870 | 14,788 |
| 1871 | 12,055 |
| 1872 | 13,081 |
| 1873 | 9,998 |
| 1874 | 4,565 |
| 1875 | 3,972 |
| 1876 | 4,313 |
| 1877 | 3,195 |
| 1878 | 4,833 |
| 1879 | 7,607 |
| 1880 | 19,615 |
| 1881 | 25,956 |
| 1882 | 28,788 |
| 1883 | 22,167 |
| 1884 | 14,762 |
| 1885 | 13,971 |
| 1886 | 15,123 |
| 1887 | 20,729 |
| 1888 | 21,431 |
| 1889 | 12,624 |
| 1890 | 10,969 |
| 1891 | 13,335 |
| 1892 | 17,040 |
| 1893 | 18,766 |
| 1894 | 11,876 |
| 1895 | 6,161 |
| 1896 | 6,607 |
| 1897 | 4,583 |
| 1898 | 4,819 |
| 1899 | 6,517 |
| 1900 | 10,786 |
| (2010) | 1,100 [13] |
| Total (1836–1900) | 522,453 |
By state and region


| Region | Midwest | West | South | Northeast |
|---|---|---|---|---|
| Norwegian Americans | 2,273,683 | 1,552,462 | 545,699 | 266,881 |
| Percent of total population | 3.4% | 2.1% | 0.5% | 0.4% |
| Percent of Norwegian Americans | 49.4% | 32.9% | 12.0% | 5.4% |
| State | Norwegian American[14] | Percent Norwegian American |
|---|---|---|
| | 4,642,526 | 1.5% |
| | 868,361 | 16.5% |
| | 466,469 | 8.2% |
| | 412,177 | 1.1% |
| | 410,818 | 6.2% |
| | 199,154 | 30.8% |
| | 173,640 | 5.8% |
| | 171,745 | 1.3% |
| | 164,676 | 4.3% |
| | 129,081 | 0.5% |
| | 124,618 | 1.9% |
| | 119,164 | 2.4% |
| | 117,444 | 0.6% |
| | 113,543 | 14.0% |
| | 92,796 | 0.5% |
| | 90,425 | 9.3% |
| | 86,872 | 0.9% |
| | 70,946 | 2.5% |
| | 49,826 | 0.6% |
| | 47,891 | 3.1% |
| | 47,839 | 0.4% |
| | 47,136 | 0.5% |
| | 45,428 | 0.8% |
| | 44,010 | 0.5% |
| | 42,658 | 0.4% |
| | 39,921 | 2.2% |
| | 38,154 | 1.4% |
| | 35,881 | 0.4% |
| | 34,355 | 0.5% |
| | 33,650 | 0.5% |
| | 32,242 | 1.1% |
| | 31,020 | 0.5% |
| | 30,366 | 4.3% |
| | 28,009 | 0.4% |
| | 23,507 | 0.6% |
| | 18,403 | 0.5% |
| | 18,078 | 0.9% |
| | 17,230 | 0.4% |
| | 16,900 | 3.1% |
| | 14,916 | 0.3% |
| | 13,293 | 0.5% |
| | 12,345 | 0.3% |
| | 11,229 | 0.8% |
| | 11,128 | 0.2% |
| | 9,008 | 0.7% |
| | 8,249 | 0.6% |
| | 6,226 | 0.2% |
| | 4,777 | 0.5% |
| | 4,697 | 0.4% |
| | 4,544 | 0.7% |
| | 3,880 | 0.2% |
| | 3,801 | 0.6% |
| | 172 | 0.0% |
By state, comparison by census
| State | Norwegian Americans (1980)[15] | Percent (1980) | Norwegian Americans (1990)[16] | Percent (1990) | Norwegian Americans (2000)[17] | Percent (2000) | Norwegian Americans (2009) | Percent (2009) |
|---|---|---|---|---|---|---|---|---|
| | 3,453,839 | 1.8% | 3,869,395 | 1.5% | 4,477,725 | 1.6% | 4,642,526 | 1.5% |
| |
712,258 | 19.1% | 757,212 | 17.3% | 850,742 | 17.3% | 868,361 | 16.5% |
| |
391,650 | 9.1% | 416,271 | 8.5% | 454,831 | 8.5% | 466,469 | 8.2% |
| |
367,949 | 1.7% | 411,282 | 1.3% | 436,128 | 1.3% | 412,177 | 1.1% |
| |
286,077 | 8.1% | 333,521 | 6.8% | 367,508 | 6.2% | 410,818 | 6.2% |
| |
184,265 | 30.1% | 189,106 | 29.6% | 193,158 | 30.1% | 199,154 | 30.8% |
| |
153,187 | 6.0% | 152,084 | 5.4% | 166,667 | 5.7% | 173,640 | 5.8% |
| |
167,995 | 1.7% | 167,003 | 1.4% | 178,923 | 1.4% | 171,745 | 1.3% |
| |
113,290 | 5.1% | 124,216 | 4.3% | 147,262 | 4.3% | 164,676 | 4.3% |
| |
65,335 | 0.5% | 94,096 | 0.5% | 118,968 | 0.6% | 129,081 | 0.5% |
| |
44,011 | 1.8% | 70,940 | 1.9% | 106,771 | 2.1% | 124,618 | 1.9% |
| |
59,948 | 2.3% | 75,646 | 2.2% | 109,744 | 2.6% | 119,164 | 2.4% |
| |
56,567 | 0.7% | 90,375 | 0.6% | 114,687 | 0.7% | 117,444 | 0.6% |
| |
98,995 | 15.8% | 106,361 | 15.2% | 115,292 | 15.3% | 113,543 | 14.0% |
| |
94,083 | 0.6% | 90,158 | 0.5% | 90,524 | 0.5% | 92,796 | 0.5% |
| |
82,579 | 12.0% | 86,460 | 10.8% | 95,525 | 10.6% | 90,425 | 9.3% |
| |
72,084 | 0.8% | 72,261 | 0.7% | 85,753 | 0.9% | 86,872 | 0.9% |
| |
30,053 | 2.3% | 36,178 | 2.0% | 60,567 | 2.7% | 70,946 | 2.5% |
| |
24,409 | 0.5% | 35,815 | 0.5% | 46,877 | 0.7% | 49,826 | 0.6% |
| |
27,840 | 3.4% | 32,956 | 3.2% | 46,308 | 3.6% | 47,891 | 3.1% |
| |
25,447 | 0.2% | 31,146 | 0.2% | 38,869 | 0.3% | 47,839 | 0.4% |
| |
10,775 | 0.2% | 20,184 | 0.3% | 32,627 | 0.4% | 47,136 | 0.5% |
| |
23,580 | 0.5% | 29,531 | 0.5% | 40,887 | 0.7% | 45,428 | 0.8% |
| |
42,697 | 0.6% | 46,991 | 0.6% | 48,403 | 0.6% | 44,010 | 0.5% |
| |
27,410 | 0.3% | 31,911 | 0.2% | 41,537 | 0.4% | 42,658 | 0.4% |
| |
27,522 | 1.9% | 30,533 | 1.9% | 39,536 | 2.3% | 39,921 | 2.2% |
| |
14,531 | 2.1% | 23,229 | 1.9% | 38,353 | 1.9% | 38,154 | 1.4% |
| |
12,214 | 0.3% | 21,388 | 0.3% | 33,858 | 0.4% | 35,881 | 0.4% |
| |
29,015 | 0.5% | 30,726 | 0.5% | 36,106 | 0.6% | 34,355 | 0.5% |
| |
21,725 | 0.5% | 25,978 | 0.4% | 34,174 | 0.6% | 33,650 | 0.5% |
| |
18,635 | 0.9% | 21,878 | 0.8% | 29,773 | 1.1% | 32,242 | 1.1% |
| |
18,783 | 0.5% | 22,520 | 0.4% | 27,131 | 0.5% | 31,020 | 0.5% |
| |
15,100 | 4.6% | 23,087 | 4.1% | 26,439 | 4.2% | 30,366 | 4.3% |
| |
9,122 | 0.2% | 12,098 | 0.2% | 21,654 | 0.4% | 28,009 | 0.4% |
| |
14,065 | 0.6% | 17,401 | 0.5% | 21,923 | 0.6% | 23,507 | 0.6% |
| |
18,157 | 0.6% | 19,004 | 0.5% | 21,693 | 0.6% | 18,403 | 0.5% |
| |
9,909 | 0.8% | 13,936 | 0.9% | 18,088 | 1.0% | 18,078 | 0.9% |
| |
6,521 | 0.2% | 8,489 | 0.2% | 13,779 | 0.3% | 17,230 | 0.4% |
| |
15,263 | 3.8% | 18,047 | 3.9% | 21,204 | 4.3% | 16,900 | 3.1% |
| |
5,897 | 0.2% | 9,170 | 0.2% | 14,279 | 0.4% | 14,916 | 0.3% |
| |
6,185 | 0.3% | 8,778 | 0.3% | 13,046 | 0.5% | 13,293 | 0.5% |
| |
5,693 | 0.2% | 7,355 | 0.1% | 10,826 | 0.3% | 12,345 | 0.3% |
| |
5,592 | 0.7% | 8,401 | 0.7% | 10,301 | 0.8% | 11,229 | 0.8% |
| |
8,121 | 0.2% | 9,510 | 0.2% | 11,520 | 0.3% | 11,128 | 0.2% |
| |
5,472 | 0.5% | 7,256 | 0.5% | 9,827 | 0.8% | 9,008 | 0.7% |
| |
7,707 | 0.8% | 9,054 | 0.8% | 9,632 | 0.8% | 8,249 | 0.6% |
| |
3,384 | 0.1% | 4,052 | 0.1% | 7,088 | 0.2% | 6,226 | 0.2% |
| |
2,511 | 0.5% | 3,036 | 0.4% | 3,941 | 0.5% | 4,777 | 0.5% |
| |
3,560 | 0.4% | 4,010 | 0.3% | 4,307 | 0.4% | 4,697 | 0.4% |
| |
2,454 | 0.5% | 3,537 | 0.6% | 4,498 | 0.7% | 4,544 | 0.7% |
| |
2,211 | 0.1% | 2,598 | 0.1% | 3,855 | 0.2% | 3,880 | 0.2% |
| | 2,006 | 0.3% | 2,620 | 0.4% | 2,336 | 0.4% | 3,801 | 0.6% |
| | 318 | 0.0% | 172 | 0.0% |
Language usage

Use of the Norwegian language in the United States was at its peak between 1900 and World War I, then declined in the 1920s and 1930s. Over one million Americans spoke Norwegian as their primary language from 1900 to World War I, and more than 3,000 Lutheran churches in the Upper Midwest used Norwegian as their sole language. There were hundreds of Norwegian-language newspapers across the Upper Midwest:
- Decorah Posten and Skandinaven were major Norwegian language newspapers.
- The Northfield Independent was another notable newspaper. The editor was Andrew Rowberg, who collected massive numbers of Norwegian births and deaths in U.S. The file he created is now known as The Rowberg File Maintained at St. Olaf College, and is commonly used in family research across the USA and Norway.
- Over 600,000 homes received at least one Norwegian newspaper in 1910.
However, use of the language declined in part due to the rise of nationalism among the American population during and after World War I. During this period, readership of Norwegian-language publications fell. Norwegian Lutheran churches began to hold their services in English, and the younger generation of Norwegian Americans was encouraged to speak English rather than Norwegian. When Norway itself was liberated from Nazi Germany in 1945, relatively few Norwegian Americans under the age of 40 still spoke Norwegian as their primary language (although many still understood the language). As such, they were not passing the language on to their children, the next generation of Norwegian Americans.
Some sources stated that today there are 81,000 Americans who speak Norwegian as their primary language, however, according to the US Census, only 55,475 Americans spoke Norwegian at home as of 2000, and the American Community Survey in 2005 showed that only 39,524 people use the language at home.[18] Still, most Norwegian Americans can speak a common Norwegian with easy words like hello, yes and no. Today, there are still 1,209 people who only understand Norwegian or who do not speak English well in the United States. In 2000 this figure was 215 for those under 17 years old, whereas it increased to 216 in 2005. For other age groups, the numbers went down. For those who are from 18 to 64 years old, went down from 915 in 2000 to 491 in 2005. For those who are older than 65 years it went drastically down from 890 to 502 in the same period.[18] The Norwegian language is likely to never die out in the U.S. because there is still immigration, of course on a much smaller scale, but they emigrate often to other areas, like Texas, where the number of Norwegian speakers increase.
Many Lutheran colleges that were established by immigrants and people of Norwegian background, such as Luther College in Decorah, Iowa, Pacific Lutheran University in Tacoma, Washington, and St. Olaf College in Northfield, Minnesota, continue to offer Norwegian majors in their undergraduate programs. Many major American universities, such as the University of Washington, University of Oregon, University of Wisconsin–Madison, and the Indiana University offer Norwegian as a language within their Germanic language studies programs.
Two Norwegian Lutheran churches in the United States continue to use Norwegian as a primary liturgical language, Mindekirken in Minneapolis and Minnekirken in Chicago. There are also several Norwegian Seaman's Churches in the US that have services in Norwegian. They are located in Houston, Los Angeles, San Francisco, Miami, New Orleans, and New York.
Literary writing in Norwegian in North America includes the works of Ole Edvart Rølvaag, whose best-known work Giants in the Earth ("I de dage", literally In Those Days) was published in both English and Norwegian versions. Rølvaag was a professor from 1906 to 1931 at St. Olaf College, where he was also head of the Norwegian studies department beginning in 1916.
Communities by Norwegian speakers
U.S. communities with high percentages of people who use Norwegian language are:[19]
- Blair, Wisconsin 8.54%
- Westby, Wisconsin 7.67%
- Northwood, North Dakota 4.41%
- Fertile, Minnesota 4.26%
- Spring Grove, Minnesota 4.14%
- Mayville, North Dakota 3.56%
- Strum, Wisconsin 2.86%
- Crosby, North Dakota 2.81%
- Twin Valley, Minnesota 2.54%
- Velva, North Dakota 2.52%
Counties by Norwegian speakers
The ten U.S. counties with the highest percentage of Norwegian language speakers are:[19]
- Divide County, North Dakota 2.3%
- Griggs County, North Dakota 2.0%
- Nelson County, North Dakota 2.0%
- Norman County, Minnesota 2.0%
- Traill County, North Dakota 2.0%
- Vernon County, Wisconsin 1.8%
- Steele County, North Dakota 1.6%
- Trempealeau County, Wisconsin 1.6%
- Lac qui Parle County, Minnesota 1.5%
- Pennington County, Minnesota 1.0%
States by Norwegian speakers
| State | Age 5-17 | Age 18-64 | Age 65- | Total (2005)[20] | Percent (2005) | Total (2000)[21] | Percent (2000) |
|---|---|---|---|---|---|---|---|
| | 3,584 | 21,203 | 14,737 | 39,524 | 0.0% | 55,311 | 0.0% |
| | 234 | 2,977 | 1,458 | 4,669 | 0.0% | 5,865 | 0.0% |
| | 351 | 2,308 | 1,956 | 4,615 | 0.0% | 5,460 | 0.0% |
| | 140 | 881 | 1,951 | 2,972 | 0.0% | 8,060 | 0.1% |
| | 313 | 2,470 | 142 | 2,925 | 0.0% | 2,209 | 0.0% |
| | 118 | 1,394 | 1,321 | 2,833 | 0.0% | 4,200 | 0.0% |
| | 100 | 841 | 1,592 | 2,533 | 0.0% | 3,520 | 0.0% |
| | 366 | 1,208 | 469 | 2,043 | 0.0% | 2,709 | 0.0% |
| | 204 | 442 | 1,097 | 1,743 | 0.2% | 2,809 | 0.4% |
| | 313 | 793 | 304 | 1,410 | 0.0% | 1,829 | 0.0% |
| | 84 | 465 | 709 | 1,258 | 0.0% | 360 | 0.0% |
| | 595 | 551 | 1,146 | 0.1% | 920 | 0.1% | |
| | 286 | 459 | 299 | 1,044 | 0.0% | 1,150 | 0.0% |
| | 695 | 323 | 1,018 | 0.0% | 1,105 | 0.0% | |
| | 295 | 515 | 810 | 0.0% | 1,069 | 0.0% | |
| | 63 | 482 | 248 | 793 | 0.0% | 789 | 0.0% |
| | 104 | 517 | 46 | 667 | 0.0% | 1,389 | 0.0% |
| | 127 | 279 | 216 | 622 | 0.0% | 1,110 | 0.0% |
| | 138 | 411 | 72 | 621 | 0.0% | 525 | 0.0% |
| | 170 | 243 | 94 | 507 | 0.0% | 740 | 0.0% |
| | 425 | 80 | 505 | 0.0% | 255 | 0.0% | |
Norwegian Lutheran Church


While Norway is one of the most secular countries in the world,[22] Norwegians are one of the most religious ethnic groups in the U.S., with 90% acknowledging a religious affiliation.[23]
Most Norwegian immigrants to the United States, particularly in the migration wave between the 1860s and early 20th century, were members of the Church of Norway, an evangelical Lutheran church established by the Constitution of Norway. As they settled in their new homeland and forged their own communities, however, Norwegian-American Lutherans diverged from the state church in many ways, forming synods and conferences that ultimately contributed to the present Lutheran establishment in the United States.[24]
The Norwegian Lutheran church was a focal point in rural settlements in the Upper Midwest. The congregation became an all-encompassing institution for its members, creating a tight social network that touched all aspects of immigrant life. The force of tradition in religious practice made the church a central institution in the urban environment as well. The severe reality of urban life increased the social role of the church.
The Church of Norway largely ignored the immigrants and provided no guidance. As a consequence, no fewer than 14 Lutheran synods were founded by Norwegian immigrants between 1846 and 1900. In 1917 most of the factions reconciled doctrinal differences and organized the Norwegian Lutheran Church in America. It was one of the church bodies that in 1960 formed the American Lutheran Church, which in 1988 became a constituent part of the newly created Evangelical Lutheran Church in America.[25]
Most Norwegians have been Lutheran. There were Methodists concentrated especially in Chicago, with its own theological seminary. Some Norwegians became Baptists. There were also groups of Quakers, relating back to "the Sloopers," and Mormons who joined the trek to the "New Jerusalem" in Salt Lake City, Utah.
-

St. Olaf Kirke, constructed in 1884, in Cranfills Gap, Texas.
-

Norwegian Lutheran Church in Irwin, Iowa, in 1941.
-

Norwegian Lutheran Memorial Church in Minneapolis, Minnesota, built in 1922.
-

Chapel in the Hills, a replica of an historic stave church, consecrated in 1969 in Rapid City, South Dakota.
|


Norwegian Lutheran colleges
- Augsburg College Minneapolis, Minnesota
- Augustana College Sioux Falls, South Dakota
- Bethany Lutheran College Mankato, Minnesota
- Concordia College Moorhead, Minnesota
- Luther College Decorah, Iowa
- Pacific Lutheran University Parkland, Washington
- St. Olaf College Northfield, Minnesota
- Waldorf College Forest City, Iowa
Notable Norwegian Americans

In entertainment, Sigrid Gurie, "the siren of the fjords," starred in numerous motion pictures in the 1930s and 1940s. Other Hollywood actors and personalities with one Norwegian parent or grandparent include James Arness, Paris Hilton, James Cagney, Peter Graves, Tippi Hedren, Lance Henriksen, Celeste Holm, Kristanna Loken, Robert Mitchum, Piper Perabo, Priscilla Presley, Michelle Williams and Renée Zellweger. Seminal protopunk musicians Iggy Pop of The Stooges and David Johansen of the New York Dolls and Don Dokken of the heavy metal band Dokken have Norwegian ancestry.
In journalism, Eric Sevareid, was a well-known a CBS reporter and commentator. In literature, Ole Edvart Rølvaag wrote about the immigrant experience, especially the Norwegian-American experience in The Dakotas. Rølvaag's home is a National Historic Landmark.
In labor unions, Andrew Furuseth was largely responsible for the passage of four reforms that changed the lives of American mariners. Two of them, the Maguire Act of 1895 and the White Act of 1898, ended corporal punishment and abolished imprisonment for deserting a vessel. The Seamen's Act of 1915 included all these and was his main project.
Minnesota Democratic Senators Hubert Humphrey and Walter Mondale served as the 38th and 42nd Vice Presidents of the United States, respectively, and were nominees for President in 1968 and 1984, respectively. Earl Warren of California was the 14th Chief Justice of the United States.
In science, Ernest Lawrence won the Nobel Prize in Physics in 1939.[26] Lars Onsager won the 1968 Nobel Prize in Chemistry. Norman Borlaug, father of the Green Revolution, won the Nobel Peace Prize in 1970. Christian B. Anfinsen won the Nobel Prize for chemistry in 1972. Ivar Giaever won the Nobel Prize in Physics 1973. Carl Richard Hagen is noted for his work in physics.
In engineering, Clayton Jacobson II is credited with the invention of the modern personal watercraft. Ole Singstad was a pioneer of underwater tunnels. Ole Evinrude invented the first outboard motor with practical commercial application, recognizable today on modern motorboats.
In religion, Olaf M. Norlie created the Simplified New Testament. Herman Amberg Preus was a key leader in the development of the Synod of the Norwegian Evangelical Lutheran Church in America. Bernt Julius Muus was the principal founder and Thorbjorn N. Mohn was the first president of St. Olaf College. Peter Laurentius Larsen and Ulrik Vilhelm Koren both helped found Luther College (Iowa)[27]
In business, Ole Bardahl founded the Bardahl company, Conrad Nicholson Hilton was the founder of the Hilton Hotels chain, Kenneth Harry Olsen co-founded Digital Equipment Corporation, James Trane and Reuben Trane founded Trane Inc., N. O. Nelson was the founder of the N. O. Nelson Manufacturing Co. and Alfred M. Moen founded Moen, Inc.
In sports, Knute Rockne became one of the greatest coaches in college football history, while Babe Zaharias was named by the Guinness Book of Records as the most versatile female athlete of all time. Zaharias achieved outstanding success in golf, basketball and track and field athletics. Additionally, Stein Eriksen won the gold medal in the Giant Slalom event at the 1952 Winter Olympics, which were held in Oslo, Norway. He also won a silver medal in the slalom race. Eriksen was the first skier from outside the Alps to win an Olympic men's alpine gold medal. He also won three gold medals at the 1954 World Championships in Åre, Sweden, and a bronze medal at the 1950 World Championships in Aspen, Colorado. Shortly after his success in the 1952 Olympics, Eriksen moved to America where he continues to live. He worked as a ski-instructor and ski school-director at various ski schools such as Sugarbush in Vermont, and Aspen in Colorado. He is currently director of skiing at the Deer Valley Resort in Utah, and also serves as host of the Stein Eriksen Lodge, a ski lodge in Deer Valley, Utah.
In medicine, Earl Bakken developed the first wearable transistorized pacemaker and founded the Fortune 500 medical technology company Medtronic as well as the Bakken Museum. John H. Lawrence, is known as the father of nuclear medicine. As many historians claim, the genesis of this medical specialty in the United States took place in 1936, when John Lawrence took a leave of absence from his faculty position at Yale Medical School, to visit his brother Ernest Lawrence at his new radiation laboratory (now known as the Lawrence Berkeley National Laboratory) in Berkeley, California.[28]
In humanitarian work, Greg Mortenson, born in Minnesota, whose ancestors came from Tromsø in 1876, has worked since 1993 to build over 150 schools for girls in Pakistan and Afghanistan. He is the author of best-seller Three Cups of Tea, which has sold over 4 million copies in 49 countries, including Norway.
Communities by percentage of Norwegians
| Part of a series on |
| Norwegians |
|---|
| Culture |
|
| By country or region |
| Other |
| Norwegian Portal |


The 100 U.S. communities with the highest percentage of residents claiming Norwegian ancestry (those in bold are the largest in the state) are:[29]
- Northwood, North Dakota 55.5%
- Fertile, Minnesota 54.4%
- Blair, Wisconsin 53.3%
- Crosby, North Dakota 52.3%
- Spring Grove, Minnesota 52.0%
- Strum, Wisconsin 50.9%
- Twin Valley, Minnesota 49.9%
- Mayville, North Dakota 48.5%
- Westby, Wisconsin 48.1%
- Maddock, North Dakota 47.6%[30]
- Cooperstown, North Dakota 46.6%
- Rushford, Minnesota 46.5%
- Christiana, Wisconsin 46.4%
- Tioga, North Dakota 45.7%
- Starbuck, Minnesota 45.0%
- Hawley, Minnesota 44.5%
- Jefferson, Wisconsin 43.7%
- Franklin, Wisconsin 43.0%
- Sumner, Wisconsin 43.0%
- Osseo, Wisconsin 42.9%
- Ada, Minnesota 42.9%
- Stanley, North Dakota 42.4%
- Lake Mills, Iowa 42.3%
- Dawson, Minnesota 42.2%
- Fosston, Minnesota 42.1%
- Bagley, Minnesota 41.0%
- Viroqua, Wisconsin 40.4%
- Ettrick, Wisconsin 40.3%
- Karlstad, Minnesota 39.4%
- Lakota, North Dakota 39.2%
- Thief River Falls, Minnesota 39.0%
- Dane Prairie Township, Otter Tail County, Minnesota 39.0%
- Madison, Minnesota 38.8%
- Pigeon, Wisconsin 38.7%
- Harmony, Minnesota 38.4%
- Viroqua, Wisconsin 38.4%
- Sparta Township, Minnesota 38.1%
- Velva, North Dakota 38.1%
- Clarkfield, Minnesota 38.0%
- Wanamingo, Minnesota 38.0%
- Williston, North Dakota 37.6%
- Hillsboro, North Dakota 37.3%
- Hamburg, Wisconsin 37.2%
- Lake Park, Minnesota 37.2%
- Park River, North Dakota 37.1%
- Watford City, North Dakota 37.0%
- Preston, Wisconsin 37.0%
- Colfax, Wisconsin 36.7%
- Whitehall, Wisconsin 36.4%
- Hale, Wisconsin 36.1%
- Montevideo, Minnesota 35.9%
- Dunn Township, Minnesota 35.2%
- Northwood, Iowa 35.0%
- Cormorant Township, Minnesota 34.9%
- New Rockford, North Dakota 34.4%
- Oakport, Minnesota 34.3%
- Dunkirk, Wisconsin 34.3
- Williston, North Dakota 34.2%
- Houston, Minnesota 34.1%
- Rocksbury Township, Minnesota 34.1%
- Roseau, Minnesota 33.6%
- Fergus Falls, Minnesota 33.6%
- Thompson, North Dakota 33.6%
- Copley Township, Minnesota 33.5%
- Pelican Township, Minnesota 33.5%
- Kenyon, Minnesota 33.5%
- Albert Lea, Minnesota 33.4%
- Reeder, North Dakota 33.3%
- Rugby, North Dakota 33.1%
- Lida Township, Minnesota 33.0%
- Fergus Falls, Minnesota 33.0%
- Glyndon, Minnesota 33.0%
- Granite Falls, Minnesota 32.7%
- Mondovi, Wisconsin 32.7%
- Woodville, Wisconsin 32.6%
- Gale, Wisconsin 32.5%
- Bottineau, North Dakota 32.1%
- Bancroft Township, Minnesota 32.1%
- Garrison, North Dakota 31.8%
- Horace, North Dakota 31.7%
- Lake Andrew Township, Minnesota 31.6%
- Grafton, North Dakota 31.4%
- Moranville Township, Minnesota 31.4%
- Barnesville, Minnesota 31.3%
- Stanley, North Dakota 31.2%
- Colfax, Wisconsin 31.1%
- Elbow Lake, Minnesota 31.1%
- Lake Eunice Township, Minnesota 30.9%
- Enderlin, North Dakota 30.8%
- Moorhead, Minnesota 30.6%
- Blanchardville, Wisconsin 30.6%
- Volga, South Dakota 30.3%
- Lisbon, North Dakota 30.2%
- Pickerel Lake Township, Minnesota 30.2%
- Scobey, Montana 30.1%
- Wiota, Wisconsin 30.0%
- Valley City, North Dakota 29.9%
- Nedrose Township, North Dakota 29.8%
- Galesville, Wisconsin 29.8%
- Warren, Minnesota 29.7%
Counties by percentage of Norwegians
The 500 U.S. counties with the highest percentage of residents claiming Norwegian ancestry (those in bold are the largest in the state) are:[31]
- Divide County, North Dakota 64.7%
- Steele County, North Dakota 62.0%
- Traill County, North Dakota 59.0%
- Norman County, Minnesota 58.9%
- Griggs County, North Dakota 58.9%
- Nelson County, North Dakota 54.8%
- Burke County, North Dakota 53.1%
- Pennington County, Minnesota 50.6%
- Williams County, North Dakota 48.2%
- Lac qui Parle County, Minnesota 47.9%
- Eddy County, North Dakota 47.4%
- Marshall County, Minnesota 46.9%
- Bottineau County, North Dakota 46.0%
- Grant County, Minnesota 43.8%
- Polk County, Minnesota 43.3%
- Clearwater County, Minnesota 42.6%
- Renville County, North Dakota 42.4%
- Roseau County, Minnesota 42.3%
- Clay County, Minnesota 42.2%
- Barnes County, North Dakota 40.8%
- Walsh County, North Dakota 40.6%
- Winnebago County, Iowa 40.3%
- Trempealeau County, Wisconsin 39.9%
- Pope County, Minnesota 39.7%
- Chippewa County, Minnesota 39.4%
- Ransom County, North Dakota 39.3%
- Fillmore County, Minnesota 39.0%
- Pierce County, North Dakota 39.0%
- Yellow Medicine County, Minnesota 38.9%
- Daniels County, Montana 37.6%
- Worth County, Iowa 37.3%
- Freeborn County, Minnesota 37.1%
- Ramsey County, North Dakota 37.1%
- Cass County, North Dakota 36.9%
- Mountrail County, North Dakota 36.8%
- Sargent County, North Dakota 36.5%
- Vernon County, Wisconsin 36.1%
- McHenry County, North Dakota 35.6%
- Kittson County, Minnesota 35.4%
- Sheridan County, Montana 35.1%
- Marshall County, South Dakota 35.1%
- Grand Forks County, North Dakota 34.9%
- McKenzie County, North Dakota 34.2%
- Towner County, North Dakota 34.0%
- Winneshiek County, Iowa 33.9%
- Red Lake County, Minnesota 33.9%
- Bowman County, North Dakota 33.7%
- Houston County, Minnesota 33.4%
- Swift County, Minnesota 33.4%
- Foster County, North Dakota 33.4%
- Otter Tail County, Minnesota 32.9%
- Wilkin County, Minnesota 32.2%
- Deuel County, South Dakota 31.8%
- Ward County, North Dakota 30.3%
- Day County, South Dakota 30.3%
- Harding County, South Dakota 30.2%
- Jackson County, Wisconsin 30.1%
- Adams County, North Dakota 30.0%
- Cavalier County, North Dakota 30.0%
- Richland County, North Dakota 29.5%
- Richland County, North Dakota 29,5
- Becker County, Minnesota 28.7%
- Dodge County, Minnesota 28.6%
- Kandiyohi County, Minnesota 28.6%
- Pembina County, North Dakota 28.4%
- Wells County, North Dakota 28.4%
- McLean County, North Dakota 27.2%
- Douglas County, Minnesota 27.1%
- Lake of the Woods County, Minnesota 27.0%
- Benson County, North Dakota 26.8%
- Mower County, Minnesota 25.8%
- McCone County, Montana 25.6%
- Clark County, South Dakota 25.6%
- Brookings County, South Dakota 25.4%
- Dunn County, Wisconsin 25.4%
- LaMoure County, North Dakota 25.2%
- Goodhue County, Minnesota 25.0%
- Kingsbury County, South Dakota 25.0%
- Codington County, South Dakota 24.8%
- Buffalo County, Wisconsin 24.8%
- Eau Claire County, Wisconsin 24.6%
- Stevens County, Minnesota 24.5%
- Valley County, Montana 24.5%
- Hamlin County, South Dakota 24.4%
- Richland County, Montana 24.2%
- Lincoln County, South Dakota 24.1%
- Barron County, Wisconsin 24.0%
- Faribault County, Minnesota 23.9%
- Koochiching County, Minnesota 23.9%
- Big Stone County, Minnesota 23.8%
- Slope County, North Dakota 23.6%
- La Crosse County, Wisconsin 23.2%
- St. Croix County, Wisconsin 22.5%
- Lake County, Minnesota 22.4%
- Hubbard County, Minnesota 22.3%
- Moody County, South Dakota 22.2%
- Lake County, South Dakota 21.9%
- Stutsman County, North Dakota 21.8%
- Steele County, Minnesota 21.7%
- Sweet Grass County, Montana 21.7%
- Fallon County, Montana 21.4%
- Campbell County, South Dakota 21.4%
- Perkins County, South Dakota 21.4%
- Polk County, Wisconsin 21.3%
- Phillips County, Montana 21.2%
- Roberts County, South Dakota 21.2%
- Beltrami County, Minnesota 21.1%
- Mahnomen County, Minnesota 21.0%
- Watonwan County, Minnesota 21.0%
- Grant County, South Dakota 20.8%
- Allamakee County, Iowa 20.2%
- Cottonwood County, Minnesota 20.1%
- Kidder County, North Dakota 20.1%
- Emmet County, Iowa 20.0%
- Rock County, Minnesota 20.0%
- Cook County, Minnesota 19.8%
- Renville County, Minnesota 19.7%
- Dawson County, Montana 19.6%
- Liberty County, Montana 19.6%
- Humboldt County, Iowa 19.5%
- Minnehaha County, South Dakota 19.5%
- Pierce County, Wisconsin 19.2%
- Lincoln County, Minnesota 19.1%
- Haakon County, South Dakota 19.1%
- Howard County, Iowa 18.9%
- Iowa County, Wisconsin 18.9%
- Wright County, Iowa 18.7%
- Burleigh County, North Dakota 18.7%
- Olmsted County, Minnesota 18.6%
- Toole County, Montana 18.6%
- Sanborn County, South Dakota 18.6%
- Mitchell County, Iowa 18.5%
- Lyon County, Minnesota 18.5%
- Chippewa County, Wisconsin 18.5%
- Crow Wing County, Minnesota 18.3%
- Dunn County, North Dakota 18.3%
- Miner County, South Dakota 18.2%
- Lafayette County, Wisconsin 17.9%
- Hamilton County, Iowa 17.8%
- Anoka County, Minnesota 17.4%
- Waseca County, Minnesota 17.4%
- Turner County, South Dakota 17.4%
- Dickey County, North Dakota 17.2%
- Pipestone County, Minnesota 17.1%
- Wibaux County, Montana 17.1%
- Green County, Wisconsin 17.1%
- Rice County, Minnesota 17.0%
- Golden Valley County, North Dakota 17.0%
- Hancock County, Iowa 16.9%
- Sherburne County, Minnesota 16.9%
- Winona County, Minnesota 16.8%
- Mille Lacs County, Minnesota 16.7%
- Redwood County, Minnesota 16.7%
- Clay County, South Dakota 16.7%
- Blue Earth County, Minnesota 16.6%
- Cass County, Minnesota 16.6%
- Isanti County, Minnesota 16.6%
- Jackson County, Minnesota 16.6%
- Oliver County, North Dakota 16.5%
- Cerro Gordo County, Iowa 16.4%
- Sheridan County, North Dakota 16.3%
- Murray County, Minnesota 16.2%
- St. Louis County, Minnesota 16.1%
- Pepin County, Wisconsin 16.1%
- Dakota County, Minnesota 16.0%
- Kanabec County, Minnesota 16.0%
- Nicollet County, Minnesota 16.0%
- Burnett County, Wisconsin 15.9%
- Aitkin County, Minnesota 15.7%
- Union County, South Dakota 15.7%
- Carlton County, Minnesota 15.6%
- Carter County, Montana 15.6%
- Scott County, Minnesota 15.5%
- Brown County, South Dakota 15.5%
- Itasca County, Minnesota 15.4%
- Wadena County, Minnesota 15.4%
- Crawford County, Wisconsin 15.4%
- Douglas County, Wisconsin 15.2%
- Carver County, Minnesota 15.1%
- Wright County, Minnesota 14.9%
- Pondera County, Montana 14.9%
- Hill County, Montana 14.8%
- Monroe County, Wisconsin 14.8%
- Hennepin County, Minnesota 14.7%
- Martin County, Minnesota 14.7%
- Hettinger County, North Dakota 14.6%
- Rock County, Wisconsin 14.6%
- Meeker County, Minnesota 14.4%
- Teton County, Montana 14.4%
- Chisago County, Minnesota 14.3%
- Washington County, Minnesota 14.3%
- Treasure County, Montana 14.3%
- Mercer County, North Dakota 14.3%
- Yankton County, South Dakota 14.3%
- Traverse County, Minnesota 14.2%
- Morton County, North Dakota 14.2%
- Petroleum County, Montana 14.0%
- Stark County, North Dakota 13.9%
- Washburn County, Wisconsin 13,9%
- Meagher County, Montana 13.8%
- Wabasha County, Minnesota 13.6%
- Prairie County, Montana 13.6%
- Hughes County, South Dakota 13.6%
- Jones County, South Dakota 13.6%
- Dane County, Wisconsin 13.6%
- Wrangell-Petersburg Census Area, Alaska 13.5%
- Beadle County, South Dakota 13.5%
- Billings County, North Dakota 13.4%
- Palo Alto County, Iowa 13.3%
- Roosevelt County, Montana 13.3%
- Bayfield County, Wisconsin 13.3%
- Todd County, Minnesota 13.1%
- Custer County, Montana 13.1%
- Hyde County, South Dakota 13.0%
- Pine County, Minnesota 12.8%
- Fergus County, Montana 12.8%
- Richland County, Wisconsin 12.6%
- Lawrence County, South Dakota 12.4%
- Columbia County, Wisconsin 12.3%
- Story County, Iowa 12.1%
- Brown County, Minnesota 12.1%
- Stillwater County, Montana 12.1%
- Judith Basin County, Montana 11.9%
- Butte County, South Dakota 11.9%
- Davison County, South Dakota 11.8%
- Stearns County, Minnesota 11.7%
- Chouteau County, Montana 11.7%
- Lyman County, South Dakota 11.7%
- Stanley County, South Dakota 11.7%
- Wheatland County, Montana 11.6%
- Yellowstone County, Montana 11.5%
- McLeod County, Minnesota 11.3%
- Meade County, South Dakota 11.3%
- Dickinson County, Iowa 11.2%
- Le Sueur County, Minnesota 11.2%
- Jerauld County, South Dakota 11.2%
- Benton County, Minnesota 11.0%
- Cascade County, Montana 11.0%
- Pennington County, South Dakota 11.0%
- Ramsey County, Minnesota 10.9%
- Flathead County, Montana 10.9%
- Fayette County, Iowa 10.8%
- McCook County, South Dakota 10.7%
- Wahkiakum County, Washington 10.7%
- Rusk County, Wisconsin 10.6%
- Hardin County, Iowa 10.5%
- Waupaca County, Wisconsin 10.5%
- Lewis and Clark County, Montana 10.4%
- Fall River County, South Dakota 10.4%
- Juneau County, Wisconsin 10.4%
- Webster County, Iowa 10.3%
- Grant County, North Dakota 10.3%
- Brule County, South Dakota 10.3%
- Kossuth County, Iowa 10.1%
- Nobles County, Minnesota 10.1%
- Rolette County, North Dakota 10.1%
- Park County, Montana 10.0%
- Walworth County, South Dakota 10.0%
- Clay County, Iowa 9.9%
- Adams County, Wisconsin 9.8%
- Chickasaw County, Iowa 9.7%
- Logan County, North Dakota 9.7%
- Ashland County, Wisconsin 9.6%
- Door County, Wisconsin 9.6%
- Kalawao County, Hawaii 9.5%
- Morrison County, Minnesota 9.5%
- Gallatin County, Montana 9.5%
- Blaine County, Montana 9.4%
- Monona County, Iowa 9.3%
- Lincoln County, Montana 9.3%
- Carbon County, Montana 9.2%
- Missoula County, Montana 9.2%
- Grundy County, Illinois 9.1%
- Spink County, South Dakota 9.1%
- Skagit County, Washington 9.1%
- Garfield County, Montana 9.0%
- Sawyer County, Wisconsin 9.0%
- Clayton County, Iowa 8.8%
- Snohomish County, Washington 8.8%
- Ketchikan Gateway Census Area, Alaska 8.7%
- Beaverhead County, Montana 8.7%
- Broadwater County, Montana 8.7%
- Lyon County, Iowa 8.6%
- Sibley County, Minnesota 8.5%
- Musselshell County, Montana 8.5%
- Jefferson County, Montana 8.3%
- Sauk County, Wisconsin 8.3%
- Franklin County, Iowa 8.2%
- Sully County, South Dakota 8.2%
- Rosebud County, Montana 8.1%
- Jefferson County, Wisconsin 8.1%
- Golden Valley County, Montana 8.0%
- Clark County, Wisconsin 8.0%
- Price County, Wisconsin 8.0%
- Mineral County, Montana 7.9%
- Custer County, South Dakota 7.9%
- Edmunds County, South Dakota 7.9%
- Madison County, Montana 7.8%
- Hand County, South Dakota 7.8%
- Potter County, South Dakota 7.8%
- Wood County, Wisconsin 7.8%
- Boone County, Iowa 7.7%
- Floyd County, Iowa 7.6%
- Ziebach County, South Dakota 7.6%
- Jefferson County, Washington 7.6%
- Marshall County, Iowa 7.4%
- Pocahontas County, Iowa 7.4%
- Granite County, Montana 7.4%
- Powder River County, Montana 7.4%
- Bristol Bay Borough, Alaska 7.3%
- Aurora County, South Dakota 7.3%
- Kitsap County, Washington 7.2%
- Taylor County, Wisconsin 7.2%
- Powell County, Montana 7.1%
- Charles Mix County, South Dakota 7.1%
- Whatcom County, Washington 7.1%
- Whitman County, Washington 7.1%
- Grant County, Wisconsin 7.1%
- Lincoln County, Wisconsin 7.1%
- Oneida County, Wisconsin 7.1%
- Portage County, Wisconsin 7.0%
- Deer Lodge County, Montana 6.9%
- Clatsop County, Oregon 6.8%
- Faulk County, South Dakota 6.8%
- Mason County, Washington 6.8%
- Campbell County, Wyoming 6.8%
- Kendall County, Illinois 6.7%
- Bremer County, Iowa 6.7%
- Ravalli County, Montana 6.7%
- Cowlitz County, Washington 6.7%
- Kittitas County, Washington 6.7%
- Island County, Washington 6.6%
- Spokane County, Washington 6.6%
- Sitka, Alaska 6.5%
- Pierce County, Washington 6.5%
- Walworth County, Wisconsin 6.5%
- Haines, Alaska 6.4%
- Woodbury County, Iowa 6.4%
- Boundary County, Idaho 6.3%
- Latah County, Idaho 6.3%
- Lake County, Montana 6.3%
- Dixon County, Nebraska 6.3%
- Marquette County, Wisconsin 6.3%
- Sheridan County, Wyoming 6.3%
- Buena Vista County, Iowa 6.2%
- Gregory County, South Dakota 6.2%
- Grays Harbor County, Washington 6.2%
- Sanders County, Montana 6.1%
- Clallam County, Washington 6.1%
- San Juan County, Washington 6.1%
- Kootenai County, Idaho 6.0%
- King County, Washington 6.0%
- Waushara County, Wisconsin 6.0%
- Shoshone County, Idaho 5.9%
- Boone County, Nebraska 5.9%
- Emmons County, North Dakota 5.9%
- Hanson County, South Dakota 5.9%
- Hot Springs County, Wyoming 5.9%
- Black Hawk County, Iowa 5.8%
- Marathon County, Wisconsin 5.8%
- Juneau City, Alaska 5.7%
- Thurston County, Washington 5.7%
- Tripp County, South Dakota 5.6%
- Racine County, Wisconsin 5.6%
- Cherokee County, Iowa 5.5%
- Columbia County, Oregon 5.5%
- Pend Oreille County, Washington 5.5%
- Waukesha County, Wisconsin 5.5%
- Hoonah–Angoon Census Area, Alaska 5.4%
- Nez Perce, Idaho 5.4%
- DeKalb County, Illinois 5.4%
- Silver Bow County, Montana 5.4%
- Hutchinson County, South Dakota 5.4%
- Clark County, Washington 5.4%
- Weston County, Wyoming 5.4%
- O'Brien County, Iowa 5.3%
- Glacier County, Montana 5.3%
- Pacific County, Washington 5.3%
- Shawano County, Wisconsin 5.3%
- Winnebago County, Wisconsin 5.3%
- Crook County, Wyoming 5.3%
- Linn County, Iowa 5.2%
- Clackamas County, Oregon 5.2%
- La Salle County, Illinois 5.1%
- Osceola County, Iowa 5.1%
- Tama County, Iowa 5.1%
- Albany County, Wyoming 5.1%
- Matanuska-Susitna Borough, Alaska 5.0%
- McIntosh County, North Dakota 5.0%
- Morgan County, Utah 5.0%
- Skamania County, Washington 5.0%
- Manitowoc County, Wisconsin 5.0%
- Kenai Peninsula, Alaska 4.9%
- Bonner County, Idaho 4.9%
- Calhoun County, Iowa 4.9%
- Wasco County, Oregon 4.9%
- Bosque County, Texas 4.9%
- Asotin County, Washington 4.9%
- Douglas County, Washington 4.9%
- Lewis County, Washington 4.9%
- Oconto County, Wisconsin 4.9%
- Natrona County, Wyoming 4.9%
- Valley County, Idaho 4.8%
- Boone County, Illinois 4.8%
- Deschutes County, Oregon 4.8%
- Benton County, Washington 4.8%
- Chelan County, Washington 4.8%
- Stevens County, Washington 4.8%
- Outagamie County, Wisconsin 4.8%
- Park County, Wyoming 4.8%
- Benewah County, Idaho 4.7%
- Clearwater County, Idaho 4.7%
- Winnebago County, Illinois 4.7%
- Dallas County, Iowa 4.7%
- Polk County, Iowa 4.7%
- Benton County, Oregon 4.7%
- Lincoln County, Oregon 4.7%
- Polk County, Oregon 4.7%
- Bon Homme County, South Dakota 4.7%
- McPherson County, South Dakota 4.7%
- Florence County, Wisconsin 4.7%
- Valdez-Cordova Borough, Alaska 4.6%
- Yakutat City and Borough, Alaska 4.6%
- Benton County, Iowa 4.6%
- Johnson County, Iowa 4.6%
- Plymouth County, Iowa 4.6%
- Multnomah County, Oregon 4.6%
- Marinette County, Wisconsin 4.6%
- Big Horn County, Wyoming 4.6%
- Fairbanks North Star Borough, Alaska 4.5%
- Sheridan County, Nebraska 4.5%
- Coos County, Oregon 4.5%
- Lane County, Oregon 4.5%
- Washington County, Oregon 4.5%
- Daggett County, Utah 4.5%
- Harney County, Oregon 4.4%
- Sherman County, Oregon 4.4%
- Lincoln County, Washington 4.4%
- Vilas County, Wisconsin 4.4%
- Lewis County, Idaho 4.3%
- Keweenaw County, Michigan 4.3%
- Wayne County, Utah 4.3%
- Iron County, Wisconsin 4.3%
- Platte County, Wyoming 4.3%
- Lemhi County, Idaho 4.2%
- Butler County, Iowa 4.2%
- Baraga County, Michigan 4.2%
- Benzie County, Michigan 4.2%
- Delta County, Michigan 4.2%
- Banner County, Nebraska 4.2%
- Curry County, Oregon 4.2%
- Dodge County, Wisconsin 4.2%
- Kenosha County, Wisconsin 4.2%
- Lake and Peninsula Borough, Alaska 4.1%
- Grundy County, Iowa 4.1%
- Poweshiek County, Iowa 4.1%
- Dakota County, Nebraska 4.1%
- Eureka County, Nevada 4.1%
- Marion County, Oregon 4.1%
- Okanogan County, Washington 4.1%
- Walla Walla County, Washington 4.1%
- Langlade County, Wisconsin 4.1%
- Washakie County, Wyoming 4.1%
- Prince of Wales Island (Alaska) 4.0%
- Wayne County, Nebraska 4.0%
- Douglas County, Nevada 4.0%
- Crook County, Oregon 4.0%
- Linn County, Oregon 4.0%
- Yamhill County, Oregon 4.0%
- Sevier County, Utah 4.0%
- Brown County, Wisconsin 4.0%
- Ozaukee County, Wisconsin 4.0%
- Washington County, Wisconsin 4.0%
- Niobrara County, Wyoming 4.0%
- Aleutians East Borough, Alaska 3.9%
- Mono County, California 3.9%
- Ada County, Idaho 3.9%
- Buchanan County, Iowa 3.9%
- Gogebic County, Michigan 3.9%
- Rock County, Nebraska 3.9%
- Emery County, Utah 3.9%
- Green Lake County, Wisconsin 3.9%
- Sweetwater County, Wyoming 3.9%
- Anchorage, Alaska 3.8%
- Blaine County, Idaho 3.8%
- Idaho County, Idaho 3.8%
- Dickinson County, Michigan 3.8%
- Wallowa County, Oregon 3.8%
- Douglas County, South Dakota 3.8%
- Teton County, Wyoming 3.8%
- Douglas County, Colorado 3.7%
- Garfield County, Colorado 3.7%
- Grand County, Colorado 3.7%
- Larimer County, Colorado 3.7%
- Routt County, Colorado 3.7%
- Greene County, Iowa 3.7%
- Warren County, Iowa 3.7%
- Leelanau County, Michigan 3.7%
- Grant County, Nebraska 3.7%
- Klickitat County, Washington 3.7%
See also
- A Prairie Home Companion, Garrison Keillor's radio variety show contains much humorous material from the "Norwegian American Midwest".
- Canadians of Norwegian descent—whose history is interlinked with that of Norwegian Americans.
- Chapel in the Hills, stave church in Rapid City, South Dakota. It is an exact replica of the Borgund stave church in Norway.
- Chicago Norske Klub, former Norwegian-American cultural and social organization
- Daughters of Norway, a non-profit organization created to preserve Norwegian heritage in the United States.[32]
- Lapskaus Boulevard, the nickname of 8th Avenue, located in a historically Norwegian working-class neighborhood in Bay Ridge, Brooklyn.
- Little Norway, Wisconsin, tourist attraction and living museum of a Norwegian village located in Blue Mounds, Wisconsin.
- Norsk Høstfest (lit. "Norwegian Autumn Festival"), an annual festival held in October in Minot, North Dakota.
- Nordic Heritage Museum in the Ballard district of Seattle. Ballard is noted as one of the few Norwegian/Scandinavian "cultural ghettos" in Greater Seattle, which is heavily Scandinavian in background overall.
- Norse-American Centennial - celebration held at the Minnesota State Fair from June 7–9, 1925
- Norskedalen, near Coon Valley, Wisconsin, has exhibits about Norwegian Americans.
- Norge, town with historic district near Williamsburg in James City County, Virginia. Settled by Norwegian Americans and named for their homeland.
- Petersburg, Alaska, founded by the Norwegian immigrant Peter Buschmann. Known for its strong Norwegian traditions and nicknamed "Little Norway".
- Poulsbo, Washington, founded by a Norwegian immigrant that maintains a strong Norwegian culture.
- Skumsrud Heritage Farm, historic open-air museum and cultural center near Coon Valley, Wisconsin
- Sons of Norway, fraternal organization representing people of Norwegian heritage in the United States and Canada.
- Starbuck, Minnesota, Midwestern town that produces the largest lefse in the world.
- Stoughton, Wisconsin, Midwestern city known for its Norwegian heritage.
- Sunburg, Minnesota, Midwestern city famous for its celebration of its Norwegian-American heritage.
- Vesterheim Norwegian-American Museum in Decorah, Iowa: the largest museum in the United States dedicated to the experiences of a single immigrant population.
- Westby, Wisconsin, Midwestern city known for its Norwegian heritage.
Notes and references
Notes
- ^ a Incidentally, the number of Americans of Norwegian descent living in the U.S. today (4.5 million) is roughly equal to the 2005 current population of Norway (4.6 million). In April 2012 Norway´s population surpassed 5 million (ssb.no), of which 1.1 million is either born outside Norway, or born in Norway with both or one parent born outside Norway.
- ^ OliveTreeGenealogy.com: The Norwegian Bradt Family in New Netherland New York
References
- ↑ "Selected Social Characteristics in the United States: 2009"
- ↑ Vinland – Myth and Reality (University of Oslo)
- ↑ John O. Evjen. "Roelof (Roeloffse) Jansen," Scandinavian Immigrants In New York 1630 - 1674.
- ↑ Ingrid Semmingsen, C. A. Clausen (transl.). Haugeans, Rappites, and the Emigration of 1825. Norwegian-American Historical Association. Volume 29: Page 3.
- ↑ Richard L. Canuteson. The Kendall Settlement Survived. Norwegian-American Historical Association. Volume 27: Page 243.
- ↑ "Immigration; Scandinavian; Norwegians." Library of Congress. Accessed 06 Apr 2012.
- ↑ Ole Rynning’s True Account of America (Nasjonalbiblioteket)
- ↑ The Ægir People (Erling Viksund. January, 2005)
- ↑ Einar Haugen. Norwegian Migration To America. Norwegian-American Historical Association. Volume I8: Page 1.
- ↑ John R. Jenswold. "In Search of the Norwegian-American Working Class," Minnesota History (Summer 1986) pp. 63-70.
- ↑ George Lipsitz, "The meaning of memory: Family, class, and ethnicity in early network television programs." Cultural Anthropology (1986) 1#4 PP: 355-387. online
- ↑ Martin Ulvestad (2010). Norwegians in America, their History and Record: A Translated Version of the 1907 and 1913 Nordmændene i Amerika, deres Historie og Rekord.
- ↑ "Innvandring og utvandring - SSB". Retrieved 17 March 2015.
- ↑ U.S Census Bureau
- ↑ Census 1980
- ↑ Census 1990
- ↑ United States - Origins and Language - American FactFinder
- 1 2 American Community Survey
- 1 2 "Norwegian". Census 2000. Retrieved 2009-12-31.
- ↑ U.S Census 2005
- ↑ U.S Census 2000
- ↑ Andrew M. Greeley, Religion in Europe at the End of the Second Millennium: A Sociological Profile (2004) ch 10
- ↑ Odd Sverre Lovoll (1998). The Promise Fulfilled: A Portrait of Norwegian Americans Today. U of Minnesota Press. p. 89.
- ↑ "NAHA // Norwegian-American Studies". Retrieved 17 March 2015.
- ↑ Edgar R. Trexler, High Expectations: Understanding the ELCA's Early Years, 1988-2002 (2003) p. 7
- ↑ "Lawrence -- The Man, His Lab, His Legacy". Retrieved 17 March 2015.
- ↑ "Page Not Found". ELCA.org. Retrieved 17 March 2015.
- ↑ John H. Lawrence and the genesis of Nuclear Medicine
- ↑ "Ancestry Map of Norwegian Communities". Epodunk.com. Retrieved 2008-08-12.
- ↑ "Maddock, North Dakota". City-Data.com.
- ↑ "Counties with more than 30% Norwegian Ancestry". Sogn of Fjordane Fylkeskommune. Retrieved 2009-12-31.
- ↑ "Daughters of Norway". Retrieved 17 March 2015.
Further reading
- Bergland, Betty A., and Lori Ann Lahlum, eds. Norwegian American Women: Migration, Communities, and Identities (Minnesota Historical Society Press; 2011) 320 pages; scholarly essays on the experiences in rural and urban settings.
- Bjork, Kenneth. West of the Great Divide: Norwegian Migration to the Pacific Coast, 1847–1893 (Norwegian-American Historical Association, Northfield, Minn., 1958)
- Blegen, Theodore C. Norwegian Migration to the United States (2 vols., Norwegian-American Historical Association, Northfield, Minn., 1931–40)
- Blegen, Theodore C. Cleng Peerson and Norwegian Immigration, (Mississippi Valley Historical Review, 7 March 1921: 303–21)
- Evjen, John O. Scandinavian Immigrants in New York 1630-1674 (Genealogical Pub. Co., Baltimore, 1972)
- Flom, George T. A History of Norwegian Immigration to the United States: From the Earliest Beginning Down to the Year 1848 (Private Printing. Iowa City, IA. 1909)
- Gjerde, Jon. The Minds of the West: Ethnocultural Evolution in the Rural Middle West, 1830–1917 (University of North Carolina Press, 1997)
- Gjerde, Jon From Peasants to Farmers: The Migration from Balestrand, Norway, to the Upper Middle West (Cambridge, New York : Cambridge University Press, 1985)
- Jacobs, Henry Eyster. A History of the Evangelical Lutheran Church in the United States (1893)
- Lovoll, Odd S. Norwegian Newspapers in America: Connecting Norway and the New Land (Minnesota Historical Society Press; 2010) 432 pages; discusses more than 280 Norwegian-language papers, both short-lived and successful, founded after 1847.
- Mathiesen, Henrik Olav. "Belonging in the Midwest: Norwegian Americans and the Process of Attachment, ca. 1830-1860," American Nineteenth Century History 15 (no. 2, 2014) pp: 119-46.
- Munch, Peter A. Authority and Freedom: Controversy in Norwegian-American Congregations, (Norwegian-American Studies 28. 1979)
- Nelson, E. Clifford, and Eugene L. Fevold, The Lutheran Church among Norwegian Americans: A History of the Evangelical Lutheran Church (Minneapolis, Augsburg Pub. House, 2 vols. 1960)
- Nelson, O. N. History of the Scandinavians and successful Scandinavians in the United States (O. N. Nelson and Company. Minneapolis, MN: 1893)
- Norlie, Olaf M. History of the Norwegian People in America (Minneapolis, MN: Augsburg Publishing House, 1925)
- Olson, Gary D. "Norwegian Immigrants in Early Sioux Falls: A Demographic Profile," Norwegian-American Studies, 36 (2011), pp 45–84.
- Qualey, Carlton C. Norwegian Settlement in the United States (Northfield, Minn.: Norwegian-American Historical Association, 1938)
- Rygg, Andreas Nilsen Norwegians in New York, 1825— 1925 (Brooklyn, N.Y.: Norwegian News Co. 1941)
- Woods, Fred E., and Nicholas J. Evans, 'Latter-day Saint Scandinavian Migration through Hull, England, 1852-1894', BYU Studies, Volume 41, Number 4 (2002), pp. 75–102; scholarly essay on the experience of Scandinavian emigration
Primary sources:
- Blegen, Theodore C. ed. Norwegian Emigrant Songs and Ballads(Minneapolis, University of Minnesota Press, 1936)
- Evjen, John O. Scandinavian Immigrants in New York 1630-1674 (K. C. Holter Publishing Company, Minneapolis, Minnesota, 1916)
- Gulliksen, Øyvind T. Letters to Immigrants in the Midwest from the Telemark Region of Norway (Norwegian American Historic Association, Volume 32: Page 157)
- Nilsson, Svein. A Chronicler of Immigrant Life (Billed-Magazin, Madison, Wisconsin, trans. and ed. C. A. Clausen. Norwegian-American Historical Association, 1982).
- Øverland, Orm, ed. From America to Norway: Norwegian-American Immigrant Letters, 1838-1914, Volume One: 1838-1870 (University of Minnesota Press; 2013) 472 pages;
- Ræder, Ole Munch. America in the Forties: The Letters of Ole Munch Ræder (ed. and trans. Gunnar J. Malmin. Minneapolis: Norwegian-American Historical Association, 1929)
External links
Official:
- Norwegian Embassy official website in the United States—General information about Norway, news and events of interest to Americans
U.S. Census Bureau statistics:
- Norwegian population data
- States with the highest number of Norwegians—Page hosted by Mongabay.com
- Number of language speakers, including Norwegian
Associations/societies:
- Daughters of Norway - organization dedicated to preserving Norwegian immigrant heritage
- Friends of Norway Caucus — United States Congressional Caucus promoting Norwegian-American relations, founded by Norwegian-American congressmen
- Norse Federation (Nordmanns-Forbundet) - Founded in 1907; seeks to strengthen cultural as well as personal ties with Norway
- Norwegian-American Bygdelagenes Fellesraad - umbrella organization for Norwegian-American bygdelags or lags in North America
- Norwegian American Chamber of Commerce - promotes trade and goodwill and to foster business, financial and professional interest between Norway and the United States of America
- Norwegian-American Foundation - Foundation sponsoring educational and cultural initiatives based on donor advised funds and contributions
- Norwegian American Hall of Fame- Information on famous Americans, past and present, who are readily associated with their Norwegian ancestry
- Norwegian-American Historical Association — private membership organization dedicated to locating, collecting preserving and interpreting the Norwegian-American experience
- Norwegian National League - organization dedicated to the Norwegian American culture
- Sons of Norway - organization dedicated to preserving and promoting Norwegian-American heritage and culture
- Sons of Norway Vennekretsen - organization dedicated to preserving and promoting Norwegian heritage and culture in Atlanta, Georgia
Museums:
- Norsk Museum - located on highway 71 northeast of Ottawa, Illinois
- Norwegian American Genealogical Center & Naeseth Library - Norwegian and Norwegian Americang Genealogy. Collection includes bygdebøker, family histories, Norwegian church records, Norwegian American Lutheran church records, cemetery transcripts, transcripts of ship passenger lists, obituaries and more.
- University of Wisconsin–Madison Memorial Library - Norwegian Genealogy: List of Reference Sources
- Vesterheim Norwegian-American Museum - Exhibitions and collections, genealogy and Civil War databases, etc.
| Europe |
|  |
|---|---|---|
| Africa | ||
| Americas | ||
| Asia & Oceania | ||