Earth's energy budget
Earth's energy budget is an account of how much energy enters the Earth's climate system from the Sun, how much energy is lost to space and accounts for the remainder as stored on the Earth and its atmosphere.[2] Quantifying changes in these amounts is required to accurately model the Earth's climate.[3]
Received radiation is unevenly distributed over the planet, because the Sun heats equatorial regions more than polar regions. Energy is absorbed by the atmosphere, hydrosphere, and lithosphere, and, in a process informally described as Earth's heat engine, the solar heating is redistributed through evaporation of surface water, convection, rainfall, winds, and ocean circulation. When the incoming solar energy is balanced by an equal flow of heat to space, the Earth is said to be in radiative equilibrium and under that condition, global temperatures will be stable.
Disturbances of Earth's radiative equilibrium, such as an increase of greenhouse gases, will change global temperatures in response.[4] However, Earth's energy balance and heat fluxes depend on many factors, such as atmospheric composition (mainly aerosols and greenhouse gases), the albedo (reflectivity) of surface properties, cloud cover and vegetation and land use patterns. Changes in surface temperature due to Earth's energy budget do not occur instantaneously, due to the inertia of the oceans and the cryosphere. The net heat flux is buffered primarily by becoming part of the ocean's heat content, until a new equilibrium state is established between radiative forcings and the climate response.[5]
Energy budget
In spite of the enormous transfers of energy into and from the Earth, it maintains a constant temperature because, as a whole, there is no net gain or loss: Earth receives the same amount of energy via insolation (all forms of electromagnetic radiation) as it emits via atmospheric and terrestrial radiation (shifted to longer electromagnetic wavelengths) to space.
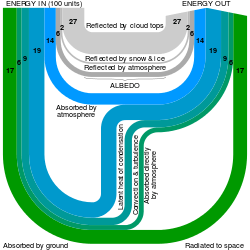
To quantify Earth's heat budget or heat balance, let the insolation received at the top of the atmosphere be 100 units, as shown in the accompanying illustration. Called the albedo of Earth, around 35 units are reflected back to space: 27 from the top of clouds, 2 from snow and ice-covered areas, and 6 by other parts of the atmosphere. The 65 remaining units are absorbed: 14 within the atmosphere and 51 by the Earth’s surface. These 51 units are radiated to space in the form of terrestrial radiation: 17 directly radiated to space and 34 absorbed by the atmosphere (19 through latent heat of condensation, 9 via convection and turbulence, and 6 directly absorbed). The 48 units absorbed by the atmosphere (34 units from terrestrial radiation and 14 from insolation) are finally radiated back to space. These 65 units (17 from the ground and 48 from the atmosphere) balance the 65 units absorbed from the sun; thereby demonstrating no net gain of energy by the Earth.[6]
Incoming radiant energy (shortwave)
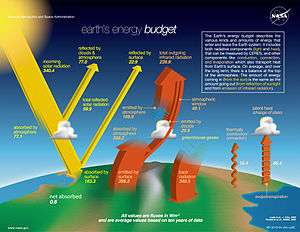
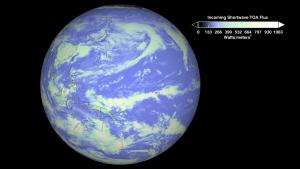
The total amount of energy received per second at the top of Earth's atmosphere (TOA) is measured in watts and is given by the solar constant times the cross-sectional area of the Earth. Because the surface area of a sphere is four times the cross-sectional surface area of a sphere (i.e. the area of a circle), the average TOA flux is one quarter of the solar constant and so is approximately 340 W/m².[1][7] Since the absorption varies with location as well as with diurnal, seasonal and annual variations, the numbers quoted are long-term averages, typically averaged from multiple satellite measurements.[1]
Of the ~340 W/m² of solar radiation received by the Earth, an average of ~77 W/m² is reflected back to space by clouds and the atmosphere and ~23 W/m² is reflected by the surface albedo, leaving ~240 W/m² of solar energy input to the Earth's energy budget. This gives the earth a mean net albedo of 0.29.[1]
Earth's internal heat and other small effects
The geothermal heat flux from the Earth's interior is estimated to be 47 terawatts.[8] This comes to 0.087 watt/square metre, which represents only 0.027% of Earth's total energy budget at the surface, which is dominated by 173,000 terawatts of incoming solar radiation.[9]
Other minor sources of energy are usually ignored in these calculations, including accretion of interplanetary dust and solar wind, light from distant stars and the thermal radiation from space. Earlier, Joseph Fourier had claimed that deep space radiation was significant in a paper often cited as the first on the greenhouse effect.[10]
Longwave radiation
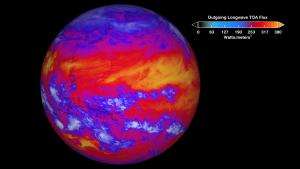
Longwave radiation is usually defined as outgoing infrared energy leaving the planet. However, the atmosphere absorbs parts initially, or cloud cover can reflect radiation. Generally, heat energy is transported between the planet's surface layers (land and ocean) to the atmosphere, transported via evapotranspiration and latent heat fluxes or conduction/convection processes.[1] Ultimately, energy is radiated in the form of longwave infrared radiation back into space.
Recent satellite observations indicate additional precipitation, which is sustained by increased energy leaving the surface through evaporation (the latent heat flux), offsetting increases in longwave flux to the surface.[3]
Earth's energy imbalance
If the incoming energy flux is not equal to the outgoing energy flux, the result is an energy imbalance, that amounts to net heat added to or lost by the planet (if the incoming flux is larger or smaller than the outgoing respectively). Earth's energy imbalance measurements provided by Argo floats have detected an accumulation of ocean heat content (OHC). The estimated imbalance was measured during a deep solar minimum of 2005-2010 to be 0.58 ± 0.15 W/m².[11] Later research estimated the surface energy imbalance to be 0.60 ± 0.17 W/m².[12]
Measurement
Several satellites indirectly measure the energy absorbed and radiated by Earth and by inference the energy imbalance. The NASA Earth Radiation Budget Experiment (ERBE) project involves three such satellites: the Earth Radiation Budget Satellite (ERBS), launched October 1984; NOAA-9, launched December 1984; and NOAA-10, launched September 1986.[13]
Today NASA's satellite instruments, provided by CERES, part of the NASA's Earth Observing System (EOS), are designed to measure both solar-reflected and Earth-emitted radiation.[14]
Natural greenhouse effect
.png)
The major atmospheric gases (oxygen and nitrogen) are transparent to incoming sunlight but are also transparent to outgoing thermal (infrared) radiation. However, water vapor, carbon dioxide, methane and other trace gases are opaque to many wavelengths of thermal radiation. The Earth's surface radiates the net equivalent of 17 percent of the incoming solar energy in the form of thermal infrared. However, the amount that directly escapes to space is only about 12 percent of incoming solar energy. The remaining fraction, 5 to 6 percent, is absorbed by the atmosphere by greenhouse gas molecules.[15]
When greenhouse gas molecules absorb thermal infrared energy, their temperature rises. Those gases then radiate an increased amount of thermal infrared energy in all directions. Heat radiated upward continues to encounter greenhouse gas molecules; those molecules also absorb the heat, and their temperature rises and the amount of heat they radiate increases. The atmosphere thins with altitude, and at roughly 5–6 kilometres, the concentration of greenhouse gases in the overlying atmosphere is so thin that heat can escape to space.[15]
Because greenhouse gas molecules radiate infrared energy in all directions, some of it spreads downward and ultimately returns to the Earth's surface, where it is absorbed. The Earth's surface temperature is thus higher than it would be if it were heated only by direct solar heating. This supplemental heating is the natural greenhouse effect.[15] It is as if the Earth is covered by a blanket that allows high frequency radiation (sunlight) to enter, but slows the rate at which the low frequency infrared radiant energy emitted by the Earth leaves.
Climate sensitivity
A change in the incident radiated portion of the energy budget is referred to as a radiative forcing.
Climate sensitivity is the steady state change in the equilibrium temperature as a result of changes in the energy budget.
Climate forcings and global warming
Climate forcings are changes that cause temperatures to rise or fall, disrupting the energy balance. Natural climate forcings include changes in the Sun's brightness, Milankovitch cycles (small variations in the shape of Earth's orbit and its axis of rotation that occur over thousands of years) and volcanic eruptions that inject light-reflecting particles as high as the stratosphere. Man-made forcings include particle pollution (aerosols) that absorb and reflect incoming sunlight; deforestation, which changes how the surface reflects and absorbs sunlight; and the rising concentration of atmospheric carbon dioxide and other greenhouse gases, which decreases the rate at which heat is radiated to space.
A forcing can trigger feedbacks that intensify (positive feedback) or weaken (negative feedback) the original forcing. For example, loss of ice at the poles, which makes them less reflective, causes greater absorption of energy and so increases the rate at which the ice melts, is an example of a positive feedback.[16]
The observed planetary energy imbalance during the recent solar minimum shows that solar forcing of climate, although natural and significant, is overwhelmed by anthropogenic climate forcing.
In 2012, NASA scientists reported that to stop global warming atmospheric CO2 content would have to be reduced to 350 ppm or less, assuming all other climate forcings were fixed. The impact of anthropogenic aerosols has not been quantified, but individual aerosol types are thought to have substantial heating and cooling effects.[11]
See also
References
- 1 2 3 4 5 "The NASA Earth's Energy Budget Poster". NASA.
- ↑ IPCC AR5 WG1 Glossary 2013 "energy budget (of the earth)"
- 1 2 Graeme L. Stephens, Juilin Li, Martin Wild, Carol Anne Clayson, Norman Loeb, Seiji Kato, Tristan L'Ecuyer, Paul W. Stackhouse Jr, Matthew Lebsock and Timothy Andrews (September 23, 2012). "An update on Earth's energy balance in light of the latest global observations" (PDF). Nature Geoscience. Bibcode:2012NatGe...5..691S. doi:10.1038/NGEO1580.
- ↑ Lindsey, Rebecca (2009). "Climate and Earth's Energy Budget". NASA Earth Observatory.
- ↑ M, Previdi; et al. (2013). "Climate sensitivity in the Anthropocene". Royal Meteorological Society. Bibcode:2013QJRMS.139.1121P. doi:10.1002/qj.2165.
- 1 2 S M Reddy; S J Chary. University Botany II : (Gymnosperms, Plant Anatomy, Genetics, Ecology). New Age International. Retrieved 9 December 2015.
P D Sharma. Environmental Biology. Rastogi Publications. Retrieved 9 December 2015.
P D Sharma. Environmental Biology & Toxicology. Rastogi Publications. Retrieved 9 December 2015. - ↑ Wild, Martin; Folini, Doris; Schär, Christoph; Loeb, Norman; Dutton, Ellsworth; König-Langlo, Gert (2013). The Earth's radiation balance and its representation in CMIP5 models. Copernicus. Bibcode:2013EGUGA..15.1286W.
- ↑ Davies, J. H., & Davies, D. R. (2010). Earth's surface heat flux. Solid Earth, 1(1), 5–24.
- ↑ Archer, D. (2012). Global Warming: Understanding the Forecast. ISBN 978-0-470-94341-0.
- ↑ Connolley, William M. (18 May 2003). "William M. Connolley's page about Fourier 1827: MEMOIRE sur les temperatures du globe terrestre et des espaces planetaires". William M. Connolley. Retrieved 5 July 2010.
- 1 2 3 James Hansen; Makiko Sato; Pushker Kharecha; Karina von Schuckmann (January 2012). "Earth's Energy Imbalance". NASA.
- ↑ Stephens, Graeme L.; Li, Juilin; Wild, Martin; Clayson, Carol Anne; Loeb, Norman; Kato, Seiji; L'Ecuyer, Tristan; Jr, Paul W. Stackhouse; Lebsock, Matthew (2012-10-01). "An update on Earth's energy balance in light of the latest global observations". Nature Geoscience. 5 (10): 691–696. Bibcode:2012NatGe...5..691S. doi:10.1038/ngeo1580. ISSN 1752-0894.
- ↑ Effect of the Sun's Energy on the Ocean and Atmosphere (1997)
- ↑ B.A. Wielicki; et al. (1996). "Mission to Planet Earth: Role of Clouds and Radiation in Climate". Bull. Amer. Meteorol. Soc. 77 (5): 853–868. Bibcode:1996BAMS...77..853W. doi:10.1175/1520-0477(1996)077<0853:CATERE>2.0.CO;2.
- 1 2 3 Edited quote from public-domain source: Lindsey, R. (January 14, 2009), The Atmosphere's Energy Budget (page 6), in: Climate and Earth's Energy Budget: Feature Articles, Earth Observatory, part of the EOS Project Science Office, located at NASA Goddard Space Flight Center
- 1 2 "NASA: Climate Forcings and Global Warming". January 14, 2009.
External links
| Wikimedia Commons has media related to Earth's energy budget. |
- NASA: The Atmosphere's Energy Budget
- Clouds and Earth's Radiant Energy System (CERES)
- NASA/GEWEX Surface Radiation Budget (SRB) Project
Human/World population | |
|---|---|
| Major topics | |
| Biological and related topics | |
| Human impact on the environment | |
| Literature |
|
| Publications | |
| Lists | |
Events and organizations | |
| Related topics | |
| |