Global warming hiatus


A global warming hiatus,[4] also sometimes referred to as a global warming pause[5] or a global warming slowdown,[6] is a period of relatively little change in globally averaged surface temperatures.[7] In the current episode of global warming many such 15-year periods appear in the surface temperature record, along with robust evidence of the long-term warming trend;[4] climate is classically averaged over 30-year periods.[8]
Publicity has surrounded claims of a global warming hiatus during the period 1998–2013. The exceptionally warm El Niño year of 1998 was an outlier from the continuing temperature trend, and so subsequent annual temperatures gave the appearance of a hiatus: by January 2006, it appeared to some that global warming had stopped or paused.[5] A 2009 study showed that decades without warming were not exceptional,[9] and in 2011 a study showed that if allowances were made for known variability, the rising temperature trend continued unabated.[9] There was increased public interest in 2013 in the run-up to publication of the IPCC Fifth Assessment Report, and despite concerns that a 15-year period was too short to determine a meaningful trend, the IPCC included a section on a hiatus,[10] which it defined as a much smaller increasing linear trend over the 15 years from 1998 to 2012, than over the 60 years from 1951 to 2012.[1] Various studies examined possible causes of the short-term slowdown. Even though the overall climate system has continued to accumulate energy due to Earth's positive energy budget,[7][11] the available temperature readings at the Earth's surface indicate slower rates of increase in surface warming than in the prior decade. Since measurements at the top of the atmosphere show that Earth is receiving more energy than it is radiating back into space, the retained energy should be producing warming in the Earth's climate system.[7]
Research reported in July 2015 on an updated NOAA dataset[1][3] casts doubt on the existence of a hiatus, and it finds no indication of a slowdown even in earlier years.[12][13][14][15] Scientists working on other datasets welcomed this study, though they have expressed the view that the recent warming trend was less than in previous periods of the same length.[16][17] Subsequently, a detailed study supports the conclusion that warming is continuing, but it also find there was less warming between 2001 and 2010 than climate models had predicted, and that this slowdown might be attributed to short-term variations in the Pacific decadal oscillation (PDO), which was negative during that period.[18][19][20] Another review finds "no substantive evidence" of a pause in global warming.[21][22] A statistical study of global temperature data since 1970 concludes that the term 'hiatus' or 'pause' is not justified.[23]
Independent of these discussions about data and measurements for earlier years, 2015 turned out to be much warmer than any of the earlier years, already before El Niño conditions started. The warmth of 2015 largely ended any remaining scientific credibility of claims that the supposed "hiatus" since 1998 had any significance for the long-term warming trend.[24]
Evidence
Surface temperature changes: hiatus periods
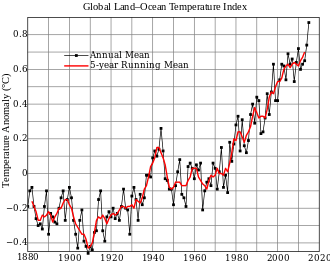
Climate is the statistics (usually, mean or variability) of weather: the classical period for averaging weather variables is 30 years in accordance with the definition set by the World Meteorological Organization.[8] Instrumental temperature records have shown a robust multi-decadal long-term trend of global warming since the end of the 19th century, reversing longer term cooling in previous centuries as seen in paleoclimate records. There has been considerable variability at shorter interannual to decadal periods, with hiatus periods showing less certain short-term trends. The 1998–2012 hiatus shows a rise of 0.05 [–0.05 to +0.15] °C per decade, compared with a longer term rise of 0.12 [0.08 to 0.14] °C per decade over the period from 1951 to 2012. The appearance of hiatus is sensitive to the start and end years chosen: a 15-year period starting in 1996 shows a rate of increase of 0.14 [0.03 to 0.24] °C per decade, but taking 15 years from 1997 the rate reduces to 0.07 [–0.02 to 0.18] °C per decade.[25]
Other aspects of the climate system
While hiatus periods have appeared in surface-air temperature records, other components of the climate system associated with warming have continued. Sea level rise has not stopped in recent years,[26] and Arctic sea ice decline has continued. There have been repeated records set for extreme surface temperatures.[27][28][29]
Development of perception of post-1998 hiatus
The warm El Niño year of 1998 was exceptional: the IPCC Third Assessment Report of 2001 highlighted that the "high global temperature associated with the 1997 to 1998 El Niño event stands out as an extreme event, even taking into account the recent rate of warming."[30] Opponents of action on global warming used this peak to misleadingly suggest that warming had stopped; a January 2006 opinion piece by Bob Carter in the Daily Telegraph announced an 8-year halt, but was soon rebutted.[5][31] The IPCC Fourth Assessment Report in 2007 reported that "2005 and 1998 were the warmest two years in the instrumental global surface-air temperature record since 1850. Surface temperatures in 1998 were enhanced by the major 1997–1998 El Niño but no such strong anomaly was present in 2005. Eleven of the last 12 years (1995 to 2006) – the exception being 1996 – rank among the 12 warmest years on record since 1850."[32] The IPCC report was disputed by an open letter in the National Post with 94 signatories, which said "there has been no net global warming since 1998. That the current temperature plateau follows a late 20th-century period of warming is consistent with the continuation today of natural multi-decadal or millennial climate cycling."[33]
There were further claims in blogs and media of lack of warming since 1998, and an Investor's Business Daily article in 2008 even claimed the planet was cooling. In April 2009 a NOAA study showed that similar short- term periods with no trend or even cooling had occurred previously in the years since 1901, and could even be found during the warming trend since 1975: it was easy to "cherry pick" the period 1998–2008 to support one view, but 1999–2008 showed a strong warming trend. They used computer simulations of future climate to show that it was "possible, and indeed likely, to have a period as long as a decade or two of 'cooling' or no warming superimposed on a longer-term warming trend."[9][34] In July 2009 Jeb Bush said that global warming might not be occurring as mean temperatures had been cooler over six years.[35] The decade to the end of 2010 was again the warmest on record, but David Rose in the Mail on Sunday argued that, excluding the 1998 "blip", global temperatures had been flat for 15 years.[36] A November 2011 study by statistician Grant Foster and Stefan Rahmstorf showed that after allowing for known short-term variability, there had been unabated warming since 1998 with no reduction from the rate over the preceding decade.[37][38][39] In January 2012 Rose claimed that the latest global temperatures showed 15 years without warming: the Met Office described this as "entirely misleading".[40]
In January 2013 James Hansen and colleagues published their updated analysis that temperatures had continued at a high level despite strong La Niña conditions, and said the "5-year mean global temperature has been flat for a decade, which we interpret as a combination of natural variability and a slowdown in the growth rate of the net climate forcing", noting "that the 10 warmest years in the record all occurred since 1998." Under the heading "Global Warming Standstill" they "noted that the 'standstill' temperature is at a much higher level than existed at any year in the prior decade except for the single year 1998, which had the strongest El Nino of the century. However, the standstill has led to a widespread assertion that 'global warming has stopped'."[41] The Economist led an article 30 March 2013 with the sentence "Over the past 15 years air temperatures at the Earth’s surface have been flat while greenhouse-gas emissions have continued to soar, quoting Hansen as saying that ""the five-year mean global temperature has been flat for a decade." It discussed possible explanations of "the recent hiatus in rising temperatures", and suggested that it implied lower climate sensitivity.[42] There was a surge in media interest setting a misleading narrative, as in the Reuters headline "Climate scientists struggle to explain warming slowdown".[5] At the Science Media Centre in London in July 2013, journalists met Met Office scientists and were given a briefing document with three papers on "the recent pause in global warming" in surface temperatures. These said other indicators continued to show warming, at least part of the pause related to heat being exchanged into deep oceans, and it did not alter the risks of future warming or invalidate the physics behind the models: it meant only a 10% reduction in the most probable projection, so "the warming that we might have expected by 2050 would be delayed by only a few years".[43][44]
In preparing the IPCC Fifth Assessment Report (AR5), representatives of the U.S. government and the European Union wanted details of the slowdown or "hiatus", Germany and Hungary were concerned that a 15-year period was too short to determine a meaningful trend, but the IPCC included discussion of the topic.[10] One of the lead authors, Dennis L. Hartmann, subsequently said; "Going into the IPCC this time, I would have said that, well, the trend over a 15-year record is not really very meaningful, because of the natural interannual variability of the climate system. But as the IPCC evolved, it became more and more of a public issue, so we felt we had to say something about it, even though from an observational perspective, it's not a very reliable measure of long-term warming." He said "the apparent reduction in the observed warming rate" was "interesting on purely scientific grounds, but it does not have a huge impact on the scientific assessment and does not alter the basic facts." Research cited in the report had to be published by 15 March, excluding work such as a paper by NCAR scientists including Kevin E. Trenberth indicating that increased heat was going into ocean depths.[5]
A month before formal AR5 publication, a leaked draft of the report noted that "Models do not generally reproduce the observed reduction in surface warming trend over the last 10–15 years", but lacked clear explanations, and attracted wide media coverage.[5] On 16 August Reuters said the "panel will try to explain why global temperatures, while still increasing, have risen more slowly since about 1998 even though greenhouse gas concentrations have hit repeated record highs in that time".[45] The BBC on 19 August reported IPCC warnings that the final text would vary, and said "The panel will also outline why global temperatures have been rising more slowly since 1998, a controversial slowdown that scientists have been struggling to explain." It said the possibility that climate sensitivity was lower than previous estimates had been argued by "many sceptics" as a key factor, and "a good reason not to believe the more extreme predictions of those they dismiss as warmist conspirators."[46] Coverage varied: on 22 August the National Geographic said the "draft IPCC report also dismisses a recent slowdown in global warming, attributing it to short-term factors."[47] On 26 September, the day before formal publication, CBC News quoted The Heritage Foundation under the headline "Climate change reports temperature hiatus fuels skeptics".[48]
In late night negotiations over wording, the IPCC added clarifications including "due to natural variability, trends based on short records are very sensitive to the beginning and end dates and do not in general reflect long-term climate trends", but at the press conference releasing the IPCC Summary for Policymakers on 27 September, journalists focussed questions on the "pause" rather than the overall conclusions. This focus resulted in headlines such as "Global Warming Slowdown Seen as Emissions Rise to Record" from Reuters. The National Post used the subheading "IPCC report skeptics seize on lull in global warming".[5][49] Even Nature headlined their news report "IPCC: Despite hiatus, climate change here to stay", though it said that "the 'hiatus' since the record hot year of 1998 — probably due to increased heat uptake by the oceans — is no sign that global warming has stopped, as some would like to hope", and quoted climatologist Thomas Stocker saying that "Comparing short-term observations with long-term model projections is inappropriate", and adding "We know that there is a lot of natural fluctuation in the climate system. A 15-year hiatus is not so unusual even though the jury is out as to what exactly may have caused the pause." He said that claims dismissing climate models would only be justified if "temperature were to remain constant for the next 20 years", and Brian Hoskins said other factors showed climate change.[50]
In a statement to the press in March 2016, Professor David Vaughan of the British Antarctic Survey said that recent increases in global temperature were not due to an unusually severe El Niño, but that the opposite is true. "This is a catch-up of a recent hiatus that has occurred in rising global temperatures. We are returning to normality: rising temperatures. This is an absolute warning of the dangers that lie ahead."[51]
Factors
Temperature dataset coverage and homogenization
The instrumental temperature record does not cover the entire globe: there are areas of incomplete or missing data, particularly in polar regions and parts of Africa.[25] The main temperature datasets take different approaches to allowing for this: HadCRUT does not extrapolate, and assumes that the global mean applies. When these regions have a different trend to the global average as at present, this causes a bias in the result which understates overall warming. The other datasets interpolate, producing differing trends. A 2014 study introduced a more sophisticated method of Kriging from the UAH satellite dataset, and found that this considerably reduced the hiatus.[52]
Homogenization is necessary for all climate data to correct for non-climatic changes, such as introduction of different measurement instruments, changes in location of the instruments, or differences in the time of day that measurements are taken.[3] The NOAA temperature dataset is regularly updated with refinements improving the allowance for known biases, including the effects of past changes in methods of collecting temperatures. In 2015 it changed from the Global Historical Climatology Network to the new International Surface Temperature Initiative databank which includes many more stations giving wider coverage of land surface temperatures, and the latest Extended Reconstructed Sea Surface Temperature dataset (version 4) which made improved allowances for biases, including the phased changeover from measuring ship water intake to using automatic buoys: the previous version made a simpler allowance for this. An article published in the American Association for the Advancement of Science (AAAS) Science journal in June 2015 by a team led by Thomas R. Karl, director of the NOAA datacenter, reported that these adjustments made very little difference to the temperature record, but the small change in recent years was sufficient to indicate that there had been no hiatus in the period from 1998 to 2014. They used the IPCC definition of the supposed hiatus as a slowdown in rate of temperature increase from 1998 to 2012, compared to the rate from 1951 to 2012, and again found no support for the idea of a "hiatus" or slowdown.[1][53]
Natural variability
Natural climate variability can appear to slow down surface warming over short periods, but does not refute long-term climate change trends.[54][55] Short-term hiatus periods of global warming are compatible with long-term climate change patterns.[56] The North Atlantic Oscillation (NAO) leads to multidecadal variability in Northern Hemispheric mean surface temperature by 15–20 years through a delayed effect on the North Atlantic Ocean, and can be a useful predictor of multidecadal periods of warming and cooling in both AMO and Northern Hemispheric mean surface temperature.[57]
Effects of oceans
One proposal is that the hiatus was a part of natural climate variability, specifically related to decadal cooling in the eastern equatorial Pacific in the La Niña phase of the El Niño–Southern Oscillation (ENSO).[54] This has been explained as due to unprecedented strengthening of Pacific trade winds in the last 20 years, so that surface warming has been substantially slowed by increased subsurface ocean heat uptake caused by increased subduction in the Pacific shallow overturning cells, and increased equatorial upwelling in the central and eastern Pacific.[18][55] A March 2014 study found that climate models assuming natural variability which matched subsequent observations of ENSO phasing had produced realistic estimates of 15-year trends.[58]
A study published on August 3, 2014 reported that the rapid warming of the Atlantic Ocean has increased trade winds, thereby cooling temperatures in the Pacific Ocean. This, the study concluded, contributed to the hiatus because such winds trap heat in the deep ocean.[59] Another study published later that month found evidence that a cycle of ocean currents in the Atlantic influences global temperatures by sinking large amounts of heat beneath the oceans, and suggested the hiatus might continue for ten more years because each phase of this cycle lasts for thirty years.[6][60] The 60- to 80-year cycle of the atmospheric and oceanic variability over the North Atlantic was also linked to the hiatus by two studies published in 2013[57][61] and was used to infer the length of the hiatus. A new "delayed oscillator theory" of the North Atlantic decadal-scale air-sea coupling was further proposed in 2015[62] to understand the underlying physical mechanisms of the 60-80-year-quasi-periodic natural climate multidecadal variability.
Two papers were published by scientists of the NASA Sea Level Change Team in October 2014 in the same issue of Nature Climate Change. According to an October 6, 2014 NASA press release related to the papers, "One of the most prominent ideas is that the bottom half of the ocean is taking up the slack, but supporting evidence is slim." In this press release, entitled, "NASA Study Finds Earth’s Ocean Abyss Has Not Warmed," NASA discussed research it had conducted that was "the first to test the idea using satellite observations, as well as direct temperature measurements of the upper ocean." NASA stated in this release, "The cold waters of Earth’s deep ocean have not warmed measurably since 2005, according to a new NASA study, leaving unsolved the mystery of why global warming appears to have slowed in recent years." With respect to the upper ocean, the release noted, "The temperature of the top half of the world's oceans – above the 1.24-mile mark – is still climbing, but not fast enough to account for the stalled air temperatures." NASA also emphasized in the same release, "Study coauthor Josh Willis of JPL said these findings do not throw suspicion on climate change itself. 'The sea level is still rising,' Willis noted. 'We're just trying to understand the nitty-gritty details.'".[63][64]
More specifically, one of these NASA studies was based on the fact that water expands as it gets warmer, and a straightforward subtraction calculation: From the total amount of sea level rise, they subtracted that due to the calculated expansion of the upper ocean down to 2,000 metres' (1.2 mi) depth based on data from Argo buoys, and that due to added meltwater worldwide. The remainder, representing the amount of sea level rise caused by warming in the deep ocean below that depth, was "essentially zero." Some recent studies reporting deep-ocean warming were referring to the upper half of the ocean, but below its topmost layer which goes down to about 700 metres' (0.43 mi) depth.[65] According to the other NASA study, the upper layers of the Southern Ocean warmed at a much greater rate between 1970 and 2005 than previously thought (24–58 percent more than earlier estimates), because before the deployment of Argo buoys, temperature measurements in the Southern Ocean were "spotty, at best."[65]
That the oceans warmed in the past significantly faster than we thought would imply that the effects of climate change could be worse than currently expected, placing the planet's sensitivity to CO2 toward the higher end of its possible range.[66]
A study published in December 2014 found that it is likely that a significant cause of the hiatus was increased heat uptake across the Atlantic Ocean, Southern Ocean, and Equatorial Pacific Ocean.[67][68]
A study published in February 2015 found that Atlantic Multidecadal Oscillation and the Pacific Decadal Oscillation substantially accounted for the hiatus, and predicted that these cycles would soon begin to exert the opposite effect on global temperatures.[69][70]
Volcanic activity
Several studies have proposed that the hiatus has been caused in part by increased sulfur emissions from volcanic activity.[71][72] A study published in November 2014 found that more sulfur dioxide had been emitted from small volcanoes than previously thought over the period 2000-2013.[73] The study's lead author, David Ridley, said this could help explain why climate models did not predict the hiatus.[74]
Other factors
Additional proposed causes of the decreased rate of warming over the past 15 years include the emission of pine-smelling vapors from pine forests, which have been shown to turn into aerosols,[75][76] and the ban on chlorofluorocarbons as a result of the Montreal Protocol, since they were potent greenhouse gases in addition to their ozone-depleting properties.[77][78] Spurious differences in observed warming rates may also arise from the mathematics of trend analysis itself, particularly when the study period is brief and regression assumptions are violated.[79]
Length of hiatus in relation to climate models
In a presentation to the American Physical Society, William (Bill) Collins of Lawrence Berkeley National Laboratory and lead author of the modeling Chapter 9 of the IPCC AR5 said "Now, I am hedging a bet because, to be honest with you, if the hiatus is still going on as of the sixth IPCC report, that report is going to have a large burden on its shoulders walking in the door, because recent literature has shown that the chances of having a hiatus of 20 years are vanishingly small."[80]
Two independent studies published in August 2014 concluded that, once surface temperatures start rising again, it is most likely that "they will keep going up without a break for the rest of the century, unless we cut greenhouse gas emissions."[81] Watanabe et al said, "this warming hiatus originated from eastern equatorial Pacific cooling associated with strengthening of trade winds," and that while decadal climate variability has a considerable effect on global mean surface temperatures, its influence is gradually decreasing compared to the ongoing man-made global warming.[82] Maher et al found that under the existing and projected high rates of greenhouse gas emissions there is little chance of another hiatus decade occurring after 2030, even if there were a large volcanic eruption after that time. They went on to say that most non-volcanic warming hiatuses are associated with enhanced cooling at the surface in the equatorial Pacific, which is linked to the Interdecadal Pacific Oscillation.[83]
Another study, published in September 2014, found that had present-day climate models been available in the mid-1990s, this hiatus could have been forecast at that time.[84][85]
Reports by scientific bodies
National Academy of Sciences-Royal Society Report
A joint report from the UK Royal Society and the US National Academy of Sciences in February 2014 said that there is no "pause" in climate change and that the temporary and short-term slowdown in the rate of increase in average global surface temperatures in the non-polar regions is likely to start accelerating again in the near future. "Globally averaged surface temperature has slowed down. I wouldn’t say it's paused. It depends on the datasets you look at. If you look at datasets that include the Arctic, it is clear that global temperatures are still increasing," said Tim Palmer, a co-author of the report and a professor at University of Oxford.[86]
World Meteorological Organisation climate report
When announcing the annual World Meteorological Organisation climate report in March 2014, the WMO secretary-general Michel Jarraud said that there had been no pause, with 2013 continuing a long-term warming trend showing "no standstill in global warming". 2013 had been the sixth-warmest year on record, and 13 of the 14 warmest years on record had occurred since the start of 2000.[87] He said that "The warming of our oceans has accelerated, and at lower depths. More than 90 percent of the excess energy trapped by greenhouse gases is stored in the oceans."[88]
The report itself stated that "While the rate at which surface-air temperatures are rising has slowed in recent years, heat continues to be trapped in the Earth system, mostly as increased ocean heat content. About 93 percent of the excess heat trapped in the Earth system between 1971 and 2010 was taken up by the ocean." From 2000 to 2013 the oceans had gained around three times as much heat as in the preceding 20 years, and while before 2000 most of the heat had been trapped between the sea surface and 700 metres' (0.43 mi) depth, from 2000 to 2013 most heat had been stored between 700 and 2,000 metres' (2,300 and 6,600 ft) depth. It proposed this could be due to changes in atmospheric and ocean circulation around the tropical Pacific Ocean, interacting with the El Niño–Southern Oscillation and the Pacific Decadal Oscillation.[89]
References
- 1 2 3 4 Karl, Thomas R.; Arguez, Anthony; Huang, Boyin; Lawrimore, Jay H.; McMahon, James R.; Menne, Matthew J.; Peterson, Thomas C.; Vose, Russell S.; Zhang, Huai-Min (26 June 2015). "Possible artifacts of data biases in the recent global surface warming hiatus". Science. 348 (6242). doi:10.1126/science.aaa5632.
- ↑ Gillis, Justin (4 June 2015). "Global Warming 'Hiatus' Challenged by NOAA Research". The New York Times. Retrieved 1 February 2016.
However, Russell S. Vose, chief of the climate science division at NOAA's Asheville center, pointed out in an interview that while the corrections do eliminate the recent warming slowdown, the overall effect of the agency's adjustments has long been to raise the reported global temperatures in the late 19th and early 20th centuries by a substantial margin. That makes the temperature increase of the past century appear less severe than it does in the raw data. 'If you just wanted to release to the American public our uncorrected data set, it would say that the world has warmed up about 2.071 degrees Fahrenheit since 1880,' Dr. Vose said. 'Our corrected data set says things have warmed up about 1.65 degrees Fahrenheit. Our corrections lower the rate of warming on a global scale.'
- 1 2 3 Johnson, Scott K. (24 January 2016). "Thorough, not thoroughly fabricated: The truth about global temperature data". Ars Technica UK. Retrieved 29 January 2016.
- 1 2 "Despite the robust multi-decadal warming, there exists substantial interannual to decadal variability in the rate of warming, with several periods exhibiting weaker trends (including the warming hiatus since 1998) ... Fifteen-year-long hiatus periods are common in both the observed and CMIP5 historical GMST time series", "Box TS.3: Climate Models and the Hiatus in Global Mean Surface Warming of the Past 15 Years", IPCC, Climate Change 2013: Technical Summary, p. 37 and pp. 61–63.
- 1 2 3 4 5 6 7 Mooney, Chris (7 October 2013). "Who Created the Global Warming "Pause"?". Mother Jones. Retrieved 26 February 2014.
- 1 2 McGrath, Matt (21 August 2014). "Global warming slowdown 'could last another decade'". BBC News. Retrieved 23 August 2014.
- 1 2 3 Meehl,, Gerald A.; Julie M. Arblaster; John T. Fasullo; Aixue Hu; Kevin E. Trenberth (2011). "Model-based evidence of deep-ocean heat uptake during surface-temperature hiatus periods" (PDF). Nature Climate Change. 1: 360–364. doi:10.1038/nclimate1229.
- 1 2 Planton, Serge (France; editor) (2013). "Annex III. Glossary: IPCC - Intergovernmental Panel on Climate Change" (PDF). IPCC Fifth Assessment Report. p. 1450. Retrieved 25 July 2016.
- 1 2 3 "The ups and downs of global warming". Climate Change: Vital Signs of the Planet. NASA. 21 September 2009. Retrieved 22 June 2015.
- 1 2 Morales, Alex (27 September 2013). "Global Warming Slowdown Seen as Emissions Rise to Record". Bloomberg.com. Retrieved 19 June 2015.
WGI AR5 Final Draft SPM Comments - ↑ Kollipara, Puneet (11 November 2014). "Where is Global Warming's Missing Heat?". AAAS. Retrieved 17 November 2014.
- ↑ "The Recent Global Surface Warming Hiatus". NOAA. 4 June 2015. Retrieved 14 March 2016.
- ↑ "Scientists Cast Doubt On An Apparent 'Hiatus' In Global Warming". National Public Radio. 2015-06-04. Retrieved June 13, 2015.
- ↑ "Global warming 'pause' didn't happen, study finds". The Guardian. 2015-06-04. Retrieved June 13, 2015.
- ↑ Wendel, JoAnna (2015). "Global warming "hiatus" never happened, study says". Eos. 96. doi:10.1029/2015EO031147.
- ↑ Vaidyanathan, Gayathri. "Did Global Warming Slow Down in the 2000s, or Not?", Scientific American (February 25, 2016): "Climate models, which are virtual representations of our planet, project that temperatures were much higher in the early 2000s than was the case in reality. ... Fyfe and his colleagues think the Pacific Decadal Oscillation (PDO), a natural variance in the climate system that switches between positive, neutral and negative phases, explains the recent slowdown."
- ↑ "US scientists: Global warming pause 'no longer valid'". BBC News. 2015-06-04. Retrieved June 13, 2015.
- 1 2 Dai, Aiguo; Fyfe, John C.; Xie, Shang-Ping; Dai, Xingang (2015). "Decadal modulation of global surface temperature by internal climate variability". Nature Climate Change. 5 (6). doi:10.1038/nclimate2605.
- ↑ Fyfe, John C.; Meehl, Gerald A.; England, Matthew H.; Mann, Michael E.; Santer, Benjamin D.; Flato, Gregory M.; Hawkins, Ed; Gillett, Nathan P.; Xie, Shang-Ping; Kosaka, Yu; Swart, Neil C. (2016). "Making sense of the early-2000s warming slowdown" (PDF). Nature Climate Change. 6: 224–228. doi:10.1038/nclimate2938.
- ↑ Trenberth, Kevin E. (2015). "Has there been a hiatus? Internal climate variability masks climate-warming trends" (PDF). Science. 349 (6249). pp. 691–692. doi:10.1126/science.aac9225.
- ↑ "No substantive evidence for 'pause' in global warming". Bristol University. 24 November 2015. Retrieved 26 November 2015.
On the definition and identifiability of the alleged “hiatus” in global warming : Scientific Reports, Lewandowsky, Risbey & Oreskes (2015) doi:10.1038/srep16784 - ↑ "New study finds 'no substantive evidence' of a global warming 'pause'". The Washington Post. 24 November 2015. Retrieved 26 November 2015.
- ↑ Cahill, Niamh; Rahmstorf, Stefan; Parnell, Andrew C (1 August 2015). "Change points of global temperature". Environmental Research Letters. 10 (8): 084002. doi:10.1088/1748-9326/10/8/084002.
- ↑ Hansen, James; Sato, Makiko; Ruedy, Reto; Schmidt, Gavin A.; Lob, Ken (19 January 2016). "Global Temperature in 2015" (PDF). Retrieved 28 February 2016.
- 1 2 IPCC, Climate Change 2013: Technical Summary, pp. 37–39.
- ↑ Ogburn, Stephanie Paige (1 November 2013). "Has Global Warming Paused?". Scientific American. Retrieved 20 February 2014.
- ↑ Seneviratne, S. I.; Donat, M. G.; Mueller, B.; Alexander, L. V. (2014). "No pause in the increase of hot temperature extremes". Nature Climate Change. 4 (3): 161. doi:10.1038/nclimate2145.
- ↑ Sillmann, Jana; Donat, Markus G; Fyfe, John C; Zwiers, Francis W (1 May 2014). "Observed and simulated temperature extremes during the recent warming hiatus". Environmental Research Letters. 9 (6): 064023. doi:10.1088/1748-9326/9/6/064023.
- ↑ Chung, Emily (26 February 2014). "No global warming 'hiatus' for extreme heat days". CBC News. Retrieved 26 February 2014.
- ↑ "IPCC Third Assessment Report - Climate Change 2001". GRID-Arendal. Retrieved 19 Jun 2015.
- ↑ Carter, Bob (9 April 2006). "There IS a problem with global warming... it stopped in 1998". Telegraph.co.uk. London. Retrieved 19 June 2015.
- ↑ "TS.3.1.1 Global Average Temperatures - AR4 WGI Technical Summary". IPCC. 2007. Retrieved 19 Jun 2015.
- ↑ "Don't fight, adapt". National Post. 13 December 2007. Retrieved 9 Nov 2015.
- ↑ Easterling, David R.; Wehner, Michael F. (2009). "Is the climate warming or cooling?". Geophysical Research Letters. Wiley-Blackwell. 36 (8). doi:10.1029/2009gl037810. Retrieved 22 June 2015. pdf
- ↑ Carlson, Tucker (8 July 2009). "Jeb Bush on Obama". Esquire. Retrieved 5 July 2015.
[global warming] "may be only partially man-made. It may not be warming by the way. The last six years we've actually had mean temperatures that are cooler."
- ↑ Monbiot, George (8 December 2010). "David Rose's climate science writing shows he has not learned from previous mistakes". the Guardian. Retrieved 19 June 2015.
- ↑ Freedman, Andrew (11 December 2011). "New climate study reveals "true global warming signal"; warming continues unabated". The Washington Post. Retrieved 22 June 2015.
- ↑ Foster, Grant; Rahmstorf, Stefan (2011). "Global temperature evolution 1979". Environ. Res. Lett. IOP. 6 (4): 044022. doi:10.1088/1748-9326/6/4/044022.
- ↑ "Rate of global warming 'remarkably steady' since 1979". environmentalresearchweb. IOP Publishing. 6 December 2011. Retrieved 22 June 2015.
- ↑ "Met Office in the Media: 29 January 2012". Met Office News Blog. 29 January 2012. Retrieved 19 June 2015.
- ↑ Global Temperature Update Through 2012 by J. Hansen, M. Sato, R. Ruedy (January 15, 2013)
- ↑ "A sensitive matter". The Economist. 30 March 2013. Retrieved 19 June 2015.
- ↑ UK Met Office (July 2013). "The recent pause in warming".
- ↑ David Shukman, BBC (22 July 2013). "Why has global warming stalled?". BBC News.
- ↑ Doyle, Alister (16 August 2013). "Experts surer of manmade global warming but local predictions elusive". Reuters. Retrieved 19 June 2015.
- ↑ McGrath, Matt (19 August 2013). "Climate leaks are 'misleading' says IPCC ahead of major report". BBC News. Retrieved 19 June 2015.
- ↑ Howard, Brian Clark; Geographic, National (22 August 2013). "Leaked Report Spotlights Big Climate Change Assessment". National Geographic News. Retrieved 19 June 2015.
- ↑ "Climate change report's 'temperature hiatus' fuels skeptics". CBC News. 26 September 2013. Retrieved 19 June 2015.
- ↑ Morales, Alex (27 September 2013). "Global warming has slowed in last 15 years despite record greenhouse gas levels, scientists say". National Post. Retrieved 19 June 2015.(story from Blomberg News)
- ↑ "IPCC: Despite hiatus, climate change here to stay". Nature News. 27 September 2013. doi:10.1038/nature.2013.13832. Retrieved 19 June 2015.
- ↑ "February was the warmest month in recorded history, climate experts say". The Guardian. 20 March 2016.
- ↑ Cowtan, K.; Way, R. G. (2014). "Coverage bias in the HadCRUT4 temperature series and its impact on recent temperature trends". Quarterly Journal of the Royal Meteorological Society: n/a. doi:10.1002/qj.2297.
- ↑ Johnson, Scott K. (4 June 2015). "Updated NOAA temperature record shows little global warming slowdown". Ars Technica UK. Retrieved 3 July 2015.
- 1 2 Kosaka Y, Xie SP (September 2013). "Recent global-warming hiatus tied to equatorial Pacific surface cooling". Nature. 501 (7467): 403–7. doi:10.1038/nature12534. PMID 23995690.
Various mechanisms have been proposed for this hiatus in global warming, but their relative importance has not been quantified, hampering observational estimates of climate sensitivity. Here we show that accounting for recent cooling in the eastern equatorial Pacific reconciles climate simulations and observations. ... Although similar decadal hiatus events may occur in the future, the multi-decadal warming trend is very likely to continue with greenhouse gas increase.
- 1 2 England, Matthew (February 2014). "Recent intensification of wind-driven circulation in the Pacific and the ongoing warming hiatus". Nature Climate Change. doi:10.1038/nclimate2106.
- ↑ Jenkins, Amber (21 September 2009). "The ups and downs of global warming". NASA. Retrieved 20 February 2014.
- 1 2 Li JP, Sun C, Jin FF (October 2013). "NAO implicated as a predictor of Northern Hemisphere mean temperature multidecadal variability". Geophys. Res. Lett. 40: 5497–5502. doi:10.1002/2013GL057877.
- ↑ Risbey, James S.; Lewandowsky, Stephan; Langlais, Clothilde; Monselesan, Didier P.; O'Kane, Terence J.; Oreskes, Naomi (2014). "Well-estimated global surface warming in climate projections selected for ENSO". Nature Climate change. Nature Publishing Group. 4 (9): 835–840. doi:10.1038/nclimate2310. Retrieved 5 March 2015.
- ↑ McGregor, Shayne; Timmermann, Axel; Stuecker, Malte F.; England, Matthew H.; Merrifield, Mark; Jin, Fei-Fei; Chikamoto, Yoshimitsu (3 August 2014). "Recent Walker circulation strengthening and Pacific cooling amplified by Atlantic warming". Nature Climate Change. doi:10.1038/nclimate2330.
- ↑ Chen, X.; Tung, K.-K. (21 August 2014). "Varying planetary heat sink led to global-warming slowdown and acceleration". Science. 345 (6199): 897–903. doi:10.1126/science.1254937.
- ↑ Tung, K-K, Zhou J (2013). "Using data to attribute episodes of warming and cooling in instrumental records". PNAS. 110: 2058–2063. doi:10.1073/pnas.1212471110.
- ↑ Sun C, Li JP, Jin FF (2015). "A delayed oscillator model for the quasi-periodic multidecadal variability of the NAO". Clim. Dyn. doi:10.1007/s00382-014-2459-z.
- ↑ "Study Finds Earth's Ocean Abyss Has Not Warmed - NASA Science". nasa.gov.
- ↑ Vaidyanathan, Gayathri (7 October 2014). "RESEARCH: Conflicting ocean studies renew a scientific argument over a warming 'pause'". E&E Publishing. Retrieved 11 October 2014.
- 1 2 NASA release 14-272 October 6, 2014. "NASA Study Finds Earth's Ocean Abyss Has Not Warmed".
- ↑ Abrams, Lindsay (8 October 2014). "The global warming scandal that wasn't: Conservative media's latest claim is full of hot air". Salon. Retrieved 11 October 2014.
- ↑ Drijfhout, S. S.; Blaker, A. T.; Josey, S. A.; Nurser, A. J. G.; Sinha, B.; Balmaseda, M. A. (November 2014). "Surface warming hiatus caused by increased heat uptake across multiple ocean basins". Geophysical Research Letters: n/a–n/a. doi:10.1002/2014GL061456.
- ↑ IANS (4 December 2014). "Oceans play key role in global 'warming hiatus'". Times of India. Retrieved 6 December 2014.
- ↑ Steinman, B. A.; Mann, M. E.; Miller, S. K. (26 February 2015). "Atlantic and Pacific multidecadal oscillations and Northern Hemisphere temperatures". Science. 347 (6225): 988–991. doi:10.1126/science.1257856.
- ↑ Vaughan, Adam (26 February 2015). "Global warming slowdown probably due to natural cycles, study finds". The Guardian. Retrieved 27 February 2015.
- ↑ Santer, B. D.; Bonfils, C. L.; Painter, J. F.; Zelinka, M. D.; Mears, C.; Solomon, S.; Schmidt, G. A.; Fyfe, J. C.; Cole, J. N. S.; Nazarenko, L.; Taylor, K. E.; Wentz, F. J. (2014). "Volcanic contribution to decadal changes in tropospheric temperature". Nature Geoscience. doi:10.1038/ngeo2098.
- ↑ Doyle, Alister (23 February 2014). "Sun-dimming volcanoes partly explain global warming hiatus-study". Reuters. Retrieved 23 February 2014.
- ↑ Ridley, D. A.; Solomon, S.; Barnes, J. E.; Burlakov, V. D.; Deshler, T.; Dolgii, S. I.; Herber, A. B.; Nagai, T.; Neely, R. R.; Nevzorov, A. V.; Ritter, C.; Sakai, T.; Santer, B. D.; Sato, M.; Schmidt, A.; Uchino, O.; Vernier, J. P. (November 2014). "Total volcanic stratospheric aerosol optical depths and implications for global climate change". Geophysical Research Letters: n/a–n/a. doi:10.1002/2014GL061541.
- ↑ Casey, Michael (19 November 2014). "Could volcanoes help slow global warming?". CBS News. Retrieved 3 December 2014.
- ↑ Ehn, Mikael; Thornton, Joel A.; Kleist, Einhard; Sipilä, Mikko; Junninen, Heikki; Pullinen, Iida; Springer, Monika; Rubach, Florian; Tillmann, Ralf; Lee, Ben; Lopez-Hilfiker, Felipe; Andres, Stefanie; Acir, Ismail-Hakki; Rissanen, Matti; Jokinen, Tuija; Schobesberger, Siegfried; Kangasluoma, Juha; Kontkanen, Jenni; Nieminen, Tuomo; Kurtén, Theo; Nielsen, Lasse B.; Jørgensen, Solvejg; Kjaergaard, Henrik G.; Canagaratna, Manjula; Maso, Miikka Dal; Berndt, Torsten; Petäjä, Tuukka; Wahner, Andreas; Kerminen, Veli-Matti; Kulmala, Markku; Worsnop, Douglas R.; Wildt, Jürgen; Mentel, Thomas F. (26 February 2014). "A large source of low-volatility secondary organic aerosol". Nature. 506 (7489): 476–479. doi:10.1038/nature13032.
- ↑ McGrath, Matt (26 February 2014). "Smell of forest pine can limit climate change - researchers". BBC News. Retrieved 28 March 2014.
- ↑ Estrada, F.; Perron, P.; Martínez-López, B. N. (2013). "Statistically derived contributions of diverse human influences to twentieth-century temperature changes". Nature Geoscience. 6 (12): 1050. doi:10.1038/ngeo1999.
- ↑ McGrath, Matt (10 November 2013). "Ozone chemicals ban linked to global warming 'pause'". BBC. Retrieved 24 February 2014.
- ↑ "Science Magazine: Sign In". sciencemag.org.
- ↑ Collins, William. "American Physical Society Climate Change Statement Review Workshop" (PDF). American Physical Society. p. 92. Retrieved 3 March 2014.
- ↑ Slezak, Michael (3 September 2014). "No more pause: Warming will be non-stop from now on". New Scientist (2985). Reed Business Information. Retrieved 14 September 2014.
- ↑ Watanabe, Masahiro; Shiogama, Hideo; Tatebe, Hiroaki; Hayashi, Michiya; Ishii, Masayoshi; Kimoto, Masahide (31 August 2014). "Contribution of natural decadal variability to global warming acceleration and hiatus". Nature Climate Change. doi:10.1038/nclimate2355. Retrieved 14 September 2014.
- ↑ Maher, Nicola; Gupta, Alexander Sen; England, Matthew H. (20 August 2014). "Drivers of decadal hiatus periods in the 20th and 21st centuries". Geophysical Research Letters. doi:10.1002/2014GL060527. Retrieved 14 September 2014.
- ↑ Meehl, Gerald A.; Teng, Haiyan; Arblaster, Julie M. (7 September 2014). "Climate model simulations of the observed early-2000s hiatus of global warming". Nature Climate Change. 4 (10): 898–902. doi:10.1038/nclimate2357.
- ↑ Davey, Melissa (9 September 2014). "Research shows surprise global warming 'hiatus' could have been forecast". The Guardian. Retrieved 20 October 2014.
- ↑ Connor, Steve (27 February 2014). "Now the two most famous scientific institutions in Britain and the US agree: 'Climate change is more certain than ever'". The Independent. London. Retrieved 27 February 2014.
- ↑ Vaughan, Adam (24 March 2014). "13 of 14 warmest years on record occurred in 21st century – UN : Environment". The Guardian. Retrieved 28 March 2014.
- ↑ Evans, Robert (24 March 2014). "Global warming not stopped, will go on for centuries: WMO". Reuters. Retrieved 28 March 2014.
- ↑ "E-Library: WMO Statement on the status of the global climate in 2013". World Meteorological Organisation. 24 March 2014. Retrieved 28 March 2014.