Climate change
 |
|
Atmospheric physics |
| Meteorology |
|---|
|
Weather (category) · (portal) |
| Climatology |
|
Climate (category) |
Climate change is a change in the statistical distribution of weather patterns when that change lasts for an extended period of time (i.e., decades to millions of years). Climate change may refer to a change in average weather conditions, or in the time variation of weather around longer-term average conditions (i.e., more or fewer extreme weather events). Climate change is caused by factors such as biotic processes, variations in solar radiation received by Earth, plate tectonics, and volcanic eruptions. Certain human activities have also been identified as significant causes of recent climate change, often referred to as global warming.[1]
Scientists actively work to understand past and future climate by using observations and theoretical models. A climate record—extending deep into the Earth's past—has been assembled, and continues to be built up, based on geological evidence from borehole temperature profiles, cores removed from deep accumulations of ice, floral and faunal records, glacial and periglacial processes, stable-isotope and other analyses of sediment layers, and records of past sea levels. More recent data are provided by the instrumental record. General circulation models, based on the physical sciences, are often used in theoretical approaches to match past climate data, make future projections, and link causes and effects in climate change.
Terminology
The most general definition of climate change is a change in the statistical properties (principally its mean and spread)[2] of the climate system when considered over long periods of time, regardless of cause.[3] Accordingly, fluctuations over periods shorter than a few decades, such as El Niño, do not represent climate change.
The term sometimes is used to refer specifically to climate change caused by human activity, as opposed to changes in climate that may have resulted as part of Earth's natural processes.[4] In this sense, especially in the context of environmental policy, the term climate change has become synonymous with anthropogenic global warming. Within scientific journals, global warming refers to surface temperature increases while climate change includes global warming and everything else that increasing greenhouse gas levels affect.[5]
Climatic change versus climate change
In 1966, the World Meteorological Organization (WMO) proposed the term climatic change to encompass all forms of climatic variability on time-scales longer than 10 years, whether the cause was natural or anthropogenic. Change was a given and climatic was used as an adjective to describe this kind of change (as opposed to political or economic change). When it was realized that human activities had a potential to drastically alter the climate, the term climate change replaced climatic change as the dominant term to reflect an anthropogenic cause. Climate change was incorporated in the title of the Intergovernmental Panel on Climate Change (IPCC) and the UN Framework Convention on Climate Change (UNFCCC). Climate change, used as a noun, became an issue rather than the technical description of changing weather.[6]
Causes
On the broadest scale, the rate at which energy is received from the Sun and the rate at which it is lost to space determine the equilibrium temperature and climate of Earth. This energy is distributed around the globe by winds, ocean currents, and other mechanisms to affect the climates of different regions.
Factors that can shape climate are called climate forcings or "forcing mechanisms".[7] These include processes such as variations in solar radiation, variations in the Earth's orbit, variations in the albedo or reflectivity of the continents and oceans, mountain-building and continental drift and changes in greenhouse gas concentrations. There are a variety of climate change feedbacks that can either amplify or diminish the initial forcing. Some parts of the climate system, such as the oceans and ice caps, respond more slowly in reaction to climate forcings, while others respond more quickly. There are also key threshold factors which when exceeded can produce rapid change.
Forcing mechanisms can be either "internal" or "external". Internal forcing mechanisms are natural processes within the climate system itself (e.g., the thermohaline circulation). External forcing mechanisms can be either natural (e.g., changes in solar output) or anthropogenic (e.g., increased emissions of greenhouse gases).
Whether the initial forcing mechanism is internal or external, the response of the climate system might be fast (e.g., a sudden cooling due to airborne volcanic ash reflecting sunlight), slow (e.g. thermal expansion of warming ocean water), or a combination (e.g., sudden loss of albedo in the arctic ocean as sea ice melts, followed by more gradual thermal expansion of the water). Therefore, the climate system can respond abruptly, but the full response to forcing mechanisms might not be fully developed for centuries or even longer.
Internal forcing mechanisms
Scientists generally define the five components of earth's climate system to include atmosphere, hydrosphere, cryosphere, lithosphere (restricted to the surface soils, rocks, and sediments), and biosphere.[8] Natural changes in the climate system ("internal forcings") result in internal "climate variability".[9] Examples include the type and distribution of species, and changes in ocean-atmosphere circulations.
Ocean-atmosphere variability
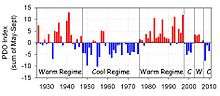
The ocean and atmosphere can work together to spontaneously generate internal climate variability that can persist for years to decades at a time.[10][11] Examples of this type of variability include the El Niño-Southern Oscillation, the Pacific decadal oscillation, and the Atlantic Multidecadal Oscillation. These variations can affect global average surface temperature by redistributing heat between the deep ocean and the atmopshere[12][13] and/or by altering the cloud/water vapor/sea ice distribution which can affect the total energy budget of the earth.[14][15]
The oceanic aspects of these circulations can generate variability on centennial timescales due to the ocean having hundreds of times more mass than in the atmosphere, and thus very high thermal inertia. For example, alterations to ocean processes such as thermohaline circulation play a key role in redistributing heat in the world's oceans. Due to the long timescales of this circulation, ocean temperature at depth is still adjusting to effects of the Little Ice Age[16] which occurred between the 1600 and 1800s.

Life
Life affects climate through its role in the carbon and water cycles and through such mechanisms as albedo, evapotranspiration, cloud formation, and weathering.[17][18][19] Examples of how life may have affected past climate include:
- glaciation 2.3 billion years ago triggered by the evolution of oxygenic photosynthesis, which depleted the atmosphere of the greenhouse gas carbon dioxide and introduced free oxygen.[20][21]
- another glaciation 300 million years ago ushered in by long-term burial of decomposition-resistant detritus of vascular land-plants (creating a carbon sink and forming coal)[22][23]
- termination of the Paleocene-Eocene Thermal Maximum 55 million years ago by flourishing marine phytoplankton[24][25]
- reversal of global warming 49 million years ago by 800,000 years of arctic azolla blooms[26][27]
- global cooling over the past 40 million years driven by the expansion of grass-grazer ecosystems[28][29]
External forcing mechanisms


Orbital variations
Slight variations in Earth's orbit lead to changes in the seasonal distribution of sunlight reaching the Earth's surface and how it is distributed across the globe. There is very little change to the area-averaged annually averaged sunshine; but there can be strong changes in the geographical and seasonal distribution. The three types of orbital variations are variations in Earth's eccentricity, changes in the tilt angle of Earth's axis of rotation, and precession of Earth's axis. Combined together, these produce Milankovitch cycles which have a large impact on climate and are notable for their correlation to glacial and interglacial periods,[30] their correlation with the advance and retreat of the Sahara,[30] and for their appearance in the stratigraphic record.[31][32]
The IPCC notes that Milankovitch cycles drove the ice age cycles, CO2 followed temperature change "with a lag of some hundreds of years," and that as a feedback amplified temperature change.[33] The depths of the ocean have a lag time in changing temperature (thermal inertia on such scale). Upon seawater temperature change, the solubility of CO2 in the oceans changed, as well as other factors impacting air-sea CO2 exchange.[34]
Solar output

The Sun is the predominant source of energy input to the Earth. Other sources include geothermal energy from the Earth's core, and heat from the decay of radioactive compounds. Both long- and short-term variations in solar intensity are known to affect global climate.
Three to four billion years ago, the Sun emitted only 70% as much power as it does today. If the atmospheric composition had been the same as today, liquid water should not have existed on Earth. However, there is evidence for the presence of water on the early Earth, in the Hadean[35][36] and Archean[37][35] eons, leading to what is known as the faint young Sun paradox.[38] Hypothesized solutions to this paradox include a vastly different atmosphere, with much higher concentrations of greenhouse gases than currently exist.[39] Over the following approximately 4 billion years, the energy output of the Sun increased and atmospheric composition changed. The Great Oxygenation Event – oxygenation of the atmosphere around 2.4 billion years ago – was the most notable alteration. Over the next five billion years, the Sun's ultimate death as it becomes a red giant and then a white dwarf will have large effects on climate, with the red giant phase possibly ending any life on Earth that survives until that time.
Solar output also varies on shorter time scales, including the 11-year solar cycle[40] and longer-term modulations.[41] Solar intensity variations possibly as a result of the Wolf, Spörer and Maunder Minimum are considered to have been influential in triggering the Little Ice Age,[42] and some of the warming observed from 1900 to 1950. The cyclical nature of the Sun's energy output is not yet fully understood; it differs from the very slow change that is happening within the Sun as it ages and evolves. Research indicates that solar variability has had effects including the Maunder minimum from 1645 to 1715 A.D., part of the Little Ice Age from 1550 to 1850 A.D. that was marked by relative cooling and greater glacier extent than the centuries before and afterward.[43][44] Some studies point toward solar radiation increases from cyclical sunspot activity affecting global warming, and climate may be influenced by the sum of all effects (solar variation, anthropogenic radiative forcings, etc.).[45][46]
Interestingly, a 2010 study[47] suggests, “that the effects of solar variability on temperature throughout the atmosphere may be contrary to current expectations.”
In an Aug 2011 Press Release,[48] CERN announced the publication in the Nature journal the initial results from its CLOUD experiment. The results indicate that ionisation from cosmic rays significantly enhances aerosol formation in the presence of sulfuric acid and water, but in the lower atmosphere where ammonia is also required, this is insufficient to account for aerosol formation and additional trace vapours must be involved. The next step is to find more about these trace vapours, including whether they are of natural or human origin.
Volcanism

The eruptions considered to be large enough to affect the Earth's climate on a scale of more than 1 year are the ones that inject over 100,000 tons of SO2 into the stratosphere.[49] This is due to the optical properties of SO2 and sulfate aerosols, which strongly absorb or scatter solar radiation, creating a global layer of sulfuric acid haze.[50] On average, such eruptions occur several times per century, and cause cooling (by partially blocking the transmission of solar radiation to the Earth's surface) for a period of a few years.
The eruption of Mount Pinatubo in 1991, the second largest terrestrial eruption of the 20th century, affected the climate substantially, subsequently global temperatures decreased by about 0.5 °C (0.9 °F) for up to three years.[51][52] Thus, the cooling over large parts of the Earth reduced surface temperatures in 1991-93, the equivalent to a reduction in net radiation of 4 watts per square meter.[53] The Mount Tambora eruption in 1815 caused the Year Without a Summer.[54] Much larger eruptions, known as large igneous provinces, occur only a few times every fifty - hundred million years - through flood basalt, and caused in Earth past global warming and mass extinctions.[55]
Small eruptions, with injections of less than 0.1 Mt of sulfur dioxide into the stratosphere, impact the atmosphere only subtly, as temperature changes are comparable with natural variability. However, because smaller eruptions occur at a much higher frequency, they too have a significant impact on Earth's atmosphere.[49][56]
Seismic monitoring maps current and future trends in volcanic activities, and tries to develop early warning systems. In climate modelling the aim is to study the physical mechanisms and feedbacks of volcanic forcing.[57]
Volcanoes are also part of the extended carbon cycle. Over very long (geological) time periods, they release carbon dioxide from the Earth's crust and mantle, counteracting the uptake by sedimentary rocks and other geological carbon dioxide sinks. The US Geological Survey estimates are that volcanic emissions are at a much lower level than the effects of current human activities, which generate 100–300 times the amount of carbon dioxide emitted by volcanoes.[58] A review of published studies indicates that annual volcanic emissions of carbon dioxide, including amounts released from mid-ocean ridges, volcanic arcs, and hot spot volcanoes, are only the equivalent of 3 to 5 days of human caused output. The annual amount put out by human activities may be greater than the amount released by supererruptions, the most recent of which was the Toba eruption in Indonesia 74,000 years ago.[59]
Although volcanoes are technically part of the lithosphere, which itself is part of the climate system, the IPCC explicitly defines volcanism as an external forcing agent.[60]
Plate tectonics
Over the course of millions of years, the motion of tectonic plates reconfigures global land and ocean areas and generates topography. This can affect both global and local patterns of climate and atmosphere-ocean circulation.[61]
The position of the continents determines the geometry of the oceans and therefore influences patterns of ocean circulation. The locations of the seas are important in controlling the transfer of heat and moisture across the globe, and therefore, in determining global climate. A recent example of tectonic control on ocean circulation is the formation of the Isthmus of Panama about 5 million years ago, which shut off direct mixing between the Atlantic and Pacific Oceans. This strongly affected the ocean dynamics of what is now the Gulf Stream and may have led to Northern Hemisphere ice cover.[62][63] During the Carboniferous period, about 300 to 360 million years ago, plate tectonics may have triggered large-scale storage of carbon and increased glaciation.[64] Geologic evidence points to a "megamonsoonal" circulation pattern during the time of the supercontinent Pangaea, and climate modeling suggests that the existence of the supercontinent was conducive to the establishment of monsoons.[65]
The size of continents is also important. Because of the stabilizing effect of the oceans on temperature, yearly temperature variations are generally lower in coastal areas than they are inland. A larger supercontinent will therefore have more area in which climate is strongly seasonal than will several smaller continents or islands.
Human influences
In the context of climate variation, anthropogenic factors are human activities which affect the climate. The scientific consensus on climate change is "that climate is changing and that these changes are in large part caused by human activities,"[66] and it "is largely irreversible."[67]
“Science has made enormous inroads in understanding climate change and its causes, and is beginning to help develop a strong understanding of current and potential impacts that will affect people today and in coming decades. This understanding is crucial because it allows decision makers to place climate change in the context of other large challenges facing the nation and the world. There are still some uncertainties, and there always will be in understanding a complex system like Earth’s climate. Nevertheless, there is a strong, credible body of evidence, based on multiple lines of research, documenting that climate is changing and that these changes are in large part caused by human activities. While much remains to be learned, the core phenomenon, scientific questions, and hypotheses have been examined thoroughly and have stood firm in the face of serious scientific debate and careful evaluation of alternative explanations.”— United States National Research Council, Advancing the Science of Climate Change
Of most concern in these anthropogenic factors is the increase in CO2 levels due to emissions from fossil fuel combustion, followed by aerosols (particulate matter in the atmosphere) and the CO2 released by cement manufacture. Other factors, including land use, ozone depletion, animal agriculture[68] and deforestation, are also of concern in the roles they play – both separately and in conjunction with other factors – in affecting climate, microclimate, and measures of climate variables.[69]
Physical evidence


Evidence for climatic change is taken from a variety of sources that can be used to reconstruct past climates. Reasonably complete global records of surface temperature are available beginning from the mid-late 19th century. For earlier periods, most of the evidence is indirect—climatic changes are inferred from changes in proxies, indicators that reflect climate, such as vegetation, ice cores,[71] dendrochronology, sea level change, and glacial geology.
Temperature measurements and proxies
The instrumental temperature record from surface stations was supplemented by radiosonde balloons, extensive atmospheric monitoring by the mid-20th century, and, from the 1970s on, with global satellite data as well. The 18O/16O ratio in calcite and ice core samples used to deduce ocean temperature in the distant past is an example of a temperature proxy method, as are other climate metrics noted in subsequent categories.
Historical and archaeological evidence
Climate change in the recent past may be detected by corresponding changes in settlement and agricultural patterns.[72] Archaeological evidence, oral history and historical documents can offer insights into past changes in the climate. Climate change effects have been linked to the collapse of various civilizations.[72]
Glaciers
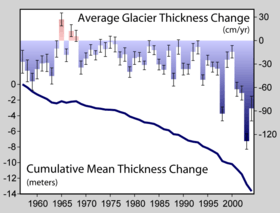
Glaciers are considered among the most sensitive indicators of climate change.[73] Their size is determined by a mass balance between snow input and melt output. As temperatures warm, glaciers retreat unless snow precipitation increases to make up for the additional melt; the converse is also true.
Glaciers grow and shrink due both to natural variability and external forcings. Variability in temperature, precipitation, and englacial and subglacial hydrology can strongly determine the evolution of a glacier in a particular season. Therefore, one must average over a decadal or longer time-scale and/or over many individual glaciers to smooth out the local short-term variability and obtain a glacier history that is related to climate.
A world glacier inventory has been compiled since the 1970s, initially based mainly on aerial photographs and maps but now relying more on satellites. This compilation tracks more than 100,000 glaciers covering a total area of approximately 240,000 km2, and preliminary estimates indicate that the remaining ice cover is around 445,000 km2. The World Glacier Monitoring Service collects data annually on glacier retreat and glacier mass balance. From this data, glaciers worldwide have been found to be shrinking significantly, with strong glacier retreats in the 1940s, stable or growing conditions during the 1920s and 1970s, and again retreating from the mid-1980s to present.[74]
The most significant climate processes since the middle to late Pliocene (approximately 3 million years ago) are the glacial and interglacial cycles. The present interglacial period (the Holocene) has lasted about 11,700 years.[75] Shaped by orbital variations, responses such as the rise and fall of continental ice sheets and significant sea-level changes helped create the climate. Other changes, including Heinrich events, Dansgaard–Oeschger events and the Younger Dryas, however, illustrate how glacial variations may also influence climate without the orbital forcing.
Glaciers leave behind moraines that contain a wealth of material—including organic matter, quartz, and potassium that may be dated—recording the periods in which a glacier advanced and retreated. Similarly, by tephrochronological techniques, the lack of glacier cover can be identified by the presence of soil or volcanic tephra horizons whose date of deposit may also be ascertained.
Arctic sea ice loss
The decline in Arctic sea ice, both in extent and thickness, over the last several decades is further evidence for rapid climate change.[76] Sea ice is frozen seawater that floats on the ocean surface. It covers millions of square miles in the polar regions, varying with the seasons. In the Arctic, some sea ice remains year after year, whereas almost all Southern Ocean or Antarctic sea ice melts away and reforms annually. Satellite observations show that Arctic sea ice is now declining at a rate of 13.3 percent per decade, relative to the 1981 to 2010 average.[77]

Vegetation
A change in the type, distribution and coverage of vegetation may occur given a change in the climate. Some changes in climate may result in increased precipitation and warmth, resulting in improved plant growth and the subsequent sequestration of airborne CO2. A gradual increase in warmth in a region will lead to earlier flowering and fruiting times, driving a change in the timing of life cycles of dependent organisms. Conversely, cold will cause plant bio-cycles to lag.[78] Larger, faster or more radical changes, however, may result in vegetation stress, rapid plant loss and desertification in certain circumstances.[79][80] An example of this occurred during the Carboniferous Rainforest Collapse (CRC), an extinction event 300 million years ago. At this time vast rainforests covered the equatorial region of Europe and America. Climate change devastated these tropical rainforests, abruptly fragmenting the habitat into isolated 'islands' and causing the extinction of many plant and animal species.[79]
Pollen analysis
Palynology is the study of contemporary and fossil palynomorphs, including pollen. Palynology is used to infer the geographical distribution of plant species, which vary under different climate conditions. Different groups of plants have pollen with distinctive shapes and surface textures, and since the outer surface of pollen is composed of a very resilient material, they resist decay. Changes in the type of pollen found in different layers of sediment in lakes, bogs, or river deltas indicate changes in plant communities. These changes are often a sign of a changing climate.[81][82] As an example, palynological studies have been used to track changing vegetation patterns throughout the Quaternary glaciations[83] and especially since the last glacial maximum.[84]

Cloud cover and precipitation
Past precipitation can be estimated in the modern era with the global network of precipitation gauges. Surface coverage over oceans and remote areas is relatively sparse, but, reducing reliance on interpolation, satellite clouds and precipitation data has been available since the 1970s.[86] Quantification of climatological variation of precipitation in prior centuries and epochs is less complete but approximated using proxies such as marine sediments, ice cores, cave stalagmites, and tree rings.[87] In July 2016 scientists published evidence of increased cloud cover over polar regions,[88] as predicted by climate models.[89]
Climatological temperatures substantially affect cloud cover and precipitation. For instance, during the Last Glacial Maximum of 18,000 years ago, thermal-driven evaporation from the oceans onto continental landmasses was low, causing large areas of extreme desert, including polar deserts (cold but with low rates of cloud cover and precipitation).[85] In contrast, the world's climate was cloudier and wetter than today near the start of the warm Atlantic Period of 8000 years ago.[85]
Estimated global land precipitation increased by approximately 2% over the course of the 20th century, though the calculated trend varies if different time endpoints are chosen, complicated by ENSO and other oscillations, including greater global land cloud cover precipitation in the 1950s and 1970s than the later 1980s and 1990s despite the positive trend over the century overall.[86][90][91] Similar slight overall increase in global river runoff and in average soil moisture has been perceived.[90]
Dendroclimatology
Dendroclimatology is the analysis of tree ring growth patterns to determine past climate variations.[92] Wide and thick rings indicate a fertile, well-watered growing period, whilst thin, narrow rings indicate a time of lower rainfall and less-than-ideal growing conditions.
Ice cores
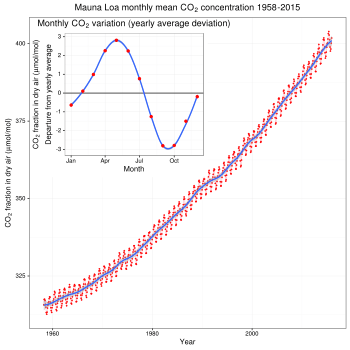
Analysis of ice in a core drilled from an ice sheet such as the Antarctic ice sheet, can be used to show a link between temperature and global sea level variations. The air trapped in bubbles in the ice can also reveal the CO2 variations of the atmosphere from the distant past, well before modern environmental influences. The study of these ice cores has been a significant indicator of the changes in CO2 over many millennia, and continues to provide valuable information about the differences between ancient and modern atmospheric conditions.
Animals
Remains of beetles are common in freshwater and land sediments. Different species of beetles tend to be found under different climatic conditions. Given the extensive lineage of beetles whose genetic makeup has not altered significantly over the millennia, knowledge of the present climatic range of the different species, and the age of the sediments in which remains are found, past climatic conditions may be inferred.[93]
Similarly, the historical abundance of various fish species has been found to have a substantial relationship with observed climatic conditions.[94] Changes in the primary productivity of autotrophs in the oceans can affect marine food webs.[95]
Sea level change
Global sea level change for much of the last century has generally been estimated using tide gauge measurements collated over long periods of time to give a long-term average. More recently, altimeter measurements — in combination with accurately determined satellite orbits — have provided an improved measurement of global sea level change.[96] To measure sea levels prior to instrumental measurements, scientists have dated coral reefs that grow near the surface of the ocean, coastal sediments, marine terraces, ooids in limestones, and nearshore archaeological remains. The predominant dating methods used are uranium series and radiocarbon, with cosmogenic radionuclides being sometimes used to date terraces that have experienced relative sea level fall. In the early Pliocene, global temperatures were 1–2˚C warmer than the present temperature, yet sea level was 15–25 meters higher than today.[97]
See also
- Abrupt climate change and links therein
- Blue carbon
- Climate change in literature
- Geologic time scale
- Homogenization
- Solar variation
- Temperature record
Climate of recent glaciations
Climate of the past
Recent climate
Notes
- ↑ America's Climate Choices: Panel on Advancing the Science of Climate Change; National Research Council (2010). Advancing the Science of Climate Change. Washington, D.C.: The National Academies Press. ISBN 0-309-14588-0.
(p1) ... there is a strong, credible body of evidence, based on multiple lines of research, documenting that climate is changing and that these changes are in large part caused by human activities. While much remains to be learned, the core phenomenon, scientific questions, and hypotheses have been examined thoroughly and have stood firm in the face of serious scientific debate and careful evaluation of alternative explanations. * * * (pp. 21–22) Some scientific conclusions or theories have been so thoroughly examined and tested, and supported by so many independent observations and results, that their likelihood of subsequently being found to be wrong is vanishingly small. Such conclusions and theories are then regarded as settled facts. This is the case for the conclusions that the Earth system is warming and that much of this warming is very likely due to human activities.
- ↑
- ↑ "Glossary – Climate Change". Education Center – Arctic Climatology and Meteorology. NSIDC National Snow and Ice Data Center.; Glossary, in IPCC TAR WG1 2001.
- ↑ "The United Nations Framework Convention on Climate Change". 21 March 1994.
Climate change means a change of climate which is attributed directly or indirectly to human activity that alters the composition of the global atmosphere and which is in addition to natural climate variability observed over comparable time periods.
- ↑ "What's in a Name? Global Warming vs. Climate Change". NASA. Retrieved 23 July 2011.
- ↑ Hulme, Mike (2016). Concept of Climate Change, in: The International Encyclopedia of Geography. Wiley-Blackwell/Association of American Geographers (AAG). Retrieved 16 May 2016.
- ↑ US EPA. Glossary of climate change terms.
- ↑ "Glossary". NASA Earth Observatory. 2011. Retrieved 8 July 2011.
Climate System: The five physical components (atmosphere, hydrosphere, cryosphere, lithosphere, and biosphere) that are responsible for the climate and its variations.
- ↑ IPCC (2007). "What are Climate Change and Climate Variability?". IPCC.
- ↑ Brown, Patrick T.; Li, Wenhong; Cordero, Eugene C.; Mauget, Steven A. (2015-04-21). "Comparing the model-simulated global warming signal to observations using empirical estimates of unforced noise". Scientific Reports. 5. doi:10.1038/srep09957. ISSN 2045-2322. PMC 4404682
 . PMID 25898351.
 - ↑ Hasselmann, K. (1976-12-01). "Stochastic climate models Part I. Theory". Tellus. 28 (6): 473–485. doi:10.1111/j.2153-3490.1976.tb00696.x. ISSN 2153-3490.
- ↑ Meehl, Gerald A.; Hu, Aixue; Arblaster, Julie M.; Fasullo, John; Trenberth, Kevin E. (2013-04-08). "Externally Forced and Internally Generated Decadal Climate Variability Associated with the Interdecadal Pacific Oscillation". Journal of Climate. 26 (18): 7298–7310. doi:10.1175/JCLI-D-12-00548.1. ISSN 0894-8755.
- ↑ England, Matthew H.; McGregor, Shayne; Spence, Paul; Meehl, Gerald A.; Timmermann, Axel; Cai, Wenju; Gupta, Alex Sen; McPhaden, Michael J.; Purich, Ariaan (2014-03-01). "Recent intensification of wind-driven circulation in the Pacific and the ongoing warming hiatus". Nature Climate Change. 4 (3): 222–227. doi:10.1038/nclimate2106. ISSN 1758-678X.
- ↑ Brown, Patrick T.; Li, Wenhong; Li, Laifang; Ming, Yi (2014-07-28). "Top-of-atmosphere radiative contribution to unforced decadal global temperature variability in climate models". Geophysical Research Letters. 41 (14): 2014GL060625. doi:10.1002/2014GL060625. ISSN 1944-8007.
- ↑ Palmer, M. D.; McNeall, D. J. (2014-01-01). "Internal variability of Earth's energy budget simulated by CMIP5 climate models". Environmental Research Letters. 9 (3): 034016. doi:10.1088/1748-9326/9/3/034016. ISSN 1748-9326.
- ↑ Kirk Bryan, Geophysical Fluid Dynamics Laboratory. Man's Great Geophysical Experiment. U.S. National Oceanic and Atmospheric Administration.
- ↑ Spracklen, D. V; Bonn, B.; Carslaw, K. S (2008). "Boreal forests, aerosols and the impacts on clouds and climate". Philosophical Transactions of the Royal Society A: Mathematical, Physical and Engineering Sciences. 366 (1885): 4613–26. Bibcode:2008RSPTA.366.4613S. doi:10.1098/rsta.2008.0201. PMID 18826917.
- ↑ Christner, B. C.; Morris, C. E.; Foreman, C. M.; Cai, R.; Sands, D. C. (2008). "Ubiquity of Biological Ice Nucleators in Snowfall". Science. 319 (5867): 1214. Bibcode:2008Sci...319.1214C. doi:10.1126/science.1149757. PMID 18309078.
- ↑ Schwartzman, David W.; Volk, Tyler (1989). "Biotic enhancement of weathering and the habitability of Earth". Nature. 340 (6233): 457–460. Bibcode:1989Natur.340..457S. doi:10.1038/340457a0.
- ↑ Kopp, R. E.; Kirschvink, J. L.; Hilburn, I. A.; Nash, C. Z. (2005). "The Paleoproterozoic snowball Earth: A climate disaster triggered by the evolution of oxygenic photosynthesis". Proceedings of the National Academy of Sciences. 102 (32): 11131–6. Bibcode:2005PNAS..10211131K. doi:10.1073/pnas.0504878102. PMC 1183582. PMID 16061801.
- ↑ Kasting, J. F.; Siefert, JL (2002). "Life and the Evolution of Earth's Atmosphere". Science. 296 (5570): 1066–8. Bibcode:2002Sci...296.1066K. doi:10.1126/science.1071184. PMID 12004117.
- ↑ Mora, C. I.; Driese, S. G.; Colarusso, L. A. (1996). "Middle to Late Paleozoic Atmospheric CO2 Levels from Soil Carbonate and Organic Matter". Science. 271 (5252): 1105–1107. Bibcode:1996Sci...271.1105M. doi:10.1126/science.271.5252.1105.
- ↑ Berner, R. A. (1999). "Atmospheric oxygen over Phanerozoic time". Proceedings of the National Academy of Sciences. 96 (20): 10955–7. Bibcode:1999PNAS...9610955B. doi:10.1073/pnas.96.20.10955. PMC 34224. PMID 10500106.
- ↑ Bains, Santo; Norris, Richard D.; Corfield, Richard M.; Faul, Kristina L. (2000). "Termination of global warmth at the Palaeocene/Eocene boundary through productivity feedback". Nature. 407 (6801): 171–4. Bibcode:2000Natur.407..171B. doi:10.1038/35025035. PMID 11001051.
- ↑ Zachos, J. C.; Dickens, G. R. (2000). "An assessment of the biogeochemical feedback response to the climatic and chemical perturbations of the LPTM". GFF. 122: 188–189. doi:10.1080/11035890001221188.
- ↑ Speelman, E. N.; Van Kempen, M. M. L.; Barke, J.; Brinkhuis, H.; Reichart, G. J.; Smolders, A. J. P.; Roelofs, J. G. M.; Sangiorgi, F.; De Leeuw, J. W.; Lotter, A. F.; Sinninghe Damsté, J. S. (2009). "The Eocene Arctic Azolla bloom: Environmental conditions, productivity and carbon drawdown". Geobiology. 7 (2): 155–70. doi:10.1111/j.1472-4669.2009.00195.x. PMID 19323694.
- ↑ Brinkhuis, Henk; Schouten, Stefan; Collinson, Margaret E.; Sluijs, Appy; Sinninghe Damsté, Jaap S. Sinninghe; Dickens, Gerald R.; Huber, Matthew; Cronin, Thomas M.; Onodera, Jonaotaro; Takahashi, Kozo; Bujak, Jonathan P.; Stein, Ruediger; Van Der Burgh, Johan; Eldrett, James S.; Harding, Ian C.; Lotter, André F.; Sangiorgi, Francesca; Van Konijnenburg-Van Cittert, Han van Konijnenburg-van; De Leeuw, Jan W.; Matthiessen, Jens; Backman, Jan; Moran, Kathryn; Expedition 302, Scientists (2006). "Episodic fresh surface waters in the Eocene Arctic Ocean". Nature. 441 (7093): 606–9. Bibcode:2006Natur.441..606B. doi:10.1038/nature04692. PMID 16752440.
- ↑ Retallack, Gregory J. (2001). "Cenozoic Expansion of Grasslands and Climatic Cooling". The Journal of Geology. 109 (4): 407–426. Bibcode:2001JG....109..407R. doi:10.1086/320791.
- ↑ Dutton, Jan F.; Barron, Eric J. (1997). "Miocene to present vegetation changes: A possible piece of the Cenozoic cooling puzzle". Geology. 25: 39. Bibcode:1997Geo....25...39D. doi:10.1130/0091-7613(1997)025<0039:MTPVCA>2.3.CO;2.
- 1 2 "Milankovitch Cycles and Glaciation". University of Montana. Archived from the original on 2011-07-16. Retrieved 2 April 2009.
- ↑ Gale, Andrew S. (1989). "A Milankovitch scale for Cenomanian time". Terra Nova. 1 (5): 420–425. doi:10.1111/j.1365-3121.1989.tb00403.x.
- ↑ "Same forces as today caused climate changes 1.4 billion years ago". sdu.dk. University of Denmark.
- ↑ FAQ 6.1: What Caused the Ice Ages and Other Important Climate Changes Before the Industrial Era? in IPCC AR4 WG1 2007.
- ↑ Box 6.2: What Caused the Low Atmospheric Carbon Dioxide Concentrations During Glacial Times? in IPCC AR4 WG1 2007 .
- 1 2 Marty, B. (2006). "Water in the Early Earth". Reviews in Mineralogy and Geochemistry. 62: 421–450. doi:10.2138/rmg.2006.62.18.
- ↑ Watson, E. B.; Harrison, TM (2005). "Zircon Thermometer Reveals Minimum Melting Conditions on Earliest Earth". Science. 308 (5723): 841–4. Bibcode:2005Sci...308..841W. doi:10.1126/science.1110873. PMID 15879213.
- ↑ Hagemann, Steffen G.; Gebre-Mariam, Musie; Groves, David I. (1994). "Surface-water influx in shallow-level Archean lode-gold deposits in Western, Australia". Geology. 22 (12): 1067. Bibcode:1994Geo....22.1067H. doi:10.1130/0091-7613(1994)022<1067:SWIISL>2.3.CO;2.
- ↑ Sagan, C.; G. Mullen (1972). Earth and Mars: Evolution of Atmospheres and Surface Temperatures.
- ↑ Sagan, C.; Chyba, C (1997). "The Early Faint Sun Paradox: Organic Shielding of Ultraviolet-Labile Greenhouse Gases". Science. 276 (5316): 1217–21. Bibcode:1997Sci...276.1217S. doi:10.1126/science.276.5316.1217. PMID 11536805.
- ↑ Willson, Richard C.; Hudson, Hugh S. (1991). "The Sun's luminosity over a complete solar cycle". Nature. 351 (6321): 42–44. Bibcode:1991Natur.351...42W. doi:10.1038/351042a0.
- ↑ Willson, Richard C. (2003). "Secular total solar irradiance trend during solar cycles 21–23". Geophysical Research Letters. 30 (5). Bibcode:2003GeoRL..30.1199W. doi:10.1029/2002GL016038.
- ↑ "Solar Irradiance Changes and the Relatively Recent Climate". Solar influences on global change. Washington, D.C: National Academy Press. 1994. p. 36. ISBN 0-309-05148-7.
- ↑ "Glossary I-M". NASA Earth Observatory. Retrieved 28 February 2011.
- ↑ Bard, Edouard; Raisbeck, Grant; Yiou, Françoise; Jouzel, Jean (2000). "Solar irradiance during the last 1200 years based on cosmogenic nuclides". Tellus B. 52 (3): 985–992. Bibcode:2000TellB..52..985B. doi:10.1034/j.1600-0889.2000.d01-7.x.
- ↑ "NASA Study Finds Increasing Solar Trend That Can Change Climate". 2003.
- ↑ Svensmark, Henrik; Bondo, Torsten; Svensmark, Jacob (2009). "Cosmic ray decreases affect atmospheric aerosols and clouds". Geophysical Research Letters. 36 (15): n/a. Bibcode:2009GeoRL..3615101S. doi:10.1029/2009GL038429.
- ↑ Haigh, Joanna D.; Ann R. Winning; Ralf Toumi; Jerald W. Harder (2010-10-07). "An influence of solar spectral variations on radiative forcing of climate". Nature. 467 (7316): 696–9. Bibcode:2010Natur.467..696H. doi:10.1038/nature09426. ISSN 0028-0836. PMID 20930841.
Currently there is insufficient observational evidence to validate the spectral variations observed by SIM, or to fully characterize other solar cycles, but our findings raise the possibility that the effects of solar variability on temperature throughout the atmosphere may be contrary to current expectations.
- ↑ Jasper Kirkby; et al. (2011). "CERN's CLOUD experiment provides unprecedented insight into cloud formation". Nature. doi:10.1038/news.2011.504.
- 1 2 Miles, M. G.; Grainger, R. G.; Highwood, E. J. (2004). "The significance of volcanic eruption strength and frequency for climate" (pdf). Quarterly Journal of the Royal Meteorological Society. 130 (602): 2361–2376. doi:10.1256/qj.30.60.
- ↑ "Volcanic Gases and Climate Change Overview". usgs.gov. USGS. Retrieved 31 July 2014.
- ↑ Diggles, Michael (28 February 2005). "The Cataclysmic 1991 Eruption of Mount Pinatubo, Philippines". U.S. Geological Survey Fact Sheet 113-97. United States Geological Survey. Retrieved 8 October 2009.
- ↑ Diggles, Michael. "The Cataclysmic 1991 Eruption of Mount Pinatubo, Philippines". usgs.gov. Retrieved 31 July 2014.
- ↑ Newhall, Chris. "The Atmospheric Impact of the 1991 Mount Pinatubo Eruption". usgs.gov. USGS. Retrieved 31 July 2014.
- ↑ Oppenheimer, Clive (2003). "Climatic, environmental and human consequences of the largest known historic eruption: Tambora volcano (Indonesia) 1815". Progress in Physical Geography. 27 (2): 230–259. doi:10.1191/0309133303pp379ra.
- ↑ Wignall, P (2001). "Large igneous provinces and mass extinctions". Earth-Science Reviews. 53: 1–33. Bibcode:2001ESRv...53....1W. doi:10.1016/S0012-8252(00)00037-4.
- ↑ Graf, H.-F.; Feichter, J.; Langmann, B. (1997). "Volcanic sulphur emissions: Estiamtes of source strength and its contribution to the global sulphate distribution" (pdf). Journal of Geophysical Research: Atmospheres. 102: 10727–10738. Bibcode:1997JGR...10210727G. doi:10.1029/96JD03265.
- ↑ "IPCC Fourth Assessment Report: Climate Change 2007". ipcc.ch. Retrieved 31 July 2014.
- ↑ "Volcanic Gases and Their Effects". U.S. Department of the Interior. 2006-01-10. Retrieved 21 January 2008.
- ↑ "Human Activities Emit Way More Carbon Dioxide Than Do Volcanoes". American Geophysical Union. 14 June 2011. Retrieved 20 June 2011.
- ↑ Annexes, in IPCC AR4 SYR 2007.
- ↑ Forest, C. E.; Wolfe, J. A.; Molnar, P. .; Emanuel, K. A. (1999). "Paleoaltimetry incorporating atmospheric physics and botanical estimates of paleoclimate". Geological Society of America Bulletin. 111 (4): 497–511. Bibcode:1999GSAB..111..497F. doi:10.1130/0016-7606(1999)111<0497:PIAPAB>2.3.CO;2.
- ↑ "Panama: Isthmus that Changed the World". NASA Earth Observatory. Archived from the original on 2 August 2007. Retrieved 1 July 2008.
- ↑ Haug, Gerald H.; Keigwin, Lloyd D. (22 March 2004). "How the Isthmus of Panama Put Ice in the Arctic". Oceanus. Woods Hole Oceanographic Institution. 42 (2). Retrieved 1 October 2013.
- ↑ Bruckschen, Peter; Oesmanna, Susanne; Veizer, Ján (1999-09-30). "Isotope stratigraphy of the European Carboniferous: proxy signals for ocean chemistry, climate and tectonics". Chemical Geology. 161 (1–3): 127–163. doi:10.1016/S0009-2541(99)00084-4.
- ↑ Parrish, Judith T. (1993). "Climate of the Supercontinent Pangea". Chemical Geology. The University of Chicago Press. 101 (2): 215–233. Bibcode:1993JG....101..215P. doi:10.1086/648217 (inactive 2015-01-01). JSTOR 30081148.
- ↑ America's Climate Choices: Panel on Advancing the Science of Climate Change; National Research Council (2010). Advancing the Science of Climate Change. Washington, D.C.: The National Academies Press. ISBN 0-309-14588-0.
- ↑ Susan Solomon; Gian-Kasper Plattner; Reto Knutti; Pierre Friedlingstein (2009). "Irreversible climate change due to carbon dioxide emissions" (PDF). Proceedings of the National Academy of Sciences of the United States of America. Proceedings of the National Academy of Sciences of the United States of America. 106 (6): 1704–9. Bibcode:2009PNAS..106.1704S. doi:10.1073/pnas.0812721106. PMC 2632717. PMID 19179281.
- ↑ Steinfeld, H.; P. Gerber; T. Wassenaar; V. Castel; M. Rosales; C. de Haan (2006). Livestock's long shadow.
- ↑ The Editorial Board (28 November 2015). "What the Paris Climate Meeting Must Do". New York Times. Retrieved 28 November 2015.
- ↑ Brown, Dwayne; Cabbage, Michael; McCarthy, Leslie; Norton, Karen (20 January 2016). "NASA, NOAA Analyses Reveal Record-Shattering Global Warm Temperatures in 2015". NASA. Retrieved 21 January 2016.
- ↑ Petit, J. R.; Jouzel, J.; Raynaud, D.; Barkov, N. I.; Barnola, J.-M.; Basile, I.; Bender, M.; Chappellaz, J.; Davis, M.; Delaygue, G.; Delmotte, M.; Kotlyakov, V. M.; Legrand, M.; Lipenkov, V. Y.; Lorius, C.; Ritz, C.; Saltzman, E. (1999-06-03). "Climate and atmospheric history of the past 420,000 years from the Vostok ice core, Antarctica". Nature. 399 (1): 429–436. Bibcode:1999Natur.399..429P. doi:10.1038/20859.
- 1 2 Demenocal, P. B. (2001). "Cultural Responses to Climate Change During the Late Holocene" (PDF). Science. 292 (5517): 667–673. Bibcode:2001Sci...292..667D. doi:10.1126/science.1059827. PMID 11303088.
- ↑ Seiz, G.; N. Foppa (2007). The activities of the World Glacier Monitoring Service (WGMS) (PDF) (Report). Archived from the original (PDF) on 25 March 2009. Retrieved 21 June 2009.
- ↑ Zemp, M.; I.Roer; A.Kääb; M.Hoelzle; F.Paul; W. Haeberli (2008). United Nations Environment Programme – Global Glacier Changes: facts and figures (PDF) (Report). Retrieved 21 June 2009.
- ↑ "International Stratigraphic Chart". International Commission on Stratigraphy. 2008. Retrieved 3 October 2011.
- ↑ NASA Global Climate Change "Climate Change: How do we know?",
- ↑ Shaftel, Holly. "Arctic Sea Ice Minimum". NASA Global Climate Change. Earth Science Communications Team at NASA's Jet Propulsion Laboratory. Retrieved 21 June 2015.
- ↑ Kinver, Mark (2011-11-15). "UK trees' fruit ripening '18 days earlier'". Bbc.co.uk. Retrieved 1 November 2012.
- 1 2 Sahney, S., Benton, M.J. & Falcon-Lang, H.J. (2010). "Rainforest collapse triggered Pennsylvanian tetrapod diversification in Euramerica" (PDF). Geology. 38 (12): 1079–1082. Bibcode:2010Geo....38.1079S. doi:10.1130/G31182.1. Retrieved 27 November 2013.
- ↑ Bachelet, D; R.Neilson,J.M.Lenihan,R.J.Drapek (2001). "Climate Change Effects on Vegetation Distribution and Carbon Budget in the United States". Ecosystems. 4 (3): 164–185. doi:10.1007/s10021-001-0002-7.
- ↑ Langdon, PG; Barber KE; , Lomas-Clarke SH; Lomas-Clarke (Previously Morriss), S.H. (August 2004). "Reconstructing climate and environmental change in northern England through chironomid and pollen analyses: evidence from Talkin Tarn, Cumbria". Journal of Paleolimnology. 32 (2): 197–213. doi:10.1023/B:JOPL.0000029433.85764.a5.
- ↑ Birks, HH (March 2003). "The importance of plant macrofossils in the reconstruction of Lateglacial vegetation and climate: examples from Scotland, western Norway, and Minnesota, USA". Quaternary Science Reviews. 22 (5–7): 453–473. Bibcode:2003QSRv...22..453B. doi:10.1016/S0277-3791(02)00248-2.
- ↑ Miyoshi, N; Fujiki, Toshiyuki; Morita, Yoshimune (1999). "Palynology of a 250-m core from Lake Biwa: a 430,000-year record of glacial–interglacial vegetation change in Japan". Review of Palaeobotany and Palynology. 104 (3–4): 267–283. doi:10.1016/S0034-6667(98)00058-X.
- ↑ Prentice, I. Colin; Bartlein, Patrick J; Webb, Thompson (1991). "Vegetation and Climate Change in Eastern North America Since the Last Glacial Maximum". Ecology. 72 (6): 2038–2056. doi:10.2307/1941558. JSTOR 1941558.
- 1 2 3 Adams J.M. & Faure H. (1997) (eds.), QEN members. Review and Atlas of Palaeovegetation: Preliminary land ecosystem maps of the world since the Last Glacial Maximum. Oak Ridge National Laboratory, TN, USA.
- 1 2 New, M., Todd, M., Hulme, M. and Jones, P. (December 2001). "Review: Precipitation measurements and trends in the twentieth century". International Journal of Climatology. 21 (15): 1889–1922. Bibcode:2001IJCli..21.1889N. doi:10.1002/joc.680.
- ↑ Dominic, F., Burns, S.J., Neff, U., Mudulsee, M., Mangina, A. and Matter, A. (April 2004). "Palaeoclimatic interpretation of high-resolution oxygen isotope profiles derived from annually laminated speleothems from Southern Oman". Quaternary Science Reviews. 23 (7–8): 935–945. Bibcode:2004QSRv...23..935F. doi:10.1016/j.quascirev.2003.06.019.
- ↑ http://www.nature.com/nature/journal/vaop/ncurrent/full/nature18273.html
- ↑ http://www.nature.com/news/clouds-get-high-on-climate-change-1.20230
- 1 2 Huntington, T.G. (U.S. Geological Survey) (March 2006). "Evidence for intensification of the global water cycle: Review and synthesis". Journal of Hydrology. 319 (1–4): 83–95. Bibcode:2006JHyd..319...83H. doi:10.1016/j.jhydrol.2005.07.003.
- ↑ Smith, T. M.; Yin, X.; Gruber, A. (2006). "Variations in annual global precipitation (1979–2004), based on the Global Precipitation Climatology Project 2.5° analysis". Geophysical Research Letters. 33 (6). Bibcode:2006GeoRL..3306705S. doi:10.1029/2005GL025393.
- ↑ Dendroclimatology : progress and prospect. New York: Springer. 2010. ISBN 978-1-4020-4010-8.
- ↑ Coope, G.R.; Lemdahl, G.; Lowe, J.J.; Walkling, A. (1999-05-04). "Temperature gradients in northern Europe during the last glacial—Holocene transition(14–9 14 C kyr BP) interpreted from coleopteran assemblages". Journal of Quaternary Science. 13 (5): 419–433. Bibcode:1998JQS....13..419C. doi:10.1002/(SICI)1099-1417(1998090)13:5<419::AID-JQS410>3.0.CO;2-D.
- ↑ FAO Fisheries Technical Paper. No. 410. Rome, FAO. 2001. Climate Change and Long-Term Fluctuations of Commercial Catches. United Nations Food and Agriculture Organization.
- ↑ Brown, C. J., Fulton, E. A., Hobday, A. J., Matear, R. J., Possingham, H. P., Bulman, C., Christensen, V., Forrest, R. E., Gehrke, P. C., Gribble, N. A., Griffiths, S. P., Lozano-Montes, H., Martin, J. M., Metcalf, S., Okey, T. A., Watson, R. and Richardson, A. J. (April 2010). "Effects of climate-driven primary production change on marine food webs: Implications for fisheries and conservation". Global Change Biology. 16 (4): 1194–1212. doi:10.1111/j.1365-2486.2009.02046.x.
- ↑ "Sea Level Change". University of Colorado at Boulder. Retrieved 21 July 2009.
- ↑ Hansen, James. "Science Briefs: Earth's Climate History". NASA GISS. Retrieved 25 April 2013.
References
- IPCC AR4 WG1 (2007). Solomon, S.; Qin, D.; Manning, M.; Chen, Z.; Marquis, M.; Averyt, K.B.; Tignor, M.; Miller, H.L., eds. Climate Change 2007: The Physical Science Basis. Contribution of Working Group I to the Fourth Assessment Report of the Intergovernmental Panel on Climate Change. Cambridge University Press. ISBN 978-0-521-88009-1 (pb: 978-0-521-70596-7).
- IPCC AR4 SYR (2007). Core Writing Team; Pachauri, R.K; Reisinger, A., eds. Climate Change 2007: Synthesis Report. Contribution of Working Groups I, II and III to the Fourth Assessment Report of the Intergovernmental Panel on Climate Change. IPCC. ISBN 92-9169-122-4.
- IPCC TAR WG1 (2001). Houghton, J.T.; Ding, Y.; Griggs, D.J.; Noguer, M.; van der Linden, P.J.; Dai, X.; Maskell, K.; Johnson, C.A., eds. Climate Change 2001: The Scientific Basis. Contribution of Working Group I to the Third Assessment Report of the Intergovernmental Panel on Climate Change. Cambridge University Press. ISBN 0-521-80767-0 (pb: 0-521-01495-6).
Further reading
- IPCC AR4 WG1 (2007). "Summary for Policymakers". In Solomon, S.; Qin, D.; Manning, M.; Chen, Z.; Marquis, M.; Averyt, K.B.; Tignor, M.; Miller, H.L. Climate Change 2007: The Physical Science Basis. Contribution of Working Group I to the Fourth Assessment Report of the Intergovernmental Panel on Climate Change. Cambridge University Press. ISBN 978-0-521-88009-1. (pb: 978-0-521-70596-7).
- IPCC AR4 SYR (2007). "Summary for Policymakers". In Core Writing Team; Pachauri, R.K; Reisinger, A. Climate Change 2007: Synthesis Report. Contribution of Working Groups I, II and III to the Fourth Assessment Report of the Intergovernmental Panel on Climate Change. IPCC. ISBN 92-9169-122-4..
- Emanuel K (August 2005). "Increasing destructiveness of tropical cyclones over the past 30 years" (PDF). Nature. 436 (7051): 686–8. Bibcode:2005Natur.436..686E. doi:10.1038/nature03906. PMID 16056221.
- Edwards, Paul Geoffrey; Miller, Clark A. (2001). Changing the atmosphere: expert knowledge and environmental governance. Cambridge, Mass: MIT Press. ISBN 0-262-63219-5.
- McKibben, Bill (2011). The Global Warming Reader. New York, N.Y.: OR Books. ISBN 978-1-935928-36-2.
- Ruddiman, W. F. (2003). "The anthropogenic greenhouse era began thousands of years ago". Climate Change. 61 (3): 261–293. doi:10.1023/B:CLIM.0000004577.17928.fa.
- William F. Ruddiman (2005). Plows, plagues, and petroleum: how humans took control of climate. Princeton, N.J: Princeton University Press. ISBN 0-691-13398-0.
- Ruddiman, W. F., Vavrus, S. J. and Kutzbach, J. E. (2005). "A test of the overdue-glaciation hypothesis". Quaternary Science Reviews. 24 (11): 1–10. Bibcode:2005QSRv...24....1R. doi:10.1016/j.quascirev.2004.07.010.
- Schelling, Thomas C. (2002). "Greenhouse Effect". In David R. Henderson. Concise Encyclopedia of Economics (1st ed.). Library of Economics and Liberty. OCLC 317650570, 50016270, 163149563
- Schmidt, G. A., Shindel, D. T. and Harder, S. (2004). "A note of the relationship between ice core methane concentrations and insolation". Geophys. Res. Lett. 31 (23): L23206. Bibcode:2004GeoRL..3123206S. doi:10.1029/2004GL021083.
- Wagner, Frederic H., (ed.) Climate Change in Western North America: Evidence and Environmental Effects (2009). ISBN 978-0-87480-906-0
External links
| Wikiquote has quotations related to: Climate change |

| Wikinews has news related to: |
| Wikimedia Commons has media related to Climate change. |
- Climate Change at DMOZ
- Climate Change Resources from SourceWatch
- Climate Change from the UCB Libraries GovPubs
- Climate Change from the Met Office (UK)
- Global Climate Change from NASA (US)
- Global Climate Change Indicators from NOAA
- Climate Change: Evidence & Causes, from the Royal Society and the U.S. National Academy of Sciences
- Ocean Motion: Satellites Record Weakening North Atlantic Current
- Intergovernmental Panel on Climate Change (IPCC)
- United Nations University's 'Our World 2' Climate Change Video Briefs
- United Nations University's 'Our World 2' Indigenous voices on climate change films
- Climate Change on In Our Time at the BBC. (listen now)
- Climate Change Performance Index 2010
- Climate Library at Center for Ocean Solutions, Stanford University
- Climate Change: Coral Reefs on the Edge An online video presentation by Prof. Ove Hoegh-Guldberg, University of Auckland
- What We Know — The Reality, Risks and Response to Climate Change 2014 report, Am. Assn. for the Advancement of Science
- Gateway to the United Nations Systems Work on Climate Change - The Science
- Gateway to the United Nations Systems Work on Climate Change - Mitigation
- HistoricalClimatology.com
- Climate History Network