Demographics of Taiwan

This article is about the demographic features of the population in Taiwan, including population density, ethnicity, education level, health of the populace, economic status, religious affiliations and other aspects of the population.
The population in Taiwan is approximately 23.4 million, spread across a total land area of about 36,000 km2; it is the seventeenth most densely populated country in the world with a population density of about 650 inhabitants per square kilometer.
The original population of the island of Taiwan and its associated islands, i.e. not including Kinmen and the Matsu Islands, consisted of Taiwanese aborigines, speaking Austronesian languages and sharing mitochondrial DNA contribution with island peoples of Southeast Asia and the Pacific.[1] Immigration of Han Chinese to the Penghu islands started as early as the 13th century, while settlement of the main island occurred from the 16th century, stimulated by the import of workers from Fujian by the Dutch in the 17th century. According to governmental statistics, over 95% of the Republic of China's population is now made up of Han Chinese, while 2.3% are Taiwanese aborigines.[2] Half the population are followers of one or a mixture of 25 recognized religions. Around 93% of the religious population are followers of a mixture of Buddhism, Taoism, and Confucianism, while a minority 4.5% are followers of Christianity.
During the 20th century the population of Taiwan rose more than sevenfold, from about 3 million in 1905 to more than 22 million by 2001. This high growth was caused by a combination of factors, very high fertility rates up to the 1960s, and low mortality rates, and a surge in population as the Chinese Civil War ended, and the Kuomintang (KMT) forces retreated, bringing an influx of 1.2 to 2 million soldiers and civilians to Taiwan in 1948–1949.[3][4] Consequently, the natural growth rate was very rapid, especially in the late 1940s and 1950s, with an effective annual growth rate as high as 3.68% during 1951–1956. Including the Kuomintang forces, which accounted in 1950 for about 25% of all persons on Taiwan, immigration of mainland Chinese (now approximately 13% of the present population) at the end of the 1940s was a major factor in the high population growth of Taiwan.[5]
Fertility rates decreased gradually thereafter, and in 1984 the rate reached the replacement level (2.1 children per woman, which is needed to replace the existing population). Fertility rates have continued to decline and in 2010 Taiwan was experiencing a population growth of less than 0.2% and a fertility rate of only 0.9, which is the lowest rate ever recorded in Taiwan. The population of Taiwan is projected to peak at about 23.7 million in 2024 and decrease thereafter.[6]
The official national language is Standard Chinese, although around 70% also speak Taiwanese Hokkien 10% speak Hakka. Japanese speakers are becoming rare as the elderly generation who lived under Japanese rule are dying out. Aboriginal languages are gradually becoming extinct as the aborigines have become acculturated despite a program by the ROC government to preserve the languages.
Population

According to May 2006 statistics from the Ministry of the Interior, the population of Taiwan was 22,805,547, 99.6% of which live on island of Taiwan. The remaining 0.4% (82,618) live on offshore islands (Penghu, Lanyu, Green, Kinmen and Matsu).
Taiwan is ranked the 50th most populous nation in the world.
Historical
The number of Chinese in the island in 1624, prior to Dutch rule, was about 25,000.[7] It is estimated that prior to Kingdom of Tungning (1661) the population of Taiwan was no greater than 100,000 people, and the initial Zheng army with family and retainers that settled in Taiwan is estimated to be 30,000 at minimum.[8] By 1682 there were only 7,000 Chinese left on Taiwan as they had intermarried with aboriginal women and had property in Taiwan. During Qing rule (1683–1895), the population of Han Chinese in Taiwan grew rapidly from 100,000 to ~2.5 million, while the aboriginal population was estimated to be at least 200,000 by 1895.[9] (The plains aboriginal population is estimated to have decreased by 90% over the hundred years from 1800 to 1900.[10]
The Japanese Colonial Government performed detailed censuses every five years starting in 1905. Statistics showed a population growth rate of about 1% to 3% per year throughout Japanese rule. In 1905, the population of Taiwan was roughly 3 million; by 1940 the population had grown to 5.87 million, and by the end of World War II in 1946 it numbered 6.09 million.
Population census
| Year | Males (thousands) | Females (thousands) | Total population (thousands) | Average annual growth rate (%) |
|---|---|---|---|---|
| 1905 | 1,611 | 1,429 | 3,040 | |
| 1915 | 1,813 | 1,669 | 3,480 | 1.4 |
| 1920 | 1,894 | 1,762 | 3,655 | 1.0 |
| 1925 | 2,053 | 1,941 | 3,993 | 1.8 |
| 1930 | 2,459 | 2,239 | 4,593 | 2.8 |
| 1935 | 2,660 | 2,553 | 5,212 | 2.6 |
| 1940 | 2,971 | 2,901 | 5,872 | 2.4 |
| 1956 | 4,772 | 4,596 | 9,368 | 3.0 |
| 1966 | 7,153 | 6,352 | 13,505 | 3.7 |
| 1970 (sampling) | 7,723 | 7,047 | 14,770 | 2.3 |
| 1975 (sampling) | 8,439 | 7,840 | 16,279 | 2.0 |
| 1980 | 9,405 | 8,624 | 18,030 | 2.1 |
| 1990 | 10,618 | 9,775 | 20,394 | 1.2 |
| 2000 | 11,386 | 10,915 | 22,301 | 0.9 |
| 2010 (end of year estimate) | 23,162 | 0.4 |
Net migration rate
During 2004-2010 Taiwan's migration rate was positive. On average the annual net migration amounted to 22,000 people during that period, which is equivalent to a rate of 1.0 per 1000 inhabitants per year.
Age structure

| Age range | 1980 | census 1990 | census 2000 | 2010 | 2015 |
|---|---|---|---|---|---|
| 0–14 years | 32.1% | 26.9% | 21.2% | 15.65% | 13.6% |
| 15–64 years | 63.6% | 67.0% | 70.2% | 73.61% | 73.9% |
| 65 years and over | 4.3% | 6.1% | 8.6% | 10.74% | 12.5% |
Sex ratio
- at birth: 1.1 male(s)/female
- under 15 years: 1.09 male(s)/female
- 15-64 years: 1.03 male(s)/female
- 65 years and over: 0.99 male(s)/female
- total population: 1.04 male(s)/female (2006 est.)
Nationality
The people from Taiwan identify themselves as Taiwanese (台灣人 Táiwānrén).
Ethnicity (Overview)
The ethnic groups of Taiwan may be roughly divided among Chinese Taiwanese (84%), mainland Chinese (14%), and indigenous peoples (2%).[4] The ROC government reports that over 95% of the population is Han Chinese, which includes Hoklo, Hakka and other groups from mainland China.[11]
Han people
The majority of the Han group descends from immigrants who arrived to the island prior to Japanese rule (1895–1945) and can be classified as the Hoklos and Hakkas, on the basis of language and customs.[12] As the majority of the early immigrants were Hokkien speakers from Fujian[13] who arrived starting in the 17th century, the Hoklos account for about 70% of the total population today. During Qing rule, a large number of Hoklo men took aboriginal brides.[3] Some of the plains aboriginals also adopted Chinese customs and language so as to be indistinguishable from the Han.[14] Thus, many who categorize themselves as Han have some degree of indigenous ancestry.
A significant minority of the Han group are the Hakkas, who comprise about 15% of the total population. The Hakkas emigrated chiefly from eastern Guangdong, speak the Hakka language, and originally took up residence in the hills of the aboriginal border districts.[15][3]
About 14% of the total population are "mainland Chinese",[4] relating to immigrants who followed the ROC relocation from mainland China to Taiwan in 1949.[3] While most of this group were Han Chinese, some of this influx were other of other ethnicities.
Aboriginal
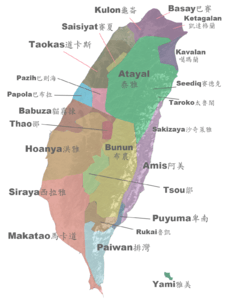
The total population of recognized aborigines on Taiwan is approximately 533,600, or approximately 2.28% of Taiwan's population.[16] The aborigines inhabit the eastern half of Taiwan which consists mostly of mountainous terrain.
| Living in the Eastern plains | Male | Female |
|---|---|---|
| 220,513 (47.1%) | 111,372 | 109,141 |
| Living in the mountains | Male | Female |
| 248,089 (52.9%) | 122,016 | 126,073 |
| 468,602 | 233,388 | 235,214 |
- Note: Source data obtained from ROC Ministry of the Interior website (Spreadsheet data: m1-04.xls)
The ROC government officially recognizes sixteen aborigine tribes (原住民; yuánzhùmín; literally "original inhabitants").[17] These are: Ami, Atayal, Paiwan, Bunun, Hla'alua, Kanakanavu, Puyuma, Rukai, Tsou, Saisiyat, Tao (Yami), Thao, Kavalan, Truku, Seediq, and Sakizaya. Japanese colonial rule of Taiwan classified and recognized nine tribes based on linguistic and cultural data; these criteria were modified and included in the official ROC ethnographies of Taiwanese people. The Thao, Kavalan, Truku, Sakizaya, and Seediq tribes were recognized much later in 2001, 2002, 2004, 2007, and 2008 respectively by the ROC government. There are at least another dozen tribes that are not recognized by the government.
| English name | Chinese name | Pinyin transliteration | Population at census 2000[18] | Population (02/2016)[19] | Date of recognition | Notes |
|---|---|---|---|---|---|---|
| Amis (Pangcah) | 阿美 | Āměi | 148,992 | 203,740 | Japanese colonial era | One of the 9 tribes originally recognized by the Japanese colonial government. Tribal name means "north." |
| Atayal (Tayal) | 泰雅 | Tàiyǎ | 91,883 | 87,156 | Japanese colonial era | One of the 9 tribes originally recognized by the Japanese colonial government. Tribal name means "brave person." |
| Bunun | 布農 | Bùnóng | 41,038 | 56,844 | Japanese colonial era | One of the 9 tribes originally recognized by the Japanese colonial government. |
| Hla'alua | 拉阿魯哇 | Lāālǔwa | - | 294 | 2014 | Originally classified as Tsou. |
| Kanakanavu | 卡那卡那富 | Kǎnàkǎnàfù | - | 267 | 2014 | Originally classified as Tsou. |
| Kavalan | 噶瑪蘭 | Gámǎlán | - | 1,416 | 2002 | Some Kavalan were classified as Amis. |
| Paiwan | 排灣 | Páiwān | 70,331 | 97,788 | Japanese colonial era | One of the 9 tribes originally recognized by the Japanese colonial government. |
| Puyuma | 卑南 | Bēinán | 9,606 | 13,651 | Japanese colonial era | One of the 9 tribes originally recognized by the Japanese colonial government. |
| Rukai | 魯凱 | Lǔkǎi | 12,084 | 12,996 | Japanese colonial era | One of the 9 tribes originally recognized by the Japanese colonial government. |
| Saisiyat (Saysiat) | 賽夏 | Sàixià | 5,311 | 6,495 | Japanese colonial era | One of the 9 tribes originally recognized by the Japanese colonial government. |
| Sakizaya | 撒奇萊雅 | Sāqíláiyǎ | - | 863 | 2007 | Reclassified as Amis during the Japanese colonial era. |
| Seediq | 賽德克 | Sàidékè | - | 9,451 | 2008 | Originally classified as Atayal. |
| Tao (Yami) | 達悟 | Dáwù | 3,872 | 4,494 | Japanese colonial era | One of the 9 tribes originally recognized by the Japanese colonial government. Also known as 雅美 (Yǎmĕi) or 耶美 (Yémĕi). Tribal name means "person." |
| Thao | 邵 | Shào | - | 768 | 2001 | Originally thought to be Plains aborigines living among the Tsou. |
| Truku (Taroko) | 太魯閣 | Tàilǔgé | - | 30,382 | 2004 | Originally classified as Atayal. |
| Tsou (Cou) | 鄒 | Zōu | 6,169 | 6,647 | Japanese colonial era | One of the 9 tribes originally recognized by the Japanese colonial government. |
| Others | 8,249 | 14,206 | Ethnic/tribal grouping not reported (尚未申報) | |||
| Total | 397,535 | 547,465 | ||||
Unrecognized Taiwanese aboriginal tribes may include extinct tribes (mostly Plains aboriginal groups) or tribes currently classified with other groups. There are also 25,943 Aborigines who are currently not classified in any group.
| English name | Chinese name | Pinyin |
|---|---|---|
| Babuza | 巴布薩 | Bābùsà |
| Basay | 巴賽 | Bāsài |
| Hoanya | 洪雅 | Hé'ānyǎ |
| Kaxabu | 噶哈巫 | Géhāwū |
| Ketagalan | 凱達格蘭 | Kǎidágélán |
| Luilang | 雷朗 | Léilǎng |
| Makatao | 馬卡道 | Mǎkǎdào |
| Papora (Papora) | 巴布拉 | Bābùlā |
| Pazeh (Pazih) | 巴宰 (巴澤海) | Bāzǎi (Bāzéhǎi) |
| Qauqaut | 猴猴 | Hóuhóu |
| Saaroa | 沙阿魯阿 | Shāālǔā |
| Siraya | 西拉雅 | Xīlāyǎ |
| Taokas | 道卡斯 | Dàokǎsī |
Foreign residents (excluding those from mainland Mainland China, and those without household registration)

| Nationality / Origin | Total | ||
|---|---|---|---|
| 1 | 220,688 | 34.6% | |
| 2 | 165,849 | 26.0% | |
| 3 | 122,063 | 19.1% | |
| 4 | 65,194 | 10.2% | |
| 5 | 17,626 | 2.76% | |
| 6 | 12,728 | 2.00% | |
| 7 | 9,203 | 1.44% | |
| 8 | 3,840 | 0.60% | |
| 9 | 2,569 | 0.40% | |
| 10 | 2,068 | 0.32% | |
| 11 | 1,602 | 0.25% | |
| 12 | 1,354 | 0.21% | |
| 13 | 1,202 | 0.19% | |
| 14 | 1,120 | 0.18% | |
| 15 | 926 | 0.15% | |
| 16 | 782 | 0.12% | |
| 17 | 776 | 0.12% | |
| 18 | 613 | 0.10% | |
| 19 | 440 | 0.07% | |
| 20 | 358 | 0.06% | |
| 21 | 312 | 0.05% | |
| 22 | 294 | 0.05% | |
| 23 | 220 | 0.03% | |
| 24 | 216 | 0.03% | |
| 24 | 216 | 0.03% | |
| 25 | 214 | 0.03% | |
| 26 | 203 | 0.03% | |
| 27 | 201 | 0.03% | |
| 28 | 188 | 0.03% | |
| 29 | 158 | 0.02% | |
| 29 | 158 | 0.02% | |
| 30 | 151 | 0.02% | |
| 31 | 149 | 0.02% | |
| 32 | 141 | 0.02% | |
| 33 | 135 | 0.02% | |
| 34 | 132 | 0.02% | |
| 35 | 127 | 0.02% | |
| 36 | 125 | 0.02% | |
| 37 | 124 | 0.02% | |
| 38 | 120 | 0.02% | |
| 39 | 115 | 0.02% | |
| 40 | 110 | 0.02% | |
| 41 | 105 | 0.02% | |
| 42 | 101 | 0.02% | |
| 43 | 100 | 0.02% | |
| 43 | 100 | 0.02% | |
| 44 | 99 | 0.02% | |
| 45 | 88 | ||
| 46 | 87 | ||
| 47 | 86 | ||
| 48 | 85 | ||
| 49 | 79 | ||
| 49 | 79 | ||
| 50 | 77 | ||
| 52 | 74 | ||
| 53 | 73 | ||
| 54 | 68 | ||
| 55 | 65 | ||
| 55 | 65 | ||
| 56 | 64 | ||
| 57 | 61 | ||
| 58 | 59 | ||
| 59 | 56 | ||
| 60 | 53 | ||
| 61 | 51 | ||
| 62 | 50 | ||
| 62 | 50 | ||
| 63 | 49 | ||
| 64 | 46 | ||
| 64 | 46 | ||
| 65 | 43 | ||
| 65 | 43 | ||
| 66 | 40 | ||
| 67 | 38 | ||
| 68 | 37 | ||
| 68 | 37 | ||
| 69 | 36 | ||
| 70 | 35 | ||
| 71 | 33 | ||
| 72 | 30 | ||
| 73 | 29 | ||
| 74 | 28 | ||
| 75 | 26 | ||
| 76 | 25 | ||
| 77 | 24 | ||
| 78 | 23 | ||
| 79 | 22 | ||
| 79 | 22 | ||
| 80 | 20 | ||
| 81 | 19 | ||
| 81 | 19 | ||
| 81 | 19 | ||
| 82 | 18 | ||
| 83 | 17 | ||
| 84 | 16 | ||
| 84 | 16 | ||
| 84 | 16 | ||
| 85 | 15 | ||
| 85 | 15 | ||
| 86 | 13 | ||
| 86 | 13 | ||
| 87 | 12 | ||
| 87 | 12 | ||
| 87 | 12 | ||
| 88 | 11 | ||
| 89 | 10 | ||
| 89 | 10 | ||
| 89 | 10 | ||
| 90 | 8 | ||
| 91 | 7 | ||
| 91 | 7 | ||
| 91 | 7 | ||
| 92 | 6 | ||
| 92 | 6 | ||
| 92 | 6 | ||
| 92 | 6 | ||
| 92 | 6 | ||
| 92 | 6 | ||
| 92 | 6 | ||
| 92 | 6 | ||
| 93 | 5 | ||
| 93 | 5 | ||
| 93 | 5 | ||
| 94 | 4 | ||
| 94 | 4 | ||
| 94 | 4 | ||
| 94 | 4 | ||
| 94 | 4 | ||
| 94 | 4 | ||
| 94 | 4 | ||
| 93 | 3 | ||
| 93 | 3 | ||
| 93 | 3 | ||
| 93 | 3 | ||
| 93 | 3 | ||
| 93 | 3 | ||
| 93 | 3 | ||
| 93 | 3 | ||
| 93 | 3 | ||
| 93 | 3 | ||
| 93 | 3 | ||
| 94 | 2 | ||
| 94 | 2 | ||
| 94 | 2 | ||
| 94 | 2 | ||
| 94 | 2 | ||
| 94 | 2 | ||
| 95 | 1 | ||
| 95 | 1 | ||
| 95 | 1 | ||
| 95 | 1 | ||
| 95 | 1 | ||
| 95 | 1 | ||
| 95 | 1 | ||
| 95 | 1 | ||
| 95 | 1 | ||
| 95 | 1 | ||
| 95 | 1 | ||
| 95 | 1 | ||
| 95 | 1 | ||
| 95 | 1 | ||
| 95 | 1 | ||
| 95 | 1 | ||
| 95 | 1 | ||
| 95 | 1 | ||
| 95 | 1 | ||
| - | Other (stateless) | 108 | <0.2% |
| Total | 637,843 | 100.0% | |
| |||
There are also people from mainland China, Hong Kong and Macao, and nationals without household registration in Taiwan.
| People | Temporary residency | Permanent residency |
|---|---|---|
| 241,455 | 128,744 | |
| 34,241 | 21,218 | |
| Nationals without household registration | 136,846 | 204,808 |
| ||
Languages
Almost everyone in Taiwan born after the early 1950s can speak Mandarin, which has been the official language and the medium of instruction in the schools for more than four decades. The Mandarin spoken in Taiwan has minor differences from that spoken in mainland China, South-east Asia and other regions of the world.
The majority speak a dialect Taiwanese which had formerly been the most commonly spoken language. The ethnic Hakka have a distinct Hakka dialect. Between 1900 and 1945 Japanese was the medium of instruction and could be fluently spoken by many of those educated during that period. Chinese romanisation in Taiwan uses both Hanyu pinyin which has been officially adopted by the central government, and Tongyong pinyin which some localities use. Wade-Giles, used traditionally, is also found.
On Kinmen (Quemoy), the language spoken is also Southern Min, although on Wuqiu island, a form of Puxian Min is spoken. On the Matsu Islands, the Fuzhou dialect, an Eastern Min dialect, is spoken.
The most widely spoken Taiwanese aboriginal languages today are Amis, Atayal, Bunun, and Paiwan.
Religion


Article 13 of the Constitution of the Republic of China guarantees freedom of religion as a right of all its citizens. As of 2013, the Republic of China government recognizes 27 religions which are registered with the Civil Affairs Department of the Ministry of the Interior (MOI).[22]
Statistics on registered religions (2005)
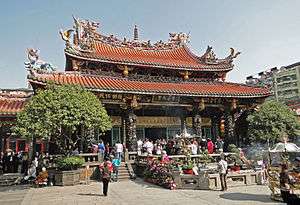
About 81.3% of the population can be considered religious believers, most of whom identify themselves as Buddhists or Taoists. At the same time there is a strong belief in folk religion. These are not considered mutually exclusive, and many people practice a combination of the three. Confucianism also is an honored school of thought and ethical codes. Christian churches have been active in Taiwan for many centuries, a majority of which are Protestant, with Presbyterians playing a particularly significant role. The ROC government has diplomatic relations with the Holy See, which is the only European nation to formally recognize the ROC and is the ROC's longest lasting diplomatic ally, having established relations in 1942. Islam is a static religion but has seen a surge in recent years as a result of foreign Muslims seeking work in Taiwan, most notably from Indonesia. There is also a small group of Shinto followers under the Tenrikyo sect which began in the 1970s.
The table shows official statistics on religion issued by the Department of Civil Affairs, Ministry of the Interior ("MOI"), in 2005. The ROC government recognizes 26 religions in Taiwan.[23] The statistics are reported by the various religious organizations to the MOI:[23][24]
| Religion | Members | % of total population | Temples & churches |
|---|---|---|---|
| Buddhism (佛教) (including Tantric Buddhism) | 8,086,000 | 35.1% | 4,006 |
| Taoism (道教) | 7,600,000 | 33.0% | 18,274 |
| Yiguandao (一貫道) | 810,000 | 3.5% | 3,260 |
| Protestantism (基督新教) | 605,000 | 2.6% | 3,609 |
| Roman Catholic (羅馬天主教) | 298,000 | 1.3% | 1,151 |
| Tiandi teaching (天帝教) | 298,000 | 1.3% | 50 |
| Miledadao (彌勒大道) | 250,000 | 1.1% | 2,200 |
| Tiande teaching (天德教) | 200,000 | 0.9% | 14 |
| Zailiism/Liism (理教) | 186,000 | 0.8% | 138 |
| Xuanyuanism (軒轅教) | 152,700 | 0.7% | 22 |
| Islam (伊斯蘭教) | 58,000 | 0.3% | 7 |
| Mormonism (耶穌基督後期聖徒教會) | 51,090 | 0.2% | 54 |
| Tenriism (天理教) | 35,000 | 0.2% | 153 |
| Maitreya King of the Universe (宇宙彌勒皇教) | 35,000 | 0.2% | 12 |
| Haizidao (亥子道) | 30,000 | 0.1% | 55 |
| Scientology (山達基教會) | 20,000 | < 0.1% | 7 |
| Bahá'í Faith (巴哈伊教) | 16,000 | < 0.1% | 13 |
| Jehovah's Witnesses (耶和華見證人) | 6,223 | < 0.1% | 85 |
| True School of the Mysterious Door (玄門真宗) | 5,000 | < 0.1% | 5 |
| Chinese Holy Church (中華聖教) | 3,200 | < 0.1% | 7 |
| Mahikari (真光教團) | 1,000 | < 0.1% | 9 |
| Salvationism of the Ancient Heaven (先天救教) | 1,000 | < 0.1% | 6 |
| Huang Zhong (黃中) | 1,000 | < 0.1% | 1 |
| Dayi teaching (大易教) | 1,000 | < 0.1% | 1 |
| Total religious population | 18,724,823 | 81.3% | 33,223 |
| Total population | 23,036,087 | 100% | - |
The figures for The Church of Jesus Christ of Latter-day Saints are not from the MOI rather they are based on self reported data from LDS Newsroom.[25]
The figures for Jehovah's Witnesses are not from the MOI rather they are based on the Witnesses own 2007 Service Year Report.[26]
Vital statistics
Births and deaths[27][28]
| Average population (x 1000) | Live births | Deaths | Natural change | CBR* | CDR* | NC* | TFR* | |
|---|---|---|---|---|---|---|---|---|
| 1906 | 3 060 | 119 107 | 102 000 | 16 000 | 38.6 | 33.4 | 5.2 | 6.13 |
| 1907 | 3 090 | 121 756 | 100 000 | 21 000 | 39.1 | 32.4 | 6.7 | 6.16 |
| 1908 | 3 120 | 119 800 | 100 000 | 19 000 | 38.2 | 31.9 | 6.3 | 6.14 |
| 1909 | 3 160 | 127 286 | 98 000 | 29 000 | 40.2 | 31.1 | 9.1 | 6.29 |
| 1910 | 3 210 | 132 141 | 88 000 | 45 000 | 41.3 | 27.5 | 13.8 | 6.37 |
| 1911 | 3 270 | 135 658 | 86 000 | 51 000 | 41.8 | 26.2 | 15.6 | 6.42 |
| 1912 | 3 330 | 136 622 | 83 000 | 55 000 | 41.3 | 25.0 | 16.3 | 6.46 |
| 1913 | 3 390 | 136 967 | 85 000 | 53 000 | 40.8 | 25.0 | 15.8 | 6.45 |
| 1914 | 3 440 | 141 450 | 95 000 | 47 000 | 41.4 | 27.6 | 13.8 | 6.62 |
| 1915 | 3 480 | 137 669 | 110 000 | 29 000 | 40.0 | 31.5 | 8.5 | 6.45 |
| 1916 | 3 510 | 128 605 | 100 000 | 31 000 | 37.3 | 28.6 | 8.7 | |
| 1917 | 3 560 | 142 414 | 96 000 | 50 000 | 40.9 | 27.0 | 13.9 | |
| 1918 | 3 590 | 139 465 | 122 000 | 21 000 | 39.7 | 34.1 | 5.6 | |
| 1919 | 3 630 | 136 707 | 97 000 | 43 000 | 38.5 | 26.8 | 11.7 | |
| 1920 | 3 655 | 141 313 | 117 000 | 27 000 | 39.5 | 32.1 | 7.4 | 6.48 |
| 1921 | 3 720 | 155 159 | 90 000 | 69 000 | 42.8 | 24.2 | 18.6 | |
| 1922 | 3 790 | 154 531 | 93 000 | 65 000 | 41.8 | 24.6 | 17.2 | |
| 1923 | 3 860 | 146 984 | 82 000 | 69 000 | 39.1 | 21.3 | 17.8 | |
| 1924 | 3 930 | 158 688 | 96 000 | 67 000 | 41.4 | 24.5 | 16.9 | |
| 1925 | 3 993 | 159 423 | 95 000 | 68 000 | 40.8 | 23.9 | 16.9 | |
| 1926 | 4 100 | 175 802 | 92 000 | 87 000 | 43.7 | 22.4 | 21.3 | |
| 1927 | 4 210 | 177 422 | 93 000 | 89 000 | 43.2 | 22.1 | 21.1 | |
| 1928 | 4 330 | 183 699 | 95 000 | 94 000 | 43.7 | 22.0 | 21.7 | |
| 1929 | 4 460 | 190 031 | 96 000 | 100 000 | 44.0 | 21.6 | 22.4 | |
| 1930 | 4 593 | 198 186 | 89 000 | 117 000 | 44.8 | 19.4 | 25.4 | 7.02 |
| 1931 | 4 710 | 208 137 | 100 000 | 116 000 | 45.8 | 21.3 | 24.5 | |
| 1932 | 4 867 | 204 913 | 99 000 | 115 000 | 44.0 | 20.4 | 23.6 | |
| 1933 | 4 995 | 211 737 | 98 000 | 123 000 | 44.3 | 19.7 | 24.6 | |
| 1934 | 5 128 | 219 189 | 105 166 | 123 510 | 44.6 | 20.5 | 24.1 | |
| 1935 | 5 255 | 225 980 | 106 905 | 129 040 | 44.9 | 20.3 | 24.6 | |
| 1936 | 5 384 | 223 961 | 106 332 | 127 725 | 43.5 | 19.8 | 23.7 | |
| 1937 | 5 530 | 237 090 | 109 096 | 138 570 | 44.8 | 19.7 | 25.1 | |
| 1938 | 5 678 | 235 821 | 111 723 | 133 117 | 43.1 | 19.7 | 23.4 | |
| 1939 | 5 821 | 244 707 | 115 044 | 139 119 | 43.7 | 19.8 | 23.9 | |
| 1940 | 5 987 | 246 691 | 116 239 | 141 232 | 43.0 | 19.4 | 23.6 | 6.11 |
| 1941 | 6 163 | 241 894 | 99 858 | 153 447 | 41.1 | 16.2 | 24.9 | 5.98 |
| 1942 | 6 339 | 242 796 | 112 161 | 143 243 | 40.3 | 17.7 | 22.6 | 5.93 |
| 1943 | 6 507 | 247 427 | 122 001 | 138 662 | 40.0 | 18.8 | 21.2 | |
| 1944 | ||||||||
| 1945 | ||||||||
| 1946 | ||||||||
| 1947 | 6 294 | 241 071 | 114 000 | 127 000 | 38.3 | 18.1 | 20.2 | |
| 1948 | 6 648 | 264 000 | 95 000 | 169 000 | 39.7 | 14.3 | 25.4 | 5.98 |
| 1949 | 7 099 | 300 843 | 93 000 | 208 000 | 42.4 | 13.1 | 29.3 | 6.49 |
| 1950 | 7 468 | 323 643 | 86 000 | 238 000 | 43.4 | 11.5 | 31.9 | 7.14 |
| 1951 | 7 695 | 385 383 | 89 000 | 296 000 | 50.0 | 11.6 | 38.5 | 7.59 |
| 1952 | 8 000 | 372 905 | 79 000 | 294 000 | 46.6 | 9.9 | 36.8 | 7.56 |
| 1953 | 8 297 | 374 536 | 78 000 | 297 000 | 45.2 | 9.4 | 35.8 | 7.54 |
| 1954 | 8 617 | 383 574 | 71 000 | 313 000 | 44.6 | 8.2 | 36.3 | 7.25 |
| 1955 | 8 924 | 403 683 | 77 000 | 327 000 | 45.3 | 8.6 | 36.6 | 7.32 |
| 1956 | 9 242 | 414 036 | 74 000 | 340 000 | 44.8 | 8.0 | 36.8 | 7.27 |
| 1957 | 9 539 | 394 870 | 81 000 | 314 000 | 41.4 | 8.5 | 32.9 | 6.83 |
| 1958 | 9 858 | 410 885 | 75 000 | 336 000 | 41.7 | 7.6 | 34.1 | 6.48 |
| 1959 | 10 227 | 421 458 | 74 000 | 347 000 | 41.2 | 7.2 | 33.9 | 5.98 |
| 1960 | 10 602 | 419 442 | 74 000 | 345 000 | 39.5 | 7.0 | 32.5 | 5.75 |
| 1961 | 10 983 | 420 254 | 74 000 | 346 254 | 38.3 | 6.7 | 31.5 | 5.58 |
| 1962 | 11 312 | 423 469 | 72 000 | 351 469 | 37.4 | 6.4 | 31.1 | 5.46 |
| 1963 | 11 680 | 424 250 | 71 000 | 353 250 | 36.3 | 6.1 | 30.2 | 5.35 |
| 1964 | 12 088 | 416 926 | 69 000 | 347 926 | 34.5 | 5.7 | 28.8 | 5.10 |
| 1965 | 12 442 | 406 604 | 67 887 | 338 717 | 32.7 | 5.5 | 27.2 | 4.82 |
| 1966 | 12 812 | 415 108 | 69 778 | 345 330 | 32.4 | 5.4 | 27.0 | 4.95 |
| 1967 | 13 147 | 374 282 | 71 861 | 302 421 | 28.5 | 5.5 | 23.0 | 4.22 |
| 1968 | 13 474 | 394 260 | 73 650 | 320 610 | 29.3 | 5.5 | 23.8 | 4.36 |
| 1969 | 13 995 | 390 728 | 70 549 | 320 179 | 27.9 | 5.0 | 22.9 | 4.14 |
| 1970 | 14 507 | 394 015 | 71 135 | 322 883 | 27.2 | 4.9 | 22.3 | 4.00 |
| 1971 | 14 837 | 380 424 | 70 954 | 309 470 | 25.6 | 4.8 | 20.9 | 3.70 |
| 1972 | 15 145 | 365 749 | 71 486 | 294 263 | 24.1 | 4.7 | 19.4 | 3.36 |
| 1973 | 15 424 | 366 942 | 73 477 | 293 465 | 23.8 | 4.8 | 19.0 | 3.21 |
| 1974 | 15 699 | 355 933 | 74 760 | 293 063 | 23.4 | 4.8 | 18.7 | 2.94 |
| 1975 | 15 999 | 357 653 | 75 061 | 292 586 | 23.0 | 4.7 | 18.3 | 2.76 |
| 1976 | 16 298 | 424 075 | 77 000 | 347 075 | 26.0 | 4.7 | 21.3 | 3.08 |
| 1977 | 16 601 | 393 633 | 79 000 | 316 796 | 23.7 | 4.8 | 19.1 | 2.64 |
| 1978 | 16 951 | 411 637 | 79 000 | 330 203 | 24.3 | 4.7 | 19.5 | 2.71 |
| 1979 | 17 337 | 421 720 | 82 000 | 340 518 | 24.3 | 4.7 | 19.6 | 2.67 |
| 1980 | 17 608 | 413 881 | 84 333 | 329 548 | 23.5 | 4.8 | 18.7 | 2.51 |
| 1981 | 17 972 | 414 069 | 87 192 | 326 877 | 23.0 | 4.9 | 18.2 | 2.45 |
| 1982 | 18 261 | 405 263 | 87 578 | 317 685 | 22.2 | 4.8 | 17.4 | 2.32 |
| 1983 | 18 538 | 383 439 | 90 951 | 292 488 | 20.7 | 4.9 | 15.8 | 2.17 |
| 1984 | 18 873 | 371 008 | 89 915 | 281 093 | 19.7 | 4.8 | 14.9 | 2.05 |
| 1985 | 19 135 | 346 208 | 92 348 | 253 860 | 18.1 | 4.8 | 13.3 | 1.88 |
| 1986 | 19 356 | 309 230 | 95 057 | 214 173 | 16.0 | 4.9 | 11.1 | 1.68 |
| 1987 | 19 564 | 314 024 | 96 319 | 217 705 | 16.1 | 4.9 | 11.1 | 1.70 |
| 1988 | 19 788 | 342 031 | 102 113 | 239 918 | 17.3 | 5.2 | 12.1 | 1.86 |
| 1989 | 20 004 | 315 299 | 103 288 | 212 011 | 15.8 | 5.2 | 10.6 | 1.68 |
| 1990 | 20 230 | 335 618 | 105 669 | 229 949 | 16.6 | 5.2 | 11.4 | 1.81 |
| 1991 | 20 455 | 321 932 | 106 284 | 215 648 | 15.7 | 5.2 | 10.5 | 1.72 |
| 1992 | 20 655 | 321 632 | 110 516 | 211 116 | 15.6 | 5.4 | 10.2 | 1.73 |
| 1993 | 20 848 | 325 613 | 110 901 | 214 712 | 15.6 | 5.3 | 10.3 | 1.76 |
| 1994 | 21 087 | 322 938 | 113 866 | 209 072 | 15.3 | 5.4 | 9.9 | 1.76 |
| 1995 | 21 268 | 329 581 | 119 112 | 210 469 | 15.5 | 5.6 | 9.9 | 1.78 |
| 1996 | 21 441 | 325 545 | 122 489 | 203 056 | 15.2 | 5.7 | 9.5 | 1.76 |
| 1997 | 21 634 | 326 002 | 121 000 | 205 002 | 15.1 | 5.6 | 9.5 | 1.77 |
| 1998 | 21 836 | 271 450 | 123 180 | 148 270 | 12.4 | 5.6 | 6.8 | 1.47 |
| 1999 | 22 011 | 283 661 | 126 113 | 157 548 | 12.9 | 5.7 | 7.2 | 1.56 |
| 2000 | 22 185 | 305 312 | 125 957 | 179 355 | 13.8 | 5.7 | 8.1 | 1.68 |
| 2001 | 22 342 | 260 354 | 127 647 | 132 707 | 11.7 | 5.7 | 5.9 | 1.40 |
| 2002 | 22 464 | 247 530 | 128 636 | 118 894 | 11.0 | 5.7 | 5.3 | 1.34 |
| 2003 | 22 554 | 227 070 | 130 801 | 96 269 | 10.1 | 5.8 | 4.3 | 1.24 |
| 2004 | 22 647 | 216 419 | 135 092 | 81 327 | 9.6 | 6.0 | 3.6 | 1.18 |
| 2005 | 22 730 | 205 854 | 139 398 | 66 456 | 9.1 | 6.1 | 2.9 | 1.12 |
| 2006 | 22 824 | 204 459 | 135 839 | 68 620 | 9.0 | 6.0 | 3.0 | 1.12 |
| 2007 | 22 918 | 204 414 | 141 111 | 63 303 | 8.9 | 6.2 | 2.8 | 1.10 |
| 2008 | 22 998 | 198 733 | 143 624 | 55 109 | 8.6 | 6.2 | 2.4 | 1.05 |
| 2009 | 23 079 | 191 310 | 143 582 | 47 728 | 8.3 | 6.2 | 2.1 | 1.03 |
| 2010 | 23 141 | 166 886 | 145 772 | 21 114 | 7.2 | 6.3 | 0.9 | 0.90 |
| 2011 | 23 194 | 196 627 | 152 915 | 43 712 | 8.5 | 6.6 | 1.9 | 1.07 |
| 2012 | 23 271 | 229 481 | 154 251 | 75 230 | 9.9 | 6.6 | 3.2 | 1.27 |
| 2013 | 23 345 | 199 113 | 155 908 | 43 205 | 8.5 | 6.7 | 1.8 | 1.07 |
| 2014 | 23 434 | 210 383 | 163 929 | 46 454 | 9.0 | 7,0 | 2.0 | 1.17 |
| 2015 | 23 472 | 213 598 | 163 858 | 49 740 | 9.10 | 6.98 | 2.12 | 1.18 |
| * CBR=crude birth rate (per 1000); CDR=crude deathrate (per 1000); NC=natural change (per 1000); TFR=total fertility rate | ||||||||
Fertility rate[29][30]
The fertility rate of Taiwan is one of the lowest fertility rates ever recorded in the world in historical times. It reached its lowest level in 2010: 0.90 children per female. In 1980, the rate was still well above replacement level (2.515), but it dropped to 1.88 in 1985, 1.81 in 1990, 1.78 in 1995, 1.68 in 2000, 1.12 in 2005.
Infant mortality rate
- total: 6.29 deaths/1,000 live births
- male: 6.97 deaths/1,000 live births
- female: 5.55 deaths/1,000 live births (2006 est.)
Life expectancy at birth
Taiwan is ranked 39th in the world for highest life expectancy at birth.
| Gender | Life expectancy in 2009[31] |
|---|---|
| Male | 75.88 years |
| Female | 82.46 years |
HIV/AIDS
The first reported case of HIV/AIDS was recorded in December 1984 and the first local infection recorded in February 1986. As of May 2006, there were 11,486 recorded cases of HIV of which 2,631 were confirmed with AIDS. There were 1,425 deaths leaving 10,029 people living with HIV/AIDS. This is less than 0.05% of the total population of Taiwan. Statistics by the Center for Disease Control show that the gender distribution of infected person was 90% male and 10% female.
| Data | Population |
|---|---|
| Adult prevalence | 11,486 |
| People living with HIV/AIDS | 10,029 |
| Deaths | 1,425 |
- Source: Center for Disease Control (CDC), Republic of China - May 2006 est.(PDF file) (Chinese)
Military manpower
The Republic of China has a compulsory military draft for males aged 19–35 years of age with a service obligation of 12 months in 2008.
Available manpower
Defined as 19–49 years of age.
| Gender | Population |
|---|---|
| Male | 5,883,828 |
| Female | 5,680,773 |
| Total | 11,564,601 |
Fit for military service
Of the available manpower, the following are fit for military service. Defined as 19–49 years of age.
| Gender | Population |
|---|---|
| Male | 4,749,537 |
| Female | 4,644,607 |
| Total | 9,394,144 |
Education
Taiwan has a nine-year compulsory education program initiated by the Ministry of Education in 1968. This consists of six years in elementary education and three years in junior high education. About 94.7% of junior high graduates continue their studies in either a senior high or vocational school . Reflecting a strong commitment to education, in FY 2001 16% of the ROC budget was allocated for education . The enrollment rate was 96.77% for the school year 2004-2005.[32] For the school year 2005-2006, there were 5,283,855 students in both public and private schools, about a quarter of the entire population. The literacy rate is above 95%.
Taiwan has an extensive higher education system with more than 100 institutions of higher learning. Each year over 100,000 students take the joint college entrance exam; about 66.6% of the candidates are admitted to a college or university. Opportunities for graduate education are expanding in Taiwan, but many students travel abroad for advanced education, including 13,000 who study in the United States annually .
Since the mid-1990s, the government has introduced several education reforms in a bid to further improve education standards such as the replacement in 2002 of the 48-year-long Joint University Entrance Examination (JUEE; 大學聯考; Dàxué liánkǎo) which had been set up in 1954.
Distribution of students
| Sector | Education | Years of study | Typical Age range | Students | Distribution |
|---|---|---|---|---|---|
| Pre-school | Kindergarten | (2 years) | 4–6 years old | 224,220 | 4.2% |
| Compulsory | Elementary | 6 years | 6–12 years old | 1,831,913 | 34.7% |
| Junior High | 3 years | 12–15 years old | 951,236 | 18% | |
| Senior Secondary | Senior High | 3 years | 15–18 years old | 420,608 | 8% |
| Senior Vocation | 3 years | 15–18 years old | 331,604 | 6.3% | |
| Higher Education | Junior College | 2–5 years | 15–20 years old | 37,068 | 0.7% |
| University & College | 4–7 years (up to 13 years) |
18–25 years old (up to 31 years old) |
1,259,490 | 23.8% | |
| Other | Special School | up to 14 years | 4–18 years old | 6,361 | 0.1% |
| Supplementary School | n/a | n/a | 200,573 | 3.8% | |
| Open University | n/a | n/a | 20,782 | 0.4% | |
| Total | 5,283,855 | 100% |
- Source: Number of students at each level (SY 2005-2006), Ministry of Education, Republic of China.
Literacy
Definition of literacy is those aged 15 and over who can read and write.
| Gender | Population |
|---|---|
| Male | 99.6% |
| Female | 96.8% |
| Total | 98.2% |
"International Comparison of Education Statistical Indicators - 2012 Edition", Ministry of Education, 2012. pp. 17. Retrieved on 2012-10-05. (Table 1-2-5. Literacy Rate for Age 15 Plus by Gender).
2.02 Population of 15 Years and Over by Educational Attainment, Statistical Yearbook of Interior, Ministry of the Interior, Republic of China (Taiwan). 2012. Retrieved on 10-05-2012.
References
- ↑ Trejaut, Jean; Toomas Kivisild; Jun Hun Loo; Chien Liang Lee; Chun Lin He; Chia Jung Hsu; Zheng Yuan Li; Marie Lin (August 2005). "Traces of Archaic Mitochondrial Lineages Persist in Austronesian-Speaking Formosan Populations". PLoS Biology. 3 (8): e247. doi:10.1371/journal.pbio.0030247. PMC 1166350
 . PMID 15984912.
 - ↑ Exec. Yuan (2014), p. 36,48.
- 1 2 3 4 Exec. Yuan (2014), p. 48.
- 1 2 3 "Taiwan". The World Factbook. Central Intelligence Agency., United States Central Intelligence Agency
- ↑ Note: Some official government statistics for the period, including those reported on this page, may not be consistent with the known or recorded size of the KMT influx.
- ↑ Exec. Yuan (2014), p. 51.
- ↑ Davidson (1903), p. 13.
- ↑ Lin, A.; Keating, J. (2008). Island in the Stream : a quick case study of Taiwan's complex history (4th ed.). Taipei: SMC Pub. ISBN 9789576387050.
- ↑ Davidson (1903), p. 561.
- ↑ Davidson (1903), p. 563.
- ↑ Exec. Yuan (2014), p. 36.
- ↑ Davidson (1903), p. 590.
- ↑ categorized as originating from Xiamen, Quanzhou, Zhangzhou, and Zhangpu. Davidson (1903), p. 591
- ↑ Davidson (1903), p. 581.
- ↑ Davidson (1903), pp. 590-1.
- ↑ Exec. Yuan (2014), p. 49.
- ↑ http://www.chinapost.com.tw/taiwan/national/national-news/2014/06/27/411066/Govt-officially.htm
- ↑ Directorate General of Budget, Accounting and Statistics, Executive Yuan, R.O.C. (DGBAS). National Statistics, Republic of China (Taiwan). Preliminary statistical analysis report of 2000 Population and Housing Census. Excerpted from Table 28:Indigenous population distribution in Taiwan-Fukien Area. Accessed PM 8/30/06
- ↑ Council of Indigenous Peoples (首頁>本會資訊>主動公開資訊>統計資料>原住民人口數統計資料)(Accessed 07 Mar 2016)
- ↑ "Foreign Residents-by Nationality". National Immigration Agency, Ministry of the Interior. 2015-06-29. Retrieved 2015-07-07.
- ↑ 外僑居留-按國籍別 (Excel) (in Chinese). National Immigration Agency, Ministry of the Interior. 2011-02-28. Retrieved 2013-05-21.
- ↑ Exec. Yuan (2014), p. 272.
- 1 2 "Taiwan Yearbook 2006". Government of Information Office. 2006. Archived from the original on 2007-07-08. Retrieved 2007-09-01.
- ↑ "2006 Report on International Religious Freedom". U.S. Department of State. 2006. Retrieved 2007-09-01.
- ↑ "The Church of Jesus Christ of Latter-day Saints: Taiwan Country Profile".
- ↑ "Jehovah's Witnesses: Interactive Map of the Worldwide Work".
- ↑ B.R. Mitchell. International historical statistics: Africa, Asia & Oceania 1750-2000.
- ↑ National Statistics Republic of China (Taiwan)
- ↑
- ↑
- ↑
- ↑ "Taiwan Yearbook 2005 - Education". Government Information Office, Republic of China.
Bibliography
- Brown, Melissa J (2004). Is Taiwan Chinese? : The Impact of Culture, Power and Migration on Changing Identities. Berkeley: University of California Press. ISBN 0-520-23182-1.
- Davidson, James W. (1903). The Island of Formosa, Past and Present : history, people, resources, and commercial prospects : tea, camphor, sugar, gold, coal, sulphur, economical plants, and other productions. London and New York: Macmillan. OCLC 1887893. OL 6931635M.
- The Republic of China Yearbook 2014 (PDF). Executive Yuan, R.O.C. 2014. ISBN 9789860423020. Retrieved 2016-06-11.
Taiwan articles | |||||||||||||||||
|---|---|---|---|---|---|---|---|---|---|---|---|---|---|---|---|---|---|
| History |  | ||||||||||||||||
| Geography | |||||||||||||||||
| Politics |
| ||||||||||||||||
| Economy | |||||||||||||||||
| Society |
| ||||||||||||||||
| |||||||||||||||||