Bristol City Council election, 1986
| | |||||||||||||||||||||||||||||||
| |||||||||||||||||||||||||||||||
| |||||||||||||||||||||||||||||||
| |||||||||||||||||||||||||||||||
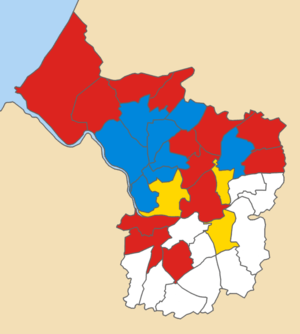
1986 local election results in Bristol
The 1986 Bristol City Council election took place on 8 May 1986 to elect members of Bristol City Council in England. This was on the same day as other local elections. One third of seats in the 1986 Council Elections in the English city of Bristol were up for election. The election in Brislington West was a by-election. There was a small swing away from the Conservatives and Labour regained a majority on the Council, which they kept until 2003.
Ward results
The change is calculated using the 1983 election results.
Ashley
| Party | Candidate | Votes | % | ± | |
|---|---|---|---|---|---|
| Labour | M. Shotter | 2,035 | 60.4 | +8.6 | |
| Conservative | R. Hodges | 546 | 16.2 | -11.2 | |
| Liberal | P. Davies | 493 | 14.6 | +2.6 | |
| Green | D. Bowering | 200 | 5.9 | +1.2 | |
| Revolutionary Communist | J. Walker | 62 | 1.8 | +1.8 | |
| Communist | D. Samson | 33 | 1.0 | -3.1 | |
| Majority | 1,489 | 44.2 | |||
| Labour hold | Swing | +9.9 | |||
Avonmouth
| Party | Candidate | Votes | % | ± | |
|---|---|---|---|---|---|
| Labour | V. Pople | 2,060 | 54.7 | +4.2 | |
| Conservative | D. Pullin | 1,124 | 29.9 | -5.0 | |
| SDP–Liberal Alliance | M. Brown | 525 | 13.9 | -0.7 | |
| Green | R. Stanleigh | 56 | 1.5 | +1.5 | |
| Majority | 936 | 24.9 | |||
| Labour hold | Swing | +4.6 | |||
Bedminster
| Party | Candidate | Votes | % | ± | |
|---|---|---|---|---|---|
| Labour | C. Warren | 1,765 | 42.1 | -0.1 | |
| Conservative | W. Biggs | 1,192 | 28.4 | -17.5 | |
| SDP–Liberal Alliance | J. Osborne | 1,181 | 28.1 | +16.2 | |
| Green | M. Wood | 59 | 1.4 | +1.4 | |
| Majority | 573 | 13.7 | |||
| Labour hold | Swing | +8.7 | |||
Bishopston
| Party | Candidate | Votes | % | ± | |
|---|---|---|---|---|---|
| Labour | H. Bashforth | 1,799 | 32.8 | +1.6 | |
| Conservative | D. Topham | 1,763 | 32.1 | -10.5 | |
| Liberal | P. Nagle | 1,755 | 32.0 | +9.4 | |
| Green | M. Pitt | 174 | 3.2 | -0.5 | |
| Majority | 36 | 0.7 | |||
| Labour gain from Conservative | Swing | +6.1 | |||
Brislington
| Party | Candidate | Votes | % | ± | |
|---|---|---|---|---|---|
| Liberal | M. Langley | 1,801 | 38.0 | +11.5 | |
| Labour | J. Hillier | 1,496 | 31.6 | +3.8 | |
| Conservative | M. Weeks | 1,380 | 29.1 | -16.6 | |
| Green | B. Hussain | 61 | 1.3 | +1.3 | |
| Majority | 305 | 6.4 | |||
| Liberal gain from Conservative | Swing | +14.1 | |||
Cabot
| Party | Candidate | Votes | % | ± | |
|---|---|---|---|---|---|
| Liberal | C. Boney | 1,523 | 43.0 | -0.1 | |
| Labour | J. Williams | 954 | 26.9 | +7.2 | |
| Conservative | R. Hay | 880 | 24.8 | -8.2 | |
| Green | G. Nicholas | 187 | 5.3 | +1.1 | |
| Majority | 569 | 16.1 | |||
| Liberal hold | Swing | -3.7 | |||
Clifton
| Party | Candidate | Votes | % | ± | |
|---|---|---|---|---|---|
| Conservative | D. Rollings | 1,751 | 37.5 | -7.1 | |
| Liberal | P. Goggin | 1,741 | 37.3 | +1.8 | |
| Labour | A. Robinson | 958 | 20.5 | +3.0 | |
| Green | A. Grant | 214 | 4.6 | +4.6 | |
| Majority | 10 | 0.2 | |||
| Conservative hold | Swing | -4.5 | |||
Cotham
| Party | Candidate | Votes | % | ± | |
|---|---|---|---|---|---|
| Conservative | G. Hebblethwaite | 1,480 | 38.4 | -5.1 | |
| Liberal | G. Box | 1,325 | 34.4 | +1.1 | |
| Labour | C. Hackett | 857 | 22.2 | +4.1 | |
| Green | J. Wingfield | 195 | 5.1 | +0.1 | |
| Majority | 155 | 4.0 | |||
| Conservative hold | Swing | -3.1 | |||
Easton
| Party | Candidate | Votes | % | ± | |
|---|---|---|---|---|---|
| Liberal | J. Kiely | 2,032 | 48.4 | -2.1 | |
| Labour | K. Mahoney | 1,721 | 41.0 | +7.4 | |
| Conservative | J. Short | 385 | 9.2 | -4.5 | |
| Green | H. Patrick-Smith | 58 | 1.4 | +1.4 | |
| Majority | 311 | 7.4 | |||
| Liberal hold | Swing | -4.8 | |||
Eastville
| Party | Candidate | Votes | % | ± | |
|---|---|---|---|---|---|
| Conservative | D. Fey | 1,628 | 41.1 | -1.2 | |
| Labour | M. Georghiou | 1,492 | 37.6 | +5.6 | |
| Liberal | E. Beaty | 693 | 17.5 | -6.2 | |
| Green | P. Tonkin | 151 | 3.8 | +1.8 | |
| Majority | 136 | 3.4 | |||
| Conservative hold | Swing | -3.4 | |||
Filwood
| Party | Candidate | Votes | % | ± | |
|---|---|---|---|---|---|
| Labour | A. Hillman | 1,595 | 74.0 | +3.1 | |
| Conservative | T. Wade | 332 | 15.4 | -2.3 | |
| SDP–Liberal Alliance | D. Usher | 188 | 8.7 | -0.1 | |
| Green | S. Price | 41 | 1.9 | +1.9 | |
| Majority | 1,263 | 58.6 | |||
| Labour hold | Swing | +2.7 | |||
Frome Vale
| Party | Candidate | Votes | % | ± | |
|---|---|---|---|---|---|
| Labour | B. Kantor | 2,144 | 45.7 | +6.8 | |
| Conservative | J. Bosdet | 1,732 | 36.9 | -5.0 | |
| SDP–Liberal Alliance | B. Matthews | 737 | 15.7 | -3.5 | |
| Green | C. Kempton | 76 | 1.6 | +1.6 | |
| Majority | 412 | 8.8 | |||
| Labour gain from Conservative | Swing | +5.9 | |||
Henbury
| Party | Candidate | Votes | % | ± | |
|---|---|---|---|---|---|
| Labour | J. Fisk | 2,160 | 47.5 | +2.4 | |
| Conservative | P. Gollop | 1,620 | 35.6 | -6.4 | |
| SDP–Liberal Alliance | P. Barnard | 686 | 15.1 | +2.2 | |
| Green | T. De Teissier-Prevost | 82 | 1.8 | +1.8 | |
| Majority | 540 | 11.9 | |||
| Labour hold | Swing | +4.4 | |||
Henleaze
| Party | Candidate | Votes | % | ± | |
|---|---|---|---|---|---|
| Conservative | G. Browne | 2,565 | 56.9 | -8.9 | |
| SDP–Liberal Alliance | K. Griew | 1,126 | 25.0 | +2.2 | |
| Labour | M. Vokins | 610 | 13.5 | +2.1 | |
| Green | R. Winfield | 207 | 4.6 | +4.6 | |
| Majority | 1,439 | 31.9 | |||
| Conservative hold | Swing | -5.6 | |||
Hillfields
| Party | Candidate | Votes | % | ± | |
|---|---|---|---|---|---|
| Labour | D. Naysmith | 1,885 | 57.8 | +10.1 | |
| Conservative | J. Seville | 794 | 24.4 | -9.9 | |
| Liberal | E. Fletcher | 511 | 15.7 | -2.3 | |
| Green | S. Campbell | 70 | 2.1 | +2.1 | |
| Majority | 1,091 | 33.5 | |||
| Labour hold | Swing | +10.0 | |||
Horfield
| Party | Candidate | Votes | % | ± | |
|---|---|---|---|---|---|
| Conservative | B. Topham | 2,139 | 49.0 | +4.5 | |
| Labour | J. McLaren | 1,360 | 31.1 | +9.0 | |
| Liberal | S. Young | 768 | 17.6 | -14.4 | |
| Green | C. Lloyd | 100 | 2.3 | +0.9 | |
| Majority | 779 | 17.8 | |||
| Conservative hold | Swing | +2.3 | |||
Kingsweston
| Party | Candidate | Votes | % | ± | |
|---|---|---|---|---|---|
| Labour | T.R. Thomas | 1,964 | 44.4 | -1.8 | |
| Conservative | R. Mellor | 1,856 | 42.0 | +2.0 | |
| SDP–Liberal Alliance | P. Cole | 547 | 12.4 | -1.4 | |
| Green | J. Oakes | 55 | 1.2 | +1.2 | |
| Majority | 108 | 2.4 | |||
| Labour hold | Swing | -1.9 | |||
Lawrence Hill
| Party | Candidate | Votes | % | ± | |
|---|---|---|---|---|---|
| Labour | D. Tedder | 2,305 | 71.6 | +5.2 | |
| Conservative | I. Millard | 505 | 15.7 | -1.9 | |
| Liberal | J. Exon | 358 | 11.1 | -4.8 | |
| Green | S. Porter | 53 | 1.6 | +1.6 | |
| Majority | 1,800 | 55.9 | |||
| Labour hold | Swing | +3.6 | |||
Lockleaze
| Party | Candidate | Votes | % | ± | |
|---|---|---|---|---|---|
| Labour | J. Hynes | 1,909 | 55.1 | +6.1 | |
| Conservative | S. Chaplin | 962 | 27.8 | +1.6 | |
| Liberal | F. Young | 534 | 15.4 | -9.4 | |
| Green | K. Woodhouse | 61 | 1.8 | +1.8 | |
| Majority | 947 | 27.3 | |||
| Labour hold | Swing | +2.3 | |||
Redland
| Party | Candidate | Votes | % | ± | |
|---|---|---|---|---|---|
| Conservative | T. Allen | 1,843 | 42.3 | -10.5 | |
| SDP–Liberal Alliance | S. Emmett | 1,267 | 29.1 | +7.5 | |
| Labour | B. Begley | 1,020 | 23.4 | +5.0 | |
| Green | T. Leegwater | 230 | 5.3 | -1.9 | |
| Majority | 576 | 13.2 | |||
| Conservative hold | Swing | -9.0 | |||
Southmead
| Party | Candidate | Votes | % | ± | |
|---|---|---|---|---|---|
| Labour | L. Bromham | 1,819 | 54.5 | +4.5 | |
| Conservative | I. Roberts | 889 | 26.6 | -10.0 | |
| SDP–Liberal Alliance | A. Barnard | 582 | 17.4 | +4.0 | |
| Green | J. Jameson | 48 | 1.4 | +1.4 | |
| Majority | 930 | 27.9 | |||
| Labour hold | Swing | +7.3 | |||
Southville
| Party | Candidate | Votes | % | ± | |
|---|---|---|---|---|---|
| Labour | R. Walton | 2,151 | 56.5 | +10.6 | |
| Conservative | T. Skipp | 1,012 | 26.6 | -7.8 | |
| SDP–Liberal Alliance | G. Wright | 506 | 13.3 | -3.9 | |
| Green | R. Martin | 138 | 3.6 | +1.1 | |
| Majority | 1,139 | 29.9 | |||
| Labour hold | Swing | +9.2 | |||
Stoke Bishop
| Party | Candidate | Votes | % | ± | |
|---|---|---|---|---|---|
| Conservative | P. Abraham | 2,721 | 54.3 | -13.2 | |
| Liberal | D. Jones | 1,587 | 31.7 | +16.3 | |
| Labour | M. Riley | 580 | 11.6 | -1.7 | |
| Green | C. Rose | 123 | 2.5 | -1.4 | |
| Majority | 1,134 | 22.6 | |||
| Conservative hold | Swing | -14.8 | |||
Westbury-on-Trym
| Party | Candidate | Votes | % | ± | |
|---|---|---|---|---|---|
| Conservative | D. Poole | 3,149 | 66.9 | -6.4 | |
| Liberal | A. West | 919 | 19.5 | +4.8 | |
| Labour | W. Payne | 528 | 11.2 | +0.8 | |
| Green | J. Kempton | 112 | 2.4 | +0.9 | |
| Majority | 2,230 | 47.4 | |||
| Conservative hold | Swing | -5.6 | |||
Sources
- Bristol Evening Post 9 May 1986
| London boroughs |
|
|---|---|
| Metropolitan boroughs |
|
| District councils (England) |
|
| Regional councils (Scotland) | |
| LEAs | |
| Bristol City Council | |
|---|---|
| Avon County Council |
|
| |
This article is issued from Wikipedia - version of the 7/31/2016. The text is available under the Creative Commons Attribution/Share Alike but additional terms may apply for the media files.