Bristol City Council election, 1992
| | |||||||||||||||||||||||||||||||
| |||||||||||||||||||||||||||||||
| |||||||||||||||||||||||||||||||
| |||||||||||||||||||||||||||||||
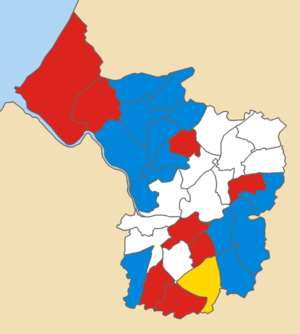
1992 local election results in Bristol
The 1992 Bristol City Council election took place on 7 May 1992 to elect members of Bristol City Council in England. This was on the same day as other local elections. One third of seats were up for election. Two seats were contested in Hartcliffe due to an extra vacancy occurring. The elections were held just weeks after John Major's unexpected 1992 General election victory, and mirroring that result there was a strong swing from Labour to Conservative.
Ward results
The change is calculated using the results when these actual seats were last contested, i.e. the 1988 election.
Avonmouth
| Party | Candidate | Votes | % | ± | |
|---|---|---|---|---|---|
| Labour | P. Gregory | 1,665 | 46.1 | -4.2 | |
| Conservative | N. Tolchard | 1,639 | 45.4 | +1.4 | |
| Liberal Democrat | P. Lloyd | 246 | 6.8 | +2.3 | |
| Green | L. Hersey | 64 | 1.8 | +0.6 | |
| Majority | 26 | 0.7 | |||
| Labour hold | Swing | -2.8 | |||
Bishopston
| Party | Candidate | Votes | % | ± | |
|---|---|---|---|---|---|
| Labour | P. McLaren | 1,648 | 37.9 | -0.1 | |
| Conservative | W. Brown | 1,580 | 36.3 | +1.7 | |
| Liberal Democrat | C. Primett | 949 | 21.8 | -2.9 | |
| Green | J. Quinnell | 175 | 4.0 | +1.3 | |
| Majority | 68 | 1.6 | |||
| Labour hold | Swing | -0.9 | |||
Bishopsworth
| Party | Candidate | Votes | % | ± | |
|---|---|---|---|---|---|
| Conservative | R. Eddy | 1,420 | 49.4 | +8.7 | |
| Labour | J. McLaren | 1,188 | 41.4 | -7.5 | |
| Liberal Democrat | P. Masters | 172 | 6.0 | +2.3 | |
| Green | B. Lewis | 92 | 3.2 | +3.2 | |
| Majority | 232 | 8.1 | |||
| Conservative gain from Labour | Swing | +8.1 | |||
Brislington East
| Party | Candidate | Votes | % | ± | |
|---|---|---|---|---|---|
| Conservative | A. Carey | 1,739 | 47.7 | +9.1 | |
| Labour | G. Townsend | 1,565 | 42.9 | -7.8 | |
| Liberal Democrat | R. Windmill | 258 | 7.0 | -1.8 | |
| Green | G. Davey | 86 | 2.4 | +0.5 | |
| Majority | 174 | 4.8 | |||
| Conservative gain from Labour | Swing | +8.5 | |||
Brislington West
| Party | Candidate | Votes | % | ± | |
|---|---|---|---|---|---|
| Conservative | P. Dodd | 1,409 | 38.3 | +3.5 | |
| Labour | D. Herod | 1,081 | 29.4 | +1.3 | |
| Liberal Democrat | J. Webb | 1,048 | 28.5 | -5.7 | |
| Green | M. Turnbull | 141 | 3.8 | +1.0 | |
| Majority | 328 | 8.9 | |||
| Conservative hold | Swing | +1.1 | |||
Clifton
| Party | Candidate | Votes | % | ± | |
|---|---|---|---|---|---|
| Conservative | A. Tasker | 1,687 | 47.5 | 0.0 | |
| Liberal Democrat | S. Spilsbury | 1,132 | 31.9 | +8.8 | |
| Labour | N. Steven | 511 | 14.4 | -5.9 | |
| Green | N. Campion | 218 | 6.1 | +0.7 | |
| Majority | 555 | 15.6 | |||
| Conservative hold | Swing | -4.4 | |||
Cotham
| Party | Candidate | Votes | % | ± | |
|---|---|---|---|---|---|
| Conservative | A. Orr | 1,523 | 44.3 | -0.4 | |
| Labour | L. Broomhead | 1,019 | 29.6 | -0.3 | |
| Liberal Democrat | M. Bosel | 685 | 19.9 | +5.3 | |
| Green | G. Collard | 211 | 6.1 | -0.8 | |
| Majority | 504 | 14.7 | |||
| Conservative hold | Swing | -0.1 | |||
Hartcliffe
| Party | Candidate | Votes | % | ± | |
|---|---|---|---|---|---|
| Labour | T. Cleverley | 1,191 | 45.6 | -17.1 | |
| Labour | M. Hulin | 907 | |||
| Conservative | P. Eddy | 864 | 33.1 | +4.8 | |
| Liberal Democrat | V. Bartlett | 403 | 15.4 | +8.3 | |
| Liberal Democrat | R. Kirkham | 206 | |||
| Green | C. Bolton | 152 | 5.8 | +4.0 | |
| Majority | 43 | 1.6 | |||
| Labour hold | Swing | -11.0 | |||
Henbury
| Party | Candidate | Votes | % | ± | |
|---|---|---|---|---|---|
| Conservative | D. Miller | 1,904 | 49.2 | +10.0 | |
| Labour | J. Patterson | 1,581 | 40.8 | -10.4 | |
| Liberal Democrat | S. Colclough | 312 | 8.1 | +4.7 | |
| Green | F. Lilley | 74 | 1.9 | +1.9 | |
| Majority | 323 | 8.3 | |||
| Conservative gain from Labour | Swing | +10.2 | |||
Hengrove
| Party | Candidate | Votes | % | ± | |
|---|---|---|---|---|---|
| Liberal Democrat | S. Loader | 1,753 | 43.1 | +9.5 | |
| Conservative | S. Willis | 1,419 | 34.9 | -5.7 | |
| Labour | R. Jones | 859 | 21.1 | -3.3 | |
| Green | C. Presley | 37 | 0.9 | -0.5 | |
| Majority | 334 | 8.2 | |||
| Liberal Democrat hold | Swing | +7.6 | |||
Henleaze
| Party | Candidate | Votes | % | ± | |
|---|---|---|---|---|---|
| Conservative | J. Fey | 2,701 | 66.4 | +1.7 | |
| Liberal Democrat | H. Myers | 713 | 17.5 | -0.1 | |
| Labour | B. Veal | 522 | 12.8 | -1.3 | |
| Green | R. Morrish | 133 | 3.3 | -0.3 | |
| Majority | 1,988 | 48.9 | |||
| Conservative hold | Swing | +0.9 | |||
Horfield
| Party | Candidate | Votes | % | ± | |
|---|---|---|---|---|---|
| Conservative | B. Topham | 2,137 | 54.9 | +2.8 | |
| Labour | R. Pyle | 1,321 | 34.0 | -4.6 | |
| Liberal Democrat | J. Grace | 383 | 9.8 | +0.6 | |
| Green | J. Duggan | 49 | 1.3 | +1.3 | |
| Majority | 816 | 21.0 | |||
| Conservative hold | Swing | +3.7 | |||
Kingsweston
| Party | Candidate | Votes | % | ± | |
|---|---|---|---|---|---|
| Labour | J. Bees | 1,649 | 46.9 | -5.4 | |
| Conservative | J. Veale | 1,505 | 42.8 | +2.2 | |
| Liberal Democrat | R. Parsons | 311 | 8.8 | +1.7 | |
| Green | T. Coates | 53 | 1.5 | +1.5 | |
| Majority | 144 | 4.1 | |||
| Labour hold | Swing | -3.8 | |||
Knowle
| Party | Candidate | Votes | % | ± | |
|---|---|---|---|---|---|
| Labour | P. Roberts | 1,104 | 43.5 | -12.1 | |
| Conservative | T. Skipp | 1,048 | 41.3 | +5.8 | |
| Liberal Democrat | D. Gammon | 325 | 12.8 | +5.8 | |
| Green | R. Martin | 60 | 2.4 | +0.5 | |
| Majority | 56 | 2.2 | |||
| Labour hold | Swing | -9.0 | |||
Redland
| Party | Candidate | Votes | % | ± | |
|---|---|---|---|---|---|
| Conservative | M. Casewell | 1,815 | 41.4 | -5.5 | |
| Labour | J. Ashton | 1,333 | 30.4 | +1.2 | |
| Liberal Democrat | S. Williams | 1,111 | 25.4 | +7.8 | |
| Green | D. Simpson | 121 | 2.8 | -3.5 | |
| Majority | 482 | 11.0 | |||
| Conservative hold | Swing | -3.4 | |||
Southmead
| Party | Candidate | Votes | % | ± | |
|---|---|---|---|---|---|
| Conservative | M. Kerry | 1,181 | 44.0 | +12.1 | |
| Labour | A. Walder | 1,106 | 41.2 | -19.2 | |
| Liberal Democrat | M. Natt | 348 | 13.0 | +5.4 | |
| Green | P. Scott | 48 | 1.8 | +1.8 | |
| Majority | 75 | 2.8 | |||
| Conservative gain from Labour | Swing | +15.7 | |||
St George East
| Party | Candidate | Votes | % | ± | |
|---|---|---|---|---|---|
| Conservative | D. Fey | 1,276 | 43.3 | +5.4 | |
| Labour | P. Hammond | 1,273 | 43.2 | -7.0 | |
| Liberal Democrat | N. Drew | 343 | 11.6 | +4.3 | |
| Green | E. MacLachlan | 55 | 1.9 | +0.2 | |
| Majority | 3 | 0.1 | |||
| Conservative gain from Labour | Swing | +6.2 | |||
St George West
| Party | Candidate | Votes | % | ± | |
|---|---|---|---|---|---|
| Labour | J. Preston | 1,640 | 50.5 | +5.9 | |
| Liberal Democrat | P. Main | 854 | 26.3 | -13.8 | |
| Conservative | M. Stump | 684 | 21.1 | +7.6 | |
| Green | M. Rice | 69 | 2.1 | +0.4 | |
| Majority | 786 | 24.2 | |||
| Labour hold | Swing | +9.9 | |||
Stockwood
| Party | Candidate | Votes | % | ± | |
|---|---|---|---|---|---|
| Conservative | C. Williams | 2,941 | 60.1 | +12.3 | |
| Labour | P. Garland | 1,545 | 31.6 | -9.9 | |
| Liberal Democrat | J. Collins | 357 | 7.3 | -0.7 | |
| Green | S. Ball | 52 | 1.1 | -0.1 | |
| Majority | 1,396 | 28.5 | |||
| Conservative hold | Swing | +11.1 | |||
Stoke Bishop
| Party | Candidate | Votes | % | ± | |
|---|---|---|---|---|---|
| Conservative | M. Alderson | 2,783 | 71.0 | +3.5 | |
| Liberal Democrat | E. Carpenter | 648 | 16.5 | +2.6 | |
| Labour | S. Maidment | 389 | 9.9 | -5.2 | |
| Green | J. Thorp | 98 | 2.5 | -1.0 | |
| Majority | 2,135 | 54.5 | |||
| Conservative hold | Swing | +0.5 | |||
Westbury-on-Trym
| Party | Candidate | Votes | % | ± | |
|---|---|---|---|---|---|
| Conservative | R. Wall | 3,378 | 72.2 | +3.3 | |
| Liberal Democrat | D. Redway | 647 | 13.8 | +4.9 | |
| Labour | J. Leighton | 546 | 11.7 | -1.7 | |
| Green | N. Whittingham | 108 | 2.3 | -0.7 | |
| Majority | 2,731 | 58.4 | |||
| Conservative hold | Swing | -0.8 | |||
Whitchurch Park
| Party | Candidate | Votes | % | ± | |
|---|---|---|---|---|---|
| Labour | P. Smith | 1,499 | 62.0 | -10.2 | |
| Conservative | J. LoPresti | 615 | 25.4 | +4.9 | |
| Liberal Democrat | J. Charlton | 259 | 10.7 | +4.9 | |
| Green | N. Duxfield | 44 | 1.8 | +0.3 | |
| Majority | 884 | 36.6 | |||
| Labour hold | Swing | -7.5 | |||
Windmill Hill
| Party | Candidate | Votes | % | ± | |
|---|---|---|---|---|---|
| Labour | M. Ahmed | 1,401 | 45.3 | -21.4 | |
| Conservative | W. Biggs | 956 | 30.9 | +7.8 | |
| Liberal Democrat | C. Ackland | 407 | 13.1 | +6.0 | |
| Green | J. Barraclough | 332 | 10.7 | +7.5 | |
| Majority | 445 | 14.4 | |||
| Labour hold | Swing | -14.6 | |||
Sources
- Bristol Evening Post 8 May 1992
| Metropolitan boroughs |
|
|---|---|
| District councils (England) |
|
| District councils (Scotland) |
|
| |
| Bristol City Council | |
|---|---|
| Avon County Council |
|
| |
This article is issued from Wikipedia - version of the 7/31/2016. The text is available under the Creative Commons Attribution/Share Alike but additional terms may apply for the media files.