Bristol City Council election, 1990
| | |||||||||||||||||||||||||||||||
| |||||||||||||||||||||||||||||||
| |||||||||||||||||||||||||||||||
| |||||||||||||||||||||||||||||||
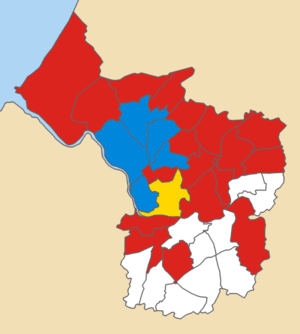
1990 local election results in Bristol
The 1990 Bristol City Council election took place on 3 May 1990 to elect members of Bristol City Council in England. This was on the same day as other local elections. One third of seats were up for election. There were by-elections in Brislington East and Easton. As Easton also had an election in the usual schedule, 2 seats were elected in that ward. There was a significant swing against the Liberal Democrats, largely as a result of the post-merger chaos that the party suffered.
Ward results
The change is calculated using the results when these actual seats were last contested, i.e. the 1986 election.
Ashley
| Party | Candidate | Votes | % | ± | |
|---|---|---|---|---|---|
| Labour | D. Sutton | 1,946 | 56.1 | -4.3 | |
| Green | D. Simpson | 899 | 25.9 | +20.0 | |
| Conservative | R. Hodges | 388 | 11.2 | -5.0 | |
| Liberal Democrat | I. Dunn | 235 | 6.8 | -7.8 | |
| Majority | 1,047 | 30.2 | |||
| Labour hold | Swing | -12.2 | |||
Avonmouth
| Party | Candidate | Votes | % | ± | |
|---|---|---|---|---|---|
| Labour | C. Lukins | 2,870 | 67.8 | +13.1 | |
| Conservative | G. Tyrrell | 990 | 23.4 | -6.5 | |
| Green | L. Hersey | 372 | 8.8 | +7.3 | |
| Majority | 1,880 | 44.4 | |||
| Labour hold | Swing | +9.8 | |||
Bedminster
| Party | Candidate | Votes | % | ± | |
|---|---|---|---|---|---|
| Labour | C. Warren | 2,660 | 57.4 | +15.3 | |
| Conservative | B. Edwards | 1,065 | 23.0 | -5.4 | |
| Liberal Democrat | R. Hughes | 614 | 13.2 | -14.9 | |
| Green | A. Gogarty | 295 | 6.4 | +5.0 | |
| Majority | 1,595 | 34.4 | |||
| Labour hold | Swing | +10.4 | |||
Bishopston
| Party | Candidate | Votes | % | ± | |
|---|---|---|---|---|---|
| Labour | H. Bashforth | 2,270 | 45.0 | +12.2 | |
| Conservative | W. Brown | 1,146 | 22.7 | -9.4 | |
| Liberal Democrat | D. Boyle | 1,093 | 21.7 | -10.3 | |
| Green | J. Quinnell | 536 | 10.6 | +7.4 | |
| Majority | 1,124 | 22.3 | |||
| Labour hold | Swing | +10.8 | |||
Brislington East
| Party | Candidate | Votes | % | ± | |
|---|---|---|---|---|---|
| Labour | P. Begley | 2,686 | 55.6 | +12.2 | |
| Conservative | A. Carey | 1,217 | 25.2 | -8.7 | |
| Liberal Democrat | R. Parsons | 399 | 8.3 | -11.7 | |
| Green | G. Davey | 274 | 5.7 | +3.1 | |
| Social Democratic | D. Brockwell | 255 | 5.3 | +5.3 | |
| Majority | 1,469 | 30.4 | |||
| Labour hold | Swing | +10.5 | |||
Cabot
| Party | Candidate | Votes | % | ± | |
|---|---|---|---|---|---|
| Liberal Democrat | C. Boney | 1,297 | 34.2 | -8.8 | |
| Labour | C. Hackett | 1,272 | 33.5 | +6.6 | |
| Conservative | P. Cobbold | 797 | 21.0 | -3.8 | |
| Green | A. Clarke | 429 | 11.3 | +6.0 | |
| Majority | 25 | 0.7 | |||
| Liberal Democrat hold | Swing | -7.7 | |||
Clifton
| Party | Candidate | Votes | % | ± | |
|---|---|---|---|---|---|
| Conservative | D. Rollings | 1,678 | 37.0 | -0.5 | |
| Green | G. Sawday | 1,148 | 25.3 | +20.7 | |
| Labour | N. Steven | 1,039 | 22.9 | +2.4 | |
| Liberal Democrat | S. Petters | 670 | 14.8 | -22.5 | |
| Majority | 530 | 11.7 | |||
| Conservative hold | Swing | -10.6 | |||
Cotham
| Party | Candidate | Votes | % | ± | |
|---|---|---|---|---|---|
| Labour | C. Taylor | 1,483 | 36.8 | +14.6 | |
| Conservative | G. Hebblethwaite | 1,366 | 33.9 | -4.5 | |
| Green | G. Collard | 654 | 16.2 | +11.1 | |
| Liberal Democrat | P. Young | 531 | 13.2 | -21.2 | |
| Majority | 117 | 2.9 | |||
| Labour gain from Conservative | Swing | +9.6 | |||
Easton
| Party | Candidate | Votes | % | ± | |
|---|---|---|---|---|---|
| Labour | R. Moss | 2,085 | 51.5 | +10.5 | |
| Labour | J. Yarwood | 2,020 | |||
| Liberal Democrat | J. Freeman | 1,288 | 31.8 | -16.6 | |
| Liberal Democrat | M. Smith | 1,268 | |||
| Conservative | S. Hennighan | 341 | 8.4 | -0.8 | |
| Green | S. Jeffery | 334 | 8.3 | +6.9 | |
| Conservative | S. Rizvi | 280 | |||
| Green | R. Nicholls | 268 | |||
| Majority | 732 | 18.1 | |||
| Labour hold | Swing | +13.6 | |||
| Labour gain from Liberal Democrat | Swing | +13.6 | |||
Eastville
| Party | Candidate | Votes | % | ± | |
|---|---|---|---|---|---|
| Labour | C. Stokes | 1,959 | 47.4 | +9.8 | |
| Conservative | D. Fey | 1,391 | 33.7 | -7.4 | |
| Liberal Democrat | G. Williams | 469 | 11.4 | -6.1 | |
| Green | C. Leroy | 311 | 7.5 | +3.7 | |
| Majority | 568 | 13.8 | |||
| Labour gain from Conservative | Swing | +8.6 | |||
Filwood
| Party | Candidate | Votes | % | ± | |
|---|---|---|---|---|---|
| Labour | D. Bryan | 1,817 | 64.2 | -9.8 | |
| Anti Poll Tax | J. Uppington | 710 | 25.1 | +25.1 | |
| Green | G. Vowles | 303 | 10.7 | +8.8 | |
| Majority | 1,107 | 39.1 | |||
| Labour hold | Swing | -17.5 | |||
Frome Vale
| Party | Candidate | Votes | % | ± | |
|---|---|---|---|---|---|
| Labour | M. Langley | 2,656 | 52.2 | +6.5 | |
| Conservative | J. Errington | 1,586 | 31.0 | -5.9 | |
| Liberal Democrat | R. Windmill | 477 | 9.3 | -6.4 | |
| Green | S. MacSorley | 392 | 7.7 | +6.1 | |
| Majority | 1,070 | 20.9 | |||
| Labour hold | Swing | +6.2 | |||
Henbury
| Party | Candidate | Votes | % | ± | |
|---|---|---|---|---|---|
| Labour | J. Fisk | 2,591 | 56.4 | +8.9 | |
| Conservative | G. Gollop | 1,200 | 26.1 | -9.5 | |
| Liberal Democrat | A. Stephen | 492 | 10.7 | -4.4 | |
| Social Democratic | H. Long | 139 | 3.0 | +3.0 | |
| Green | J. Thorp | 136 | 3.0 | +1.2 | |
| Brentry Residents | S. Wiles | 34 | 0.7 | +0.7 | |
| Majority | 1,391 | 30.3 | |||
| Labour hold | Swing | +9.2 | |||
Henleaze
| Party | Candidate | Votes | % | ± | |
|---|---|---|---|---|---|
| Conservative | G. Browne | 2,440 | 51.6 | -5.3 | |
| Labour | M. Vokins | 904 | 19.1 | +5.6 | |
| Liberal Democrat | L. Smith | 893 | 18.9 | -6.1 | |
| Green | M. Coldham | 495 | 10.5 | +5.9 | |
| Majority | 1,536 | 32.5 | |||
| Conservative hold | Swing | -5.5 | |||
Hillfields
| Party | Candidate | Votes | % | ± | |
|---|---|---|---|---|---|
| Labour | D. Naysmith | 2,393 | 59.8 | +2.0 | |
| Conservative | A. Seville | 743 | 18.6 | -5.8 | |
| Liberal Democrat | G. Draper | 469 | 11.7 | -4.0 | |
| Green | C. Stones | 216 | 5.4 | +3.3 | |
| Social Democratic | P. Hopkins | 181 | 4.5 | +4.5 | |
| Majority | 1,650 | 41.2 | |||
| Labour hold | Swing | +3.9 | |||
Horfield
| Party | Candidate | Votes | % | ± | |
|---|---|---|---|---|---|
| Labour | J. Channon | 1,971 | 43.3 | +12.2 | |
| Conservative | B. Topham | 1,821 | 40.0 | -9.0 | |
| Liberal Democrat | S. Young | 530 | 11.6 | -6.0 | |
| Green | J. Duggan | 232 | 5.1 | +2.8 | |
| Majority | 150 | 3.3 | |||
| Labour gain from Conservative | Swing | +10.6 | |||
Kingsweston
| Party | Candidate | Votes | % | ± | |
|---|---|---|---|---|---|
| Labour | R. Clarke | 2,477 | 59.3 | +14.9 | |
| Conservative | J. Veale | 1,017 | 24.3 | -17.7 | |
| Liberal Democrat | M. Hamilton | 510 | 12.2 | -0.2 | |
| Green | P. Roe | 176 | 4.2 | +3.0 | |
| Majority | 1,460 | 34.9 | |||
| Labour hold | Swing | +16.3 | |||
Lawrence Hill
| Party | Candidate | Votes | % | ± | |
|---|---|---|---|---|---|
| Labour | D. Tedder | 2,548 | 71.5 | -0.1 | |
| Conservative | H. Crispin | 438 | 12.3 | -3.4 | |
| Liberal Democrat | S. Carrick | 315 | 8.8 | -2.3 | |
| Green | D. Wall | 265 | 7.4 | +5.8 | |
| Majority | 2,110 | 59.2 | |||
| Labour hold | Swing | +1.7 | |||
Lockleaze
| Party | Candidate | Votes | % | ± | |
|---|---|---|---|---|---|
| Labour | F. Barnes | 2,434 | 66.3 | +11.2 | |
| Conservative | M. Davis | 607 | 16.5 | -11.3 | |
| Liberal Democrat | F. Young | 426 | 11.6 | -3.8 | |
| Green | E. Bullard | 202 | 5.5 | +3.7 | |
| Majority | 1,827 | 49.8 | |||
| Labour hold | Swing | +11.3 | |||
Redland
| Party | Candidate | Votes | % | ± | |
|---|---|---|---|---|---|
| Conservative | I. Temple | 1,670 | 36.8 | -5.5 | |
| Labour | J. Ashton | 1,658 | 36.6 | +13.2 | |
| Liberal Democrat | J. Fenn | 647 | 14.3 | -14.8 | |
| Green | C. Leegwater | 558 | 12.3 | +7.0 | |
| Majority | 12 | 0.2 | |||
| Conservative hold | Swing | -9.4 | |||
Southmead
| Party | Candidate | Votes | % | ± | |
|---|---|---|---|---|---|
| Labour | L. Bromham | 2,428 | 61.5 | +7.0 | |
| Conservative | A. Orr | 846 | 21.4 | -5.2 | |
| Liberal Democrat | J. Taylor | 356 | 9.0 | -8.4 | |
| Green | P. Scott | 167 | 4.2 | +2.8 | |
| Social Democratic | W. Gibbens | 150 | 3.8 | +3.8 | |
| Majority | 1,582 | 40.1 | |||
| Labour hold | Swing | +6.1 | |||
Southville
| Party | Candidate | Votes | % | ± | |
|---|---|---|---|---|---|
| Labour | N. Currie | 2,416 | 57.8 | +1.3 | |
| Conservative | J. Pepworth | 879 | 21.0 | -5.6 | |
| Green | R. Martin | 450 | 10.8 | +7.2 | |
| Liberal Democrat | V. Bartlett | 434 | 10.4 | -2.9 | |
| Majority | 1,537 | 36.8 | |||
| Labour hold | Swing | +3.5 | |||
Stoke Bishop
| Party | Candidate | Votes | % | ± | |
|---|---|---|---|---|---|
| Conservative | P. Abraham | 2,741 | 52.7 | -1.6 | |
| Liberal Democrat | R. Pyne | 1,010 | 19.4 | -12.3 | |
| Labour | M. Fleming | 977 | 18.8 | +7.2 | |
| Green | E. MacLachlan | 471 | 9.1 | +6.6 | |
| Majority | 1,731 | 33.3 | |||
| Conservative hold | Swing | +5.4 | |||
Westbury-on-Trym
| Party | Candidate | Votes | % | ± | |
|---|---|---|---|---|---|
| Conservative | D. Poole | 2,915 | 58.6 | -8.3 | |
| Labour | M. Hulin | 854 | 17.2 | +6.0 | |
| Liberal Democrat | D. Redway | 725 | 14.6 | -4.9 | |
| Green | D. Watson | 347 | 7.0 | +4.6 | |
| Social Democratic | A. Smith | 136 | 2.7 | +2.7 | |
| Majority | 2,061 | 41.4 | |||
| Conservative hold | Swing | -7.2 | |||
Sources
- Bristol Evening Post 4 May 1990
| London boroughs |
|
|---|---|
| Metropolitan boroughs |
|
| District councils (England) |
|
| Regional councils (Scotland) |
|
| Bristol City Council | |
|---|---|
| Avon County Council |
|
| |
This article is issued from Wikipedia - version of the 7/30/2016. The text is available under the Creative Commons Attribution/Share Alike but additional terms may apply for the media files.