Sheffield City Council election, 1986
| | |||||||||||||||||||||||||||||||
| |||||||||||||||||||||||||||||||
| |||||||||||||||||||||||||||||||
|
| |||||||||||||||||||||||||||||||
| Map showing the results of the 1986 Sheffield City Council elections. | |||||||||||||||||||||||||||||||
| |||||||||||||||||||||||||||||||
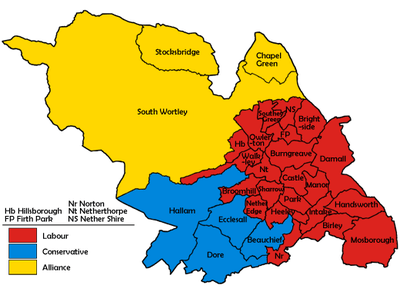
Elections to Sheffield City Council were held on 8 May 1986. One third of the council was up for election. Since the 1984 election, the Conservatives had successfully defended two seats in Broomhill and Labour had held one of their Park seats in by-elections the following year.[1]
Election result
| Sheffield Local Election Result 1986 | ||||||||||
|---|---|---|---|---|---|---|---|---|---|---|
| Party | Seats | Gains | Losses | Net gain/loss | Seats % | Votes % | Votes | +/− | ||
| Labour | 22 | 2 | 0 | +2 | 73.3 | 53.6 | 75,901 | -1.0% | ||
| Conservative | 5 | 0 | 2 | -2 | 16.6 | 20.0 | 28,267 | -4.6% | ||
| SDP–Liberal Alliance | 3 | 0 | 0 | 0 | 10.0 | 25.3 | 35,810 | +4.8% | ||
| Independent Labour | 0 | 0 | 0 | 0 | 0.0 | 0.5 | 700 | +0.5% | ||
| Independent | 0 | 0 | 0 | 0 | 0.0 | 0.2 | 279 | +0.2% | ||
| Green | 0 | 0 | 0 | 0 | 0.0 | 0.1 | 224 | +0.1% | ||
| Revolutionary Communist | 0 | 0 | 0 | 0 | 0.0 | 0.1 | 128 | +0.1% | ||
| Christian Ecology | 0 | 0 | 0 | 0 | 0.0 | 0.0 | 84 | +0.0% | ||
| Communist | 0 | 0 | 0 | 0 | 0.0 | 0.0 | 64 | -0.2% | ||
This result had the following consequences for the total number of seats on the Council after the elections:
| Party | Previous council | New council | |||
|---|---|---|---|---|---|
| Labour | 61 | 63 | |||
| Conservatives | 17 | 15 | |||
| SDP–Liberal Alliance | 9 | 9 | |||
| Total | 87 | 87 | |||
| Working majority | 35 | 39 | |||
Ward results
| Party | Candidate | Votes | % | ± | |
|---|---|---|---|---|---|
| Conservative | Thomas Seaton | 2,466 | 39.6 | -14.7 | |
| Labour | George Munn | 2,319 | 37.2 | +11.0 | |
| SDP–Liberal Alliance (Social Democratic) | John White | 1,440 | 23.1 | +3.7 | |
| Majority | 147 | 2.4 | -25.7 | ||
| Turnout | 6,225 | 40.6 | |||
| Conservative hold | Swing | -12.8 | |||
| Party | Candidate | Votes | % | ± | |
|---|---|---|---|---|---|
| Labour | Donald Gow | 3,622 | 65.5 | +1.6 | |
| SDP–Liberal Alliance (Social Democratic) | Cyril Skipworth | 1,152 | 20.8 | +6.6 | |
| Conservative | George Salter | 750 | 13.6 | -8.3 | |
| Majority | 2,470 | 44.7 | +2.7 | ||
| Turnout | 5,524 | 34.0 | |||
| Labour hold | Swing | -2.5 | |||
| Party | Candidate | Votes | % | ± | |
|---|---|---|---|---|---|
| Labour | Rae Whitfield | 2,940 | 76.0 | +5.7 | |
| SDP–Liberal Alliance (Social Democratic) | George Wilson | 604 | 15.6 | -2.8 | |
| Conservative | Simon Braggs | 325 | 8.4 | -2.8 | |
| Majority | 2,336 | 60.4 | +8.5 | ||
| Turnout | 3,869 | 29.5 | |||
| Labour hold | Swing | +4.2 | |||
| Party | Candidate | Votes | % | ± | |
|---|---|---|---|---|---|
| Labour | John Woodcock | 2,222 | 39.8 | +4.1 | |
| SDP–Liberal Alliance (Social Democratic) | Jane Padget | 1,763 | 31.6 | +10.7 | |
| Conservative | Giles Orton | 1,595 | 28.6 | -14.8 | |
| Majority | 459 | 8.2 | +0.5 | ||
| Turnout | 5,580 | 41.8 | |||
| Labour gain from Conservative | Swing | -3.3 | |||
| Party | Candidate | Votes | % | ± | |
|---|---|---|---|---|---|
| Labour | Brian Flanagan | 3,237 | 79.6 | +26.4 | |
| SDP–Liberal Alliance (Liberal) | Khalid Mahmood | 831 | 20.4 | -21.4 | |
| Majority | 2,406 | 59.2 | +47.8 | ||
| Turnout | 4,068 | 32.5 | |||
| Labour hold | Swing | +23.9 | |||
| Party | Candidate | Votes | % | ± | |
|---|---|---|---|---|---|
| Labour | Peter Horton | 3,179 | 83.9 | +6.0 | |
| Conservative | Joan Graham | 377 | 9.9 | -2.9 | |
| SDP–Liberal Alliance (Social Democratic) | Muhammad Zahur | 234 | 6.2 | -2.0 | |
| Majority | 2,802 | 74.0 | +8.9 | ||
| Turnout | 3,790 | 29.1 | |||
| Labour hold | Swing | +4.4 | |||
| Party | Candidate | Votes | % | ± | |
|---|---|---|---|---|---|
| SDP–Liberal Alliance (Liberal) | Susan Ward | 3,103 | 47.8 | -8.3 | |
| Labour | Peter Duff | 2,970 | 45.7 | +9.0 | |
| Conservative | Mary Hyatt | 418 | 6.4 | -0.7 | |
| Majority | 132 | 2.1 | -17.3 | ||
| Turnout | 6,491 | 38.9 | |||
| SDP–Liberal Alliance hold | Swing | -8.6 | |||
| Party | Candidate | Votes | % | ± | |
|---|---|---|---|---|---|
| Labour | Choudry Walayat | 1,899 | 42.1 | -23.1 | |
| SDP–Liberal Alliance (Liberal) | Dennis Boothroyd | 1,219 | 27.0 | +13.2 | |
| Independent Labour | Sheila Rehman | 700 | 15.5 | +15.5 | |
| Conservative | Colin Cavill | 686 | 15.2 | -5.8 | |
| Majority | 680 | 15.1 | -29.1 | ||
| Turnout | 4,504 | 31.1 | |||
| Labour hold | Swing | -18.1 | |||
| Party | Candidate | Votes | % | ± | |
|---|---|---|---|---|---|
| Conservative | Jack Thompson | 3,271 | 49.4 | -9.0 | |
| Labour | Maureen Whitebrook | 1,853 | 28.0 | +2.6 | |
| SDP–Liberal Alliance (Liberal) | Edith Fawcett | 1,498 | 22.6 | +6.5 | |
| Majority | 1,418 | 21.4 | -11.6 | ||
| Turnout | 6,622 | 40.1 | |||
| Conservative hold | Swing | -5.8 | |||
| Party | Candidate | Votes | % | ± | |
|---|---|---|---|---|---|
| Conservative | Stuart Dawson | 3,156 | 47.7 | -8.6 | |
| Conservative | Jeremy Richardson | 3,021 | |||
| SDP–Liberal Alliance (Liberal) | Arthur Fawthrop | 2,117 | 32.0 | +7.6 | |
| SDP–Liberal Alliance (Liberal) | Christine Freeman | 1,975 | |||
| Labour | Roy Darke | 1,343 | 20.3 | +1.1 | |
| Labour | Jeane Cromar | 1,335 | |||
| Majority | 1,039 | 15.7 | +10.4 | ||
| Turnout | 6,616 | 42.3 | |||
| Conservative hold | Swing | ||||
| Conservative hold | Swing | -8.1 | |||
| Party | Candidate | Votes | % | ± | |
|---|---|---|---|---|---|
| Labour | Joan Barton | 3,470 | 80.6 | +3.4 | |
| Conservative | Angela Knight | 517 | 12.0 | +1.2 | |
| Independent | Nisar Qureshi | 279 | 6.5 | +6.5 | |
| Revolutionary Communist | Carolyn Pryce | 39 | 0.9 | +0.9 | |
| Majority | 2,953 | 68.6 | +3.3 | ||
| Turnout | 4,305 | 30.8 | |||
| Labour hold | Swing | +1.1 | |||
| Party | Candidate | Votes | % | ± | |
|---|---|---|---|---|---|
| Conservative | Ian Fey | 2,885 | 40.5 | -14.4 | |
| SDP–Liberal Alliance (Social Democratic) | John Knight | 2,489 | 34.9 | +10.4 | |
| Labour | Christopher Walker | 1,749 | 24.5 | +4.0 | |
| Majority | 396 | 5.6 | -24.8 | ||
| Turnout | 7,123 | 48.9 | |||
| Conservative hold | Swing | -12.4 | |||
| Party | Candidate | Votes | % | ± | |
|---|---|---|---|---|---|
| Labour | Kenneth Hartley | 3,582 | 69.2 | +3.3 | |
| SDP–Liberal Alliance (Social Democratic) | Marguerite Crangle | 803 | 15.5 | +2.3 | |
| Conservative | Shirley Clayton | 707 | 13.6 | -7.2 | |
| Christian Ecology | Roger Dunn | 84 | 1.6 | +1.6 | |
| Majority | 2,779 | 53.7 | +8.6 | ||
| Turnout | 5,176 | 34.2 | |||
| Labour hold | Swing | +0.5 | |||
| Party | Candidate | Votes | % | ± | |
|---|---|---|---|---|---|
| Labour | Mukesh Savani | 3,117 | 58.6 | -2.4 | |
| Conservative | Nicholas Asiam | 1,091 | 20.5 | -5.9 | |
| SDP–Liberal Alliance (Social Democratic) | Raymond Mellor | 1,058 | 19.9 | +7.4 | |
| Revolutionary Communist | Steven Brown | 47 | 0.9 | +0.9 | |
| Majority | 2,026 | 38.1 | +3.5 | ||
| Turnout | 5,313 | 35.0 | |||
| Labour hold | Swing | +1.7 | |||
| Party | Candidate | Votes | % | ± | |
|---|---|---|---|---|---|
| Labour | Penelope Peysner | 3,235 | 50.2 | -1.6 | |
| SDP–Liberal Alliance (Liberal) | Francis Butler | 1,996 | 31.0 | +6.4 | |
| Conservative | Michael Warner | 1,213 | 18.8 | -4.7 | |
| Majority | 1,239 | 19.2 | -8.0 | ||
| Turnout | 6,444 | 42.5 | |||
| Labour hold | Swing | -4.0 | |||
| Party | Candidate | Votes | % | ± | |
|---|---|---|---|---|---|
| Labour | Deborah Matthews | 3,188 | 61.2 | +2.2 | |
| Conservative | Elizabeth Bradbury | 1,153 | 22.1 | -4.4 | |
| SDP–Liberal Alliance (Social Democratic) | Francis Pierce | 866 | 16.6 | +2.1 | |
| Majority | 2,035 | 39.1 | +6.6 | ||
| Turnout | 5,207 | 32.9 | |||
| Labour hold | Swing | +3.3 | |||
| Party | Candidate | Votes | % | ± | |
|---|---|---|---|---|---|
| Labour | Howard Capelin | Unopposed | N/A | N/A | |
| Labour hold | Swing | N/A | |||
| Party | Candidate | Votes | % | ± | |
|---|---|---|---|---|---|
| Labour | Ian Saunders | 3,758 | 65.1 | -1.9 | |
| Conservative | Evelyn Millward | 1,022 | 17.7 | -3.9 | |
| SDP–Liberal Alliance (Social Democratic) | Hilary Gooch | 995 | 17.2 | +5.9 | |
| Majority | 2,736 | 47.4 | +2.0 | ||
| Turnout | 5,775 | 28.9 | |||
| Labour hold | Swing | +1.0 | |||
| Party | Candidate | Votes | % | ± | |
|---|---|---|---|---|---|
| Labour | Qurban Hussain | 2,386 | 39.1 | -4.0 | |
| Conservative | Christine Smith | 1,854 | 30.4 | -9.2 | |
| SDP–Liberal Alliance (Liberal) | George Manley | 1,628 | 26.7 | +11.4 | |
| Green | Jane Beharrell | 224 | 3.7 | +1.9 | |
| Majority | 532 | 8.7 | +5.2 | ||
| Turnout | 6,092 | 43.9 | |||
| Labour gain from Conservative | Swing | +2.6 | |||
| Party | Candidate | Votes | % | ± | |
|---|---|---|---|---|---|
| Labour | Alan Wigfield | 3,453 | 78.4 | +7.8 | |
| SDP–Liberal Alliance (Social Democratic) | George Clayton | 585 | 13.3 | -4.9 | |
| Conservative | John Harrington | 366 | 8.3 | -2.8 | |
| Majority | 2,868 | 65.1 | +12.7 | ||
| Turnout | 4,404 | 33.2 | |||
| Labour hold | Swing | +6.3 | |||
| Party | Candidate | Votes | % | ± | |
|---|---|---|---|---|---|
| Labour | James Steinke | 2,986 | 73.6 | +3.0 | |
| SDP–Liberal Alliance (Liberal) | Peter McNutt | 1,072 | 26.4 | +8.2 | |
| Majority | 1,914 | 47.2 | -5.2 | ||
| Turnout | 4,058 | 32.3 | |||
| Labour hold | Swing | -2.6 | |||
| Party | Candidate | Votes | % | ± | |
|---|---|---|---|---|---|
| Labour | James Moore | 3,406 | 63.7 | +0.9 | |
| Conservative | Nigel Ball | 971 | 18.1 | -6.6 | |
| SDP–Liberal Alliance (Liberal) | Anita Norris | 967 | 18.1 | +5.7 | |
| Majority | 2,435 | 45.6 | +7.5 | ||
| Turnout | 5,344 | 39.1 | |||
| Labour hold | Swing | +3.7 | |||
| Party | Candidate | Votes | % | ± | |
|---|---|---|---|---|---|
| Labour | George Mathews | 2,918 | 74.0 | -0.7 | |
| SDP–Liberal Alliance (Liberal) | Philip Taylor | 583 | 14.8 | +3.1 | |
| Conservative | Lorna Banham | 440 | 11.1 | -2.5 | |
| Majority | 2,335 | 59.2 | -2.1 | ||
| Turnout | 3,941 | 29.9 | |||
| Labour hold | Swing | -1.9 | |||
| Party | Candidate | Votes | % | ± | |
|---|---|---|---|---|---|
| Labour | Doris Mulhearn | 2,901 | 82.8 | -0.2 | |
| SDP–Liberal Alliance (Liberal) | Donald Smith | 332 | 9.5 | +3.2 | |
| Conservative | Cissie Reynolds | 269 | 7.7 | -2.9 | |
| Majority | 2,569 | 73.3 | +0.9 | ||
| Turnout | 3,502 | 24.7 | |||
| Labour hold | Swing | -1.7 | |||
| Party | Candidate | Votes | % | ± | |
|---|---|---|---|---|---|
| Labour | Ruth Midgley | 2,440 | 64.7 | -4.3 | |
| SDP–Liberal Alliance (Social Democratic) | Mohammed Malik | 648 | 17.2 | -10.8 | |
| Conservative | Anne Smith | 577 | 15.3 | +15.3 | |
| Communist | Walter Hartley | 64 | 1.7 | -1.2 | |
| Revolutionary Communist | Edmund Price | 42 | 1.1 | +1.1 | |
| Majority | 1,792 | 47.5 | +6.5 | ||
| Turnout | 3,771 | 31.2 | |||
| Labour hold | Swing | +3.2 | |||
| Party | Candidate | Votes | % | ± | |
|---|---|---|---|---|---|
| SDP–Liberal Alliance (Liberal) | Philip Howson | 3,601 | 47.7 | +8.1 | |
| Labour | John Buckley | 2,730 | 36.1 | +1.1 | |
| Conservative | Elizabeth Conboy | 1,223 | 16.2 | -9.2 | |
| Majority | 871 | 11.6 | +7.0 | ||
| Turnout | 7,554 | 41.7 | |||
| SDP–Liberal Alliance hold | Swing | +3.5 | |||
| Party | Candidate | Votes | % | ± | |
|---|---|---|---|---|---|
| Labour | Patricia Nelson | Unopposed | N/A | N/A | |
| Labour hold | Swing | N/A | |||
| Party | Candidate | Votes | % | ± | |
|---|---|---|---|---|---|
| SDP–Liberal Alliance (Liberal) | Malcolm Brelsford | 1,896 | 47.6 | -0.7 | |
| Labour | John Johnston | 1,664 | 41.8 | -0.0 | |
| Conservative | Beryl Fleming | 420 | 10.5 | +0.7 | |
| Majority | 232 | 5.8 | -0.7 | ||
| Turnout | 3,980 | 38.2 | |||
| SDP–Liberal Alliance hold | Swing | -0.3 | |||
| Party | Candidate | Votes | % | ± | |
|---|---|---|---|---|---|
| Labour | Carol Bullement | 3,334 | 53.9 | -8.4 | |
| SDP–Liberal Alliance (Social Democratic) | David Brown | 2,330 | 37.7 | +15.3 | |
| Conservative | Paul Makin | 515 | 8.3 | -7.0 | |
| Majority | 1,004 | 16.2 | -23.7 | ||
| Turnout | 6,179 | 42.9 | |||
| Labour hold | Swing | -11.8 | |||
References
| London boroughs |
|
|---|---|
| Metropolitan boroughs |
|
| District councils (England) |
|
| Regional councils (Scotland) | |
| LEAs | |
| Barnsley Metropolitan Borough Council | |
|---|---|
| Doncaster Metropolitan Borough Council | |
| Rotherham Metropolitan Borough Council | |
| Sheffield City Council |
|
| South Yorkshire County Council |
|
| West Riding County Council | |
| |
This article is issued from Wikipedia - version of the 11/29/2016. The text is available under the Creative Commons Attribution/Share Alike but additional terms may apply for the media files.