Bristol City Council election, 1994
Bristol City Council election, 1994
|
|
|
|
|
|
|
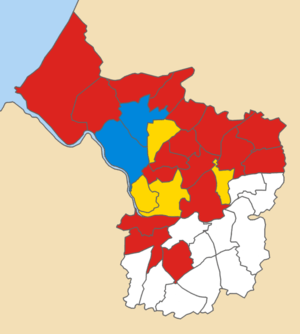
1994 local election results in Bristol
The 1994 Bristol City Council election took place on 5 May 1994 to elect members of Bristol City Council in England. This was on the same day as other local elections. One third of seats were up for election. The Bristol Party was formed by Bristol Rovers fans to campaign for a new stadium for the club. There was a general swing from the Conservatives and Greens to the Liberal Democrats, reflecting the beginning of the Conservative decline nationally and also the Liberal Democrat recovery after the merger troubles.
Ward results
The change is calculated using the results when these actual seats were last contested, i.e. the 1990 election.
Bishopston
| Party |
Candidate |
Votes |
% |
± |
|
Labour |
H. Bashforth |
1,947 |
42.9 |
-2.1 |
|
Liberal Democrat |
D.J.G. Kitson |
1,324 |
29.1 |
+7.4 |
|
Conservative |
A.S. Waycott |
841 |
18.5 |
-4.2 |
|
Bristol Party |
E.A. Chappell |
254 |
5.6 |
+5.6 |
|
Green |
J.M. Quinnell |
177 |
3.9 |
-6.7 |
| Majority |
623 |
13.7 |
|
|
Labour hold |
Swing |
-4.2 |
|
Eastville
| Party |
Candidate |
Votes |
% |
± |
|
Labour |
S.J. Andrews |
1,584 |
43.1 |
-4.3 |
|
Conservative |
T.C. Collins |
894 |
24.3 |
-9.4 |
|
Bristol Party |
A.J. Locke |
574 |
15.6 |
+15.6 |
|
Liberal Democrat |
P.R. Potts |
541 |
14.7 |
+3.3 |
|
Green |
R. Nicholls |
84 |
2.3 |
-5.2 |
| Majority |
690 |
18.8 |
|
|
Labour hold |
Swing |
+2.6 |
|
Filwood
| Party |
Candidate |
Votes |
% |
± |
|
Labour |
D.J. Bryan |
1,156 |
58.6 |
-5.6 |
|
Militant Labour |
I.P. Marshall |
397 |
20.1 |
+20.1 |
|
Liberal Democrat |
J.M. Nichol |
215 |
10.9 |
+10.9 |
|
Conservative |
S.M. Willis |
166 |
8.5 |
+8.5 |
|
Green |
G.H. Davey |
40 |
2.0 |
-8.7 |
| Majority |
759 |
38.4 |
|
|
Labour hold |
Swing |
-12.9 |
|
Frome Vale
| Party |
Candidate |
Votes |
% |
± |
|
Labour |
M.P. Langley |
1,870 |
42.8 |
-9.4 |
|
Conservative |
V.C. Eaglestone |
1,113 |
25.5 |
-5.5 |
|
Liberal Democrat |
W.G. Barrett |
843 |
19.3 |
+10.0 |
|
Bristol Party |
R.J. Sparks |
541 |
12.4 |
+12.4 |
| Majority |
757 |
17.3 |
|
|
Labour hold |
Swing |
-2.0 |
|
Henbury
| Party |
Candidate |
Votes |
% |
± |
|
Labour |
J.D. Fisk |
1,957 |
51.6 |
-4.8 |
|
Conservative |
A.J. Smith |
942 |
24.9 |
-1.2 |
|
Liberal Democrat |
J.R. Culliford |
516 |
13.6 |
+2.9 |
|
Bristol Party |
S.J.F. Burns |
374 |
9.9 |
+9.9 |
| Majority |
1,015 |
26.9 |
|
|
Labour hold |
Swing |
-1.8 |
|
Hillfields
| Party |
Candidate |
Votes |
% |
± |
|
Labour |
J.D. Naysmith |
1,734 |
55.8 |
-4.0 |
|
Liberal Democrat |
J.P. Corrigan |
483 |
15.6 |
+3.9 |
|
Conservative |
A.D. Seville |
461 |
14.8 |
-3.8 |
|
Bristol Party |
D.J. Down |
428 |
13.8 |
+13.8 |
| Majority |
1,251 |
40.3 |
|
|
Labour hold |
Swing |
-4.0 |
|
Horfield
| Party |
Candidate |
Votes |
% |
± |
|
Labour |
D.R. Poole |
1,694 |
43.1 |
-0.2 |
|
Conservative |
L.G. Collison |
1,239 |
31.5 |
-8.5 |
|
Liberal Democrat |
S.E. Young |
534 |
13.6 |
+2.0 |
|
Bristol Party |
A.F. Poole |
392 |
10.0 |
+10.0 |
|
Green |
P.M. Scott |
75 |
1.9 |
-3.2 |
| Majority |
455 |
11.6 |
|
|
Labour hold |
Swing |
+4.2 |
|
Lawrence Hill
| Party |
Candidate |
Votes |
% |
± |
|
Labour |
R.J. Channon |
1,743 |
61.7 |
-9.8 |
|
Liberal Democrat |
G.L. Williams |
368 |
13.0 |
+4.2 |
|
Bristol Party |
P.D. Burrows |
363 |
12.8 |
+12.8 |
|
Conservative |
H. Richmond |
249 |
8.8 |
-3.5 |
|
Green |
N.E. Whittingham |
102 |
3.6 |
-3.8 |
| Majority |
1,375 |
48.7 |
|
|
Labour hold |
Swing |
-7.0 |
|
Lockleaze
| Party |
Candidate |
Votes |
% |
± |
|
Labour |
J. Patterson |
1,646 |
53.6 |
-12.7 |
|
Liberal Democrat |
J. Grace |
756 |
24.6 |
+13.0 |
|
Conservative |
A. Low |
370 |
12.0 |
-4.5 |
|
Bristol Party |
V.F. Kemp |
300 |
9.8 |
+9.8 |
| Majority |
890 |
29.0 |
|
|
Labour hold |
Swing |
-12.9 |
|
Southmead
| Party |
Candidate |
Votes |
% |
± |
|
Labour |
P.W. Hammond |
1,547 |
53.8 |
-7.7 |
|
Conservative |
J. Abdalla |
503 |
17.5 |
-3.9 |
|
Liberal Democrat |
S.R. Young |
418 |
14.5 |
+5.5 |
|
Bristol Party |
J.S. Steynings |
405 |
14.1 |
+14.1 |
| Majority |
1,044 |
36.3 |
|
|
Labour hold |
Swing |
-1.9 |
|
Sources
- Bristol Evening Post 6 May 1994