Wakefield Metropolitan District Council election, 2006
The 2006 Wakefield Metropolitan District Council election took place on 4 May 2006 to elect members of Wakefield Metropolitan District Council in West Yorkshire, England. One third of the council was up for election and the Labour party kept overall control of the council.[1]
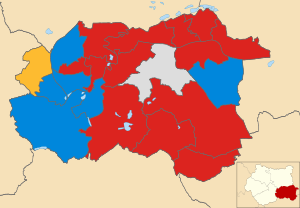
After the election, the composition of the council was
- Labour 41
- Conservative 14
- Independent 5
- Liberal Democrat 3[2]
Campaign
Before the election Labour had 44 seats, the Conservatives 10, independents 6 and the Liberal Democrats 3 seats.[3] 75 candidates stood in the election for the 21 seats that were being contested,[3] with Labour very unlikely to lose control of the council, which was the only council in West Yorkshire they still had a majority on.[4]
Election result
The results saw the Conservatives gain 4 seats, 3 from Labour and 1 from an independent.[5][6] Labour were defeated in Horbury and South Ossett, Pontefract South and Wrenthorpe and Outwood West wards,[5] with the losses blamed by the Labour leader on national issues.[7] The other Conservative gain came in Wakefield South where they defeated independent councillor Norman Hazell by 17 votes.[5][8] Hazell was a former Conservative member who had left the party in 2001 to sit as an independent councillor.[5] However the other independent member managed to hold his seat in Featherstone despite a strong challenge from Labour.[5]
| Wakefield Local Election Result 2006[2][9][10] | ||||||||||
|---|---|---|---|---|---|---|---|---|---|---|
| Party | Seats | Gains | Losses | Net gain/loss | Seats % | Votes % | Votes | +/− | ||
| Labour | 13 | 0 | 3 | -3 | 61.9 | 41.7 | 32,765 | -4.0% | ||
| Conservative | 6 | 4 | 0 | +4 | 28.6 | 29.1 | 22,832 | -0.7% | ||
| Liberal Democrat | 1 | 0 | 0 | 0 | 4.8 | 9.4 | 7,375 | +1.1% | ||
| Independent | 1 | 0 | 1 | -1 | 4.8 | 7.6 | 5,962 | -2.3% | ||
| BNP | 0 | 0 | 0 | 0 | 0 | 10.7 | 8,426 | +6.7% | ||
| Green | 0 | 0 | 0 | 0 | 0 | 1.1 | 861 | +0.6% | ||
| Socialist Alternative | 0 | 0 | 0 | 0 | 0 | 0.3 | 231 | -0.3% | ||
| UKIP | 0 | 0 | 0 | 0 | 0 | 0.2 | 128 | -0.9% | ||
Ward results
| Party | Candidate | Votes | % | ± | |
|---|---|---|---|---|---|
| Labour | Sarah Balfour | 1,707 | 41.6 | ||
| Conservative | Andrew Crowther | 1,285 | 31.3 | ||
| Independent | John Evans | 566 | 13.8 | ||
| Liberal Democrat | Oliver Wadsworth | 543 | 13.2 | ||
| Majority | 422 | 10.3 | |||
| Turnout | 4,101 | ||||
| Labour hold | Swing | ||||
| Party | Candidate | Votes | % | ± | |
|---|---|---|---|---|---|
| Labour | Linda Broom | 1,655 | 58.0 | ||
| BNP | Stephen Rogerson | 709 | 24.9 | ||
| Conservative | Eamonn Mullins | 489 | 17.1 | ||
| Majority | 946 | 33.1 | |||
| Turnout | 2,853 | ||||
| Labour hold | Swing | ||||
| Party | Candidate | Votes | % | ± | |
|---|---|---|---|---|---|
| Labour | Darran Travis | 1,717 | 49.6 | ||
| BNP | Loraine Frazer | 682 | 19.7 | ||
| Liberal Democrat | Michael Burch | 572 | 16.5 | ||
| Conservative | Tom Dixon | 490 | 14.2 | ||
| Majority | 1,035 | 29.9 | |||
| Turnout | 3,461 | ||||
| Labour hold | Swing | ||||
| Party | Candidate | Votes | % | ± | |
|---|---|---|---|---|---|
| Labour | Denise Jeffery | 1,884 | 52.8 | ||
| BNP | Rita Robinson | 876 | 24.6 | ||
| Liberal Democrat | Michael Mann | 475 | 13.3 | ||
| Conservative | Rebecca Mullins | 333 | 9.3 | ||
| Majority | 1,008 | 28.2 | |||
| Turnout | 3,568 | ||||
| Labour hold | Swing | ||||
| Party | Candidate | Votes | % | ± | |
|---|---|---|---|---|---|
| Labour | Graham Isherwood | 1,594 | 35.9 | ||
| Conservative | Adam Parry | 1,247 | 28.1 | ||
| BNP | Dean Crossland | 868 | 19.6 | ||
| Independent | Janice Power | 729 | 16.4 | ||
| Majority | 347 | 7.8 | |||
| Turnout | 4,438 | ||||
| Labour hold | Swing | ||||
| Party | Candidate | Votes | % | ± | |
|---|---|---|---|---|---|
| Independent | Roy Bickerton | 2,207 | 50.1 | ||
| Labour | Margaret Isherwood | 1,871 | 42.5 | ||
| Conservative | Jean Molloy | 326 | 7.4 | ||
| Majority | 336 | 7.6 | |||
| Turnout | 4,404 | ||||
| Independent hold | Swing | ||||
| Party | Candidate | Votes | % | ± | |
|---|---|---|---|---|---|
| Labour | Tracey Hardwick | 1,773 | 66.1 | ||
| Conservative | Christian l'Anson | 908 | 33.9 | ||
| Majority | 865 | 32.2 | |||
| Turnout | 2,681 | ||||
| Labour hold | Swing | ||||
| Party | Candidate | Votes | % | ± | |
|---|---|---|---|---|---|
| Conservative | John Sharp | 1,411 | 34.3 | ||
| Labour | David Watts | 1,245 | 30.3 | ||
| Liberal Democrat | Mark Goodair | 873 | 21.2 | ||
| BNP | John Aveyard | 582 | 14.2 | ||
| Majority | 166 | 4.0 | |||
| Turnout | 4,111 | ||||
| Conservative gain from Labour | Swing | ||||
| Party | Candidate | Votes | % | ± | |
|---|---|---|---|---|---|
| Labour | Patricia Doyle | 1,673 | 64.1 | ||
| Conservative | Nathan Garbutt | 937 | 35.9 | ||
| Majority | 736 | 28.2 | |||
| Turnout | 2,610 | ||||
| Labour hold | Swing | ||||
| Party | Candidate | Votes | % | ± | |
|---|---|---|---|---|---|
| Labour | Susan Blezard | 1,370 | 43.3 | ||
| BNP | Adam Frazer | 667 | 21.1 | ||
| Independent | William Wood | 432 | 13.6 | ||
| Conservative | Tony Ayoade | 426 | 13.5 | ||
| Liberal Democrat | Jack Smith | 272 | 8.6 | ||
| Majority | 703 | 22.2 | |||
| Turnout | 3,167 | ||||
| Labour hold | Swing | ||||
| Party | Candidate | Votes | % | ± | |
|---|---|---|---|---|---|
| Liberal Democrat | Peter Walker | 1,752 | 38.7 | ||
| Labour | Gwendoline Page | 1,179 | 26.0 | ||
| BNP | Suzy Cass | 806 | 17.8 | ||
| Conservative | Tony Homewood | 794 | 17.5 | ||
| Majority | 573 | 12.7 | |||
| Turnout | 4,531 | ||||
| Liberal Democrat hold | Swing | ||||
| Party | Candidate | Votes | % | ± | |
|---|---|---|---|---|---|
| Labour | Clive Tennant | 1,757 | 62.0 | ||
| Conservative | Mellisa Wan Omer | 1,077 | 38.0 | ||
| Majority | 680 | 24.0 | |||
| Turnout | 2,834 | ||||
| Labour hold | Swing | ||||
| Party | Candidate | Votes | % | ± | |
|---|---|---|---|---|---|
| Conservative | Geoffrey Walsh | 1,852 | 42.2 | ||
| Labour | James Nicholson | 1,810 | 41.2 | ||
| Independent | Clive Wigham | 730 | 16.6 | ||
| Majority | 42 | 1.0 | |||
| Turnout | 4,392 | ||||
| Conservative gain from Labour | Swing | ||||
| Party | Candidate | Votes | % | ± | |
|---|---|---|---|---|---|
| Labour | Laurie Harrison | 2,482 | 73.3 | ||
| Conservative | Sheila Scholes | 902 | 26.7 | ||
| Majority | 1,580 | 46.6 | |||
| Turnout | 3,384 | ||||
| Labour hold | Swing | ||||
| Party | Candidate | Votes | % | ± | |
|---|---|---|---|---|---|
| Labour | Jacqueline Williams | 1,246 | 33.5 | ||
| Conservative | Graham Ridler | 986 | 26.5 | ||
| BNP | Glenn Fothergill | 777 | 20.9 | ||
| Liberal Democrat | David Evans | 706 | 19.0 | ||
| Majority | 260 | 7.0 | |||
| Turnout | 3,715 | ||||
| Labour hold | Swing | ||||
| Party | Candidate | Votes | % | ± | |
|---|---|---|---|---|---|
| Labour | Olivia Rowley | 1,541 | 44.2 | ||
| Conservative | Andrew Pesterfield | 648 | 18.6 | ||
| Liberal Democrat | Ather Mohammed | 540 | 15.5 | ||
| BNP | Dawn Byrom | 528 | 15.1 | ||
| Socialist Alternative | Michael Griffiths | 231 | 6.6 | ||
| Majority | 893 | 25.6 | |||
| Turnout | 3,488 | ||||
| Labour hold | Swing | ||||
| Party | Candidate | Votes | % | ± | |
|---|---|---|---|---|---|
| Labour | Keith Rhodes | 1,356 | 38.9 | ||
| Conservative | Angela Holwell | 774 | 22.2 | ||
| Liberal Democrat | Douglas Dale | 621 | 17.8 | ||
| BNP | Graham Thewlis-Hardy | 609 | 17.5 | ||
| UKIP | Keith Wells | 128 | 3.7 | ||
| Majority | 582 | 16.7 | |||
| Turnout | 3,488 | ||||
| Labour hold | Swing | ||||
| Party | Candidate | Votes | % | ± | |
|---|---|---|---|---|---|
| Conservative | June Drysdale | 2,471 | 51.1 | ||
| Labour | Hazel Chowcat | 1,507 | 31.1 | ||
| Green | John Lumb | 861 | 17.8 | ||
| Majority | 964 | 20.0 | |||
| Turnout | 4,839 | ||||
| Conservative hold | Swing | ||||
| Party | Candidate | Votes | % | ± | |
|---|---|---|---|---|---|
| Conservative | Nadeen Ahmed | 1,315 | 29.4 | ||
| Independent | Norman Hazell | 1,298 | 29.0 | ||
| Labour | Charles Keith | 747 | 16.7 | ||
| BNP | Neville Poynton | 594 | 13.3 | ||
| Liberal Democrat | Stephen Huthall | 521 | 11.6 | ||
| Majority | 17 | 0.4 | |||
| Turnout | 4,475 | ||||
| Conservative gain from Independent | Swing | ||||
| Party | Candidate | Votes | % | ± | |
|---|---|---|---|---|---|
| Conservative | David Stone | 2,318 | 57.1 | ||
| Labour | Anthony Richardson | 1,241 | 30.6 | ||
| Liberal Democrat | Susan Morgan | 500 | 12.3 | ||
| Majority | 1,077 | 26.5 | |||
| Turnout | 4,059 | ||||
| Conservative hold | Swing | ||||
| Party | Candidate | Votes | % | ± | |
|---|---|---|---|---|---|
| Conservative | Betty Liles | 1,843 | 46.3 | ||
| Labour | Rosaline Lund | 1,410 | 35.4 | ||
| BNP | Grant Rowe | 728 | 18.3 | ||
| Majority | 433 | 10.9 | |||
| Turnout | 3,981 | ||||
| Conservative gain from Labour | Swing | ||||
References
- ↑ "Local elections: Wakefield". BBC News Online. Retrieved 2009-12-09.
- 1 2 "Local elections". The Times. 2006-05-06. p. 64.
- 1 2 "UK's eyes on us as council faces the litmus test". Yorkshire Evening Post. 2006-04-05.
- ↑ "Parties battle to regain control". BBC News Online. 2006-04-27. Retrieved 2009-12-09.
- 1 2 3 4 5 "Coalition keeps its grip on city". Yorkshire Evening Post. 2006-05-06.
- ↑ "No surprises in election results". BBC News Online. 2006-05-05. Retrieved 2009-12-09.
- ↑ "Tories gain Wakefield seats". Wakefield Express. 2006-05-05. Retrieved 2009-12-09.
- ↑ "Stalwart is ousted in elections". Wakefield Express. 2006-05-05. Retrieved 2009-12-09.
- 1 2 3 4 5 6 7 8 9 10 11 12 13 14 15 16 17 18 19 20 21 22 "Local Election Results May 2006". Wakefield Metropolitan District Council. Archived from the original on 27 September 2006. Retrieved 2009-12-09.
- 1 2 3 4 5 6 7 8 9 10 11 12 13 14 15 16 17 18 19 20 21 22 "Local election results 2006". Yorkshire Evening Post. 2006-05-06.
| City of Bradford Metropolitan District Council | |
|---|---|
| Calderdale Metropolitan Borough Council | |
| Kirklees Metropolitan Borough Council | |
| Leeds City Council | |
| Wakefield Metropolitan District Council | |
| West Yorkshire County Council | |
| West Riding County Council | |
| |