Leeds City Council election, 2002
The Leeds City Council election took place on 2 May 2002 to elect members of City of Leeds Metropolitan Borough Council in West Yorkshire, England. Prior to the election, there had been several by-elections held with no change to the council composition. One third of the council was up for election and the Labour party stayed in overall control of the council.[1]
Campaign
33 seats were contested in the election with Labour defending 23 seats, the Conservatives 5, Liberal Democrats 4 and 1 independent.[2] Among the candidates who stood in the election was, Mark Collett, the leader of the youth wing of the British National Party, who stood in Harehills ward.[2]
Among the issued raised in the election were disaffection with the national Labour government, a recent reversed decision by the council to close day car centres for the elderly, privatisation of services, investment levels in schools and council tax levels.[3] Labour defended their record in control of the council, which they had run for the previous 22 years, in what was expected to be a hard fought contest.[4]
Election result
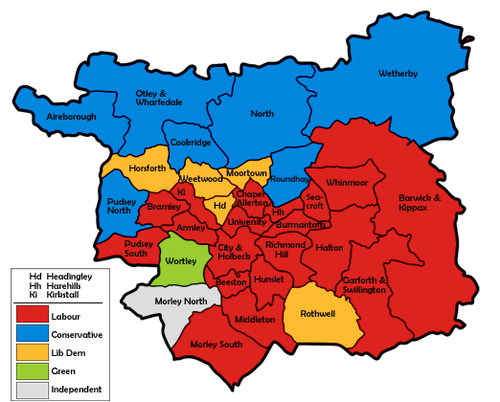
The results saw Labour maintain a majority on the council despite losing some seats to other parties.[5] They lost 2 seats to the Conservatives in Aireborough and Otley and Wharfedale, 2 to the Liberal Democrats in Headingley and Rothwell, and one each to an Independent in Morley North and the Greens in Wortley.[6] However Labour did gain one seat from the Liberal Democrats in Harehills and one in Hunslet from an Independent Socialist.[6] As a result, they won 19 of the 33 seats contested meaning they had 57 of the 99 councillors on Leeds council.[6] Overall turnout in the election was 30.64%.[7]
| Leeds Local Election Result 2002[6][8] | ||||||||||
|---|---|---|---|---|---|---|---|---|---|---|
| Party | Seats | Gains | Losses | Net gain/loss | Seats % | Votes % | Votes | +/− | ||
| Labour | 19 | 2 | 6 | -4 | 57.6 | 41.4 | 68,049 | +2.2% | ||
| Conservative | 7 | 2 | 0 | +2 | 21.2 | 29.2 | 47,947 | -3.1% | ||
| Liberal Democrat | 5 | 2 | 1 | +1 | 15.2 | 22.3 | 36,749 | -0.5% | ||
| Green | 1 | 1 | 0 | +1 | 3.0 | 4.5 | 7,332 | +0.5% | ||
| Independent | 1 | 1 | 0 | +1 | 3.0 | 1.4 | 2,228 | +0.9% | ||
| Leeds Left Alliance | 0 | 0 | 0 | 0 | 0 | 0.8 | 1,265 | -0.1% | ||
| Socialist Alliance | 0 | 0 | 0 | 0 | 0 | 0.2 | 392 | +0.2% | ||
| BNP | 0 | 0 | 0 | 0 | 0 | 0.1 | 209 | +0.0% | ||
| Socialist Alternative | 0 | 0 | 0 | 0 | 0 | 0.1 | 201 | +0.0% | ||
| Socialist Labour | 0 | 0 | 0 | 0 | 0 | 0.05 | 77 | +0.05% | ||
This result had the following consequences for the total number of seats on the council after the elections:[9]
| Party | Previous council | New council | |||
|---|---|---|---|---|---|
| Labour | 61 | 57 | |||
| Liberal Democrat | 19 | 20 | |||
| Conservative | 16 | 18 | |||
| Green | 2 | 3 | |||
| Independent | 0 | 1 | |||
| Independent Socialist | 1 | 0 | |||
| Total | 99 | 99 | |||
| Working majority | 23 | 15 | |||
Ward results
| Party | Candidate | Votes | % | ± | |
|---|---|---|---|---|---|
| Conservative | Makhan Thakur | 3,113 | 44.4 | -2.7 | |
| Labour | Tony Addison | 2,646 | 37.7 | +0.7 | |
| Liberal Democrat | Ian Hutton | 1,256 | 17.9 | +2.0 | |
| Majority | 467 | 6.7 | -2.4 | ||
| Turnout | 7,015 | 37.9 | +4.0 | ||
| Conservative gain from Labour | Swing | -1.7 | |||
| Party | Candidate | Votes | % | ± | |
|---|---|---|---|---|---|
| Labour | Alison Lowe | 2,031 | 56.0 | +5.7 | |
| Conservative | Steven Welsh | 670 | 18.5 | -6.4 | |
| Green | Luke Russell | 468 | 12.9 | +5.7 | |
| Liberal Democrat | Barbara Thompson | 459 | 12.7 | -3.9 | |
| Majority | 1,361 | 37.5 | +12.1 | ||
| Turnout | 3,628 | 23.8 | +3.1 | ||
| Labour hold | Swing | +6.0 | |||
| Party | Candidate | Votes | % | ± | |
|---|---|---|---|---|---|
| Labour | John Parker | 3,908 | 55.8 | +5.9 | |
| Conservative | Alec Shellbrooke | 2,218 | 31.6 | -5.1 | |
| Liberal Democrat | Anne Bagnall | 607 | 8.7 | -4.7 | |
| Green | Elizabeth Holmes | 198 | 2.8 | +2.8 | |
| Socialist Labour | Paul Dewhirst | 77 | 1.1 | +1.1 | |
| Majority | 1,690 | 24.2 | +9.0 | ||
| Turnout | 7,008 | 38.3 | +7.4 | ||
| Labour hold | Swing | +5.5 | |||
| Party | Candidate | Votes | % | ± | |
|---|---|---|---|---|---|
| Labour | Angela Gabriel | 1,763 | 51.2 | +5.4 | |
| Conservative | William Birch | 1,047 | 30.4 | -3.1 | |
| Liberal Democrat | Kathleen Fenton | 431 | 12.5 | -5.4 | |
| Socialist Alliance | Michael Dear | 102 | 3.0 | +3.0 | |
| Green | Janet Pritchard | 102 | 3.0 | +0.1 | |
| Majority | 716 | 20.8 | +8.5 | ||
| Turnout | 3,445 | 28.9 | +4.8 | ||
| Labour hold | Swing | +4.2 | |||
| Party | Candidate | Votes | % | ± | |
|---|---|---|---|---|---|
| Labour | Denise Atkinson | 2,044 | 52.7 | +13.1 | |
| Liberal Democrat | John Burke | 1,306 | 33.7 | -12.7 | |
| Conservative | Michael Best | 368 | 9.5 | -2.0 | |
| Green | Colin Avison | 160 | 4.1 | +1.7 | |
| Majority | 738 | 19.0 | +12.2 | ||
| Turnout | 3,878 | 23.9 | +2.9 | ||
| Labour hold | Swing | +12.9 | |||
| Party | Candidate | Votes | % | ± | |
|---|---|---|---|---|---|
| Labour | John Garvani | 1,608 | 46.8 | -16.2 | |
| Liberal Democrat | Ralph Pryke | 1,513 | 44.0 | +24.3 | |
| Conservative | Patricia Hyde | 211 | 6.1 | -7.7 | |
| Green | Simon Blanchard | 107 | 3.1 | +0.6 | |
| Majority | 95 | 2.8 | -40.5 | ||
| Turnout | 3,439 | 27.4 | +6.8 | ||
| Labour hold | Swing | -20.2 | |||
| Party | Candidate | Votes | % | ± | |
|---|---|---|---|---|---|
| Labour | Neil Taggart | 2,346 | 52.6 | +5.1 | |
| Leeds Left Alliance | Garth Frankland | 957 | 21.4 | -2.0 | |
| Conservative | Jacqueline Zander | 632 | 14.2 | +1.0 | |
| Liberal Democrat | Malcolm Silver | 527 | 11.8 | -4.1 | |
| Majority | 1,389 | 31.2 | +7.1 | ||
| Turnout | 4,462 | 31.4 | +0.5 | ||
| Labour hold | Swing | +3.5 | |||
| Party | Candidate | Votes | % | ± | |
|---|---|---|---|---|---|
| Labour | Patrick Davey | 1,856 | 61.6 | +5.4 | |
| Conservative | Richard Laycock | 640 | 21.2 | +2.8 | |
| Liberal Democrat | Sitara Khan | 317 | 10.5 | -5.2 | |
| Socialist Alternative | David Jones | 201 | 6.7 | +2.1 | |
| Majority | 1,216 | 40.4 | +2.6 | ||
| Turnout | 3,014 | 20.0 | +2.5 | ||
| Labour hold | Swing | +1.3 | |||
| Party | Candidate | Votes | % | ± | |
|---|---|---|---|---|---|
| Conservative | John Carter | 3,293 | 53.8 | +4.7 | |
| Labour | Ian McCargo | 1,397 | 22.8 | +2.7 | |
| Liberal Democrat | Janet Bates | 1,205 | 19.7 | -8.9 | |
| Green | Peter Scarth | 225 | 3.7 | +1.5 | |
| Majority | 1,896 | 31.0 | +10.5 | ||
| Turnout | 6,120 | 37.0 | +0.0 | ||
| Conservative hold | Swing | +1.0 | |||
| Party | Candidate | Votes | % | ± | |
|---|---|---|---|---|---|
| Labour | Karen Marshall | 3,244 | 51.6 | +0.9 | |
| Conservative | Robert Semple | 1,941 | 30.9 | +0.0 | |
| Liberal Democrat | Ian Dowling | 1,105 | 17.6 | -0.9 | |
| Majority | 1,303 | 20.7 | +0.9 | ||
| Turnout | 6,290 | 33.8 | +4.7 | ||
| Labour hold | Swing | +0.4 | |||
| Party | Candidate | Votes | % | ± | |
|---|---|---|---|---|---|
| Labour | Lee Benson | 2,640 | 43.4 | +3.6 | |
| Conservative | David Schofield | 2,500 | 41.1 | -6.4 | |
| Liberal Democrat | David Hollingsworth | 730 | 12.0 | -0.7 | |
| Green | Robert Murphy | 208 | 3.4 | +3.4 | |
| Majority | 140 | 2.3 | -5.4 | ||
| Turnout | 6,078 | 33.9 | +2.7 | ||
| Labour hold | Swing | +5.0 | |||
| Party | Candidate | Votes | % | ± | |
|---|---|---|---|---|---|
| Labour | Roger Harrington | 2,858 | 51.8 | +9.0 | |
| Liberal Democrat | Javaid Akhtar | 2,184 | 39.6 | -10.2 | |
| BNP | Mark Collett | 209 | 3.8 | +3.8 | |
| Conservative | Karl Steenson | 168 | 3.0 | -1.4 | |
| Green | Christopher Hudson | 99 | 1.8 | -0.3 | |
| Majority | 674 | 12.2 | +5.2 | ||
| Turnout | 5,518 | 40.5 | +9.0 | ||
| Labour gain from Liberal Democrat | Swing | +9.6 | |||
| Party | Candidate | Votes | % | ± | |
|---|---|---|---|---|---|
| Liberal Democrat | Martin Hamilton | 1,885 | 48.7 | +6.8 | |
| Labour | Doreen Illingworth | 1,154 | 29.8 | -7.7 | |
| Green | Lesley Jeffries | 390 | 10.1 | -0.5 | |
| Conservative | Daniel Riley | 289 | 7.5 | -2.5 | |
| Socialist Alliance | Katherine Owen | 156 | 4.0 | +4.0 | |
| Majority | 731 | 18.9 | +14.5 | ||
| Turnout | 3,874 | 18.8 | +2.5 | ||
| Liberal Democrat gain from Labour | Swing | +7.2 | |||
| Party | Candidate | Votes | % | ± | |
|---|---|---|---|---|---|
| Liberal Democrat | Christopher Townsley | 2,764 | 44.2 | +4.4 | |
| Conservative | Richard Hardcastle | 2,145 | 34.3 | -2.3 | |
| Labour | Ted Hanley | 1,110 | 17.8 | -2.7 | |
| Green | Andrea Binns | 230 | 3.7 | +0.6 | |
| Majority | 619 | 9.9 | +6.7 | ||
| Turnout | 6,249 | 36.0 | +3.8 | ||
| Liberal Democrat hold | Swing | +3.3 | |||
| Party | Candidate | Votes | % | ± | |
|---|---|---|---|---|---|
| Labour | Judith Blake | 1,535 | 68.2 | -2.3 | |
| Liberal Democrat | James Graham | 304 | 13.5 | -9.9 | |
| Conservative | Anthony Larvin | 279 | 12.4 | +12.4 | |
| Green | Francis Gray | 86 | 3.8 | -2.3 | |
| Socialist Alliance | James Jackson | 47 | 2.1 | +2.1 | |
| Majority | 1,231 | 54.7 | +7.6 | ||
| Turnout | 2,251 | 20.6 | +2.7 | ||
| Labour gain from Independent Socialist | Swing | +3.8 | |||
| Party | Candidate | Votes | % | ± | |
|---|---|---|---|---|---|
| Labour | Bernard Atha | 2,142 | 57.6 | -3.2 | |
| Liberal Democrat | Natasha De Vere | 587 | 15.8 | +1.9 | |
| Conservative | Ian Richmond | 508 | 13.7 | -3.8 | |
| Green | Martin Reed | 480 | 12.9 | +5.1 | |
| Majority | 1,555 | 41.8 | -1.5 | ||
| Turnout | 3,717 | 25.0 | +3.1 | ||
| Labour hold | Swing | -2.5 | |||
| Party | Candidate | Votes | % | ± | |
|---|---|---|---|---|---|
| Labour | David Langham | 2,052 | 63.6 | +4.4 | |
| Conservative | Robert Allen | 567 | 17.6 | -8.6 | |
| Liberal Democrat | Sadie Fisher | 422 | 13.1 | +1.4 | |
| Green | Patricia Capstick | 183 | 5.7 | +2.9 | |
| Majority | 1,485 | 46.0 | +13.0 | ||
| Turnout | 3,224 | 21.7 | +3.0 | ||
| Labour hold | Swing | +6.5 | |||
| Party | Candidate | Votes | % | ± | |
|---|---|---|---|---|---|
| Liberal Democrat | Brenda Lancaster | 3,132 | 55.2 | +5.4 | |
| Labour | Barry Young | 1,500 | 26.5 | +1.6 | |
| Conservative | Christopher Ingoldby | 907 | 16.0 | -5.6 | |
| Leeds Left Alliance | Michael Davies | 130 | 2.3 | +1.0 | |
| Majority | 1,632 | 28.7 | +3.8 | ||
| Turnout | 5,669 | 35.3 | +0.7 | ||
| Liberal Democrat hold | Swing | +1.9 | |||
| Party | Candidate | Votes | % | ± | |
|---|---|---|---|---|---|
| Independent | Robert Finnigan | 2,228 | 37.8 | +37.8 | |
| Labour | Graham Platt | 1,762 | 29.9 | -14.0 | |
| Conservative | Keely Jamieson | 1,351 | 22.9 | -17.9 | |
| Liberal Democrat | Christine Golton | 405 | 6.9 | -3.9 | |
| Green | Irene Dracup | 150 | 2.5 | -2.0 | |
| Majority | 466 | 7.9 | +4.8 | ||
| Turnout | 5,896 | 30.5 | +4.5 | ||
| Independent gain from Labour | Swing | +25.9 | |||
| Party | Candidate | Votes | % | ± | |
|---|---|---|---|---|---|
| Labour | Sherry Bradley | 2,631 | 53.2 | +2.0 | |
| Conservative | David Boynton | 1,433 | 29.0 | -2.7 | |
| Liberal Democrat | Rochelle Harris | 880 | 17.8 | +4.5 | |
| Majority | 1,198 | 24.2 | +4.7 | ||
| Turnout | 4,944 | 22.4 | +2.3 | ||
| Labour hold | Swing | +2.3 | |||
| Party | Candidate | Votes | % | ± | |
|---|---|---|---|---|---|
| Conservative | Ronnie Feldman | 2,996 | 45.7 | +5.6 | |
| Liberal Democrat | Judith Chapman | 2,312 | 35.3 | -8.0 | |
| Labour | Debra Coupar | 1,193 | 18.2 | +3.7 | |
| Leeds Left Alliance | Brian Jackson | 51 | 0.8 | +0.3 | |
| Majority | 684 | 10.4 | +7.1 | ||
| Turnout | 6,552 | 38.8 | +3.1 | ||
| Conservative hold | Swing | +6.8 | |||
| Party | Candidate | Votes | % | ± | |
|---|---|---|---|---|---|
| Conservative | Nigel Francis | 3,420 | 44.2 | +6.7 | |
| Labour | John Eveleigh | 2,268 | 29.3 | +5.5 | |
| Liberal Democrat | James Hoskins | 1,793 | 23.2 | -4.0 | |
| Green | Paul Marchant | 262 | 3.4 | +1.5 | |
| Majority | 1,152 | 14.9 | +4.6 | ||
| Turnout | 7,743 | 40.8 | +2.2 | ||
| Conservative gain from Labour | Swing | +0.6 | |||
| Party | Candidate | Votes | % | ± | |
|---|---|---|---|---|---|
| Conservative | Frank Robinson | 3,505 | 52.1 | -14.0 | |
| Labour | Michael King | 2,167 | 32.2 | +8.9 | |
| Liberal Democrat | Christine Wilson | 832 | 12.4 | +1.8 | |
| Green | Susan Turnbull | 220 | 3.3 | +3.3 | |
| Majority | 1,338 | 19.9 | -22.9 | ||
| Turnout | 6,724 | 37.7 | +3.2 | ||
| Conservative hold | Swing | -11.4 | |||
| Party | Candidate | Votes | % | ± | |
|---|---|---|---|---|---|
| Labour | Richard Lewis | 2,699 | 48.1 | +4.2 | |
| Conservative | Helen Widdas | 2,027 | 36.2 | -4.4 | |
| Liberal Democrat | Christine Glover | 648 | 11.6 | -0.9 | |
| Green | Yvonne Clarke | 233 | 4.2 | +1.2 | |
| Majority | 672 | 11.9 | +8.6 | ||
| Turnout | 5,607 | 33.3 | +6.2 | ||
| Labour hold | Swing | +4.3 | |||
| Party | Candidate | Votes | % | ± | |
|---|---|---|---|---|---|
| Labour | Eamonn McGee | 1,839 | 71.1 | +3.8 | |
| Liberal Democrat | Keith Norman | 406 | 15.7 | +0.7 | |
| Conservative | Michael Wheeler | 255 | 9.9 | -2.5 | |
| Socialist Alliance | Steven Skinner | 87 | 3.4 | +3.4 | |
| Majority | 1,433 | 55.4 | +3.1 | ||
| Turnout | 2,587 | 26.9 | +7.0 | ||
| Labour hold | Swing | +1.5 | |||
| Party | Candidate | Votes | % | ± | |
|---|---|---|---|---|---|
| Liberal Democrat | Keith Willey | 2,658 | 48.2 | +3.3 | |
| Labour | Alec Hudson | 2,253 | 40.8 | +1.8 | |
| Conservative | John Cowling | 606 | 11.0 | -5.1 | |
| Majority | 405 | 7.4 | +1.5 | ||
| Turnout | 5,517 | 34.1 | +6.0 | ||
| Liberal Democrat gain from Labour | Swing | +0.7 | |||
| Party | Candidate | Votes | % | ± | |
|---|---|---|---|---|---|
| Conservative | Peter Harrand | 2,675 | 41.0 | -3.3 | |
| Labour | Irene O'Grady | 2,586 | 39.7 | -0.8 | |
| Liberal Democrat | John Skinner | 900 | 13.8 | +2.7 | |
| Green | Colin Johnston | 233 | 3.6 | +1.0 | |
| Leeds Left Alliance | Malcolm Christie | 127 | 1.9 | +0.4 | |
| Majority | 89 | 1.3 | -2.5 | ||
| Turnout | 6,521 | 39.3 | +1.5 | ||
| Conservative hold | Swing | -1.2 | |||
| Party | Candidate | Votes | % | ± | |
|---|---|---|---|---|---|
| Labour | Michael Davey | 2,197 | 80.2 | +6.5 | |
| Liberal Democrat | Pauline Davies | 502 | 18.3 | +10.0 | |
| Conservative | Donald Townsley | 42 | 1.5 | -11.2 | |
| Majority | 1,695 | 61.9 | +0.9 | ||
| Turnout | 2,741 | 23.5 | +1.1 | ||
| Labour hold | Swing | -1.7 | |||
| Party | Candidate | Votes | % | ± | |
|---|---|---|---|---|---|
| Labour | Patrick Hall | 1,447 | 56.9 | -2.7 | |
| Liberal Democrat | Arif Hussain | 514 | 20.2 | +2.7 | |
| Conservative | Robert Winfield | 345 | 13.6 | +2.0 | |
| Green | Bluebell Eikonoklastes | 235 | 9.2 | +0.4 | |
| Majority | 933 | 36.7 | -5.4 | ||
| Turnout | 2,541 | 16.6 | +2.2 | ||
| Labour hold | Swing | -2.7 | |||
| Party | Candidate | Votes | % | ± | |
|---|---|---|---|---|---|
| Liberal Democrat | Stewart Golton | 2,515 | 44.7 | +4.0 | |
| Labour | Alex Sobel | 1,780 | 31.7 | -4.6 | |
| Conservative | Graham Castle | 985 | 17.5 | -1.3 | |
| Green | David Webb | 343 | 6.1 | +1.9 | |
| Majority | 735 | 13.0 | +8.6 | ||
| Turnout | 5,623 | 34.4 | +0.4 | ||
| Liberal Democrat hold | Swing | +4.3 | |||
| Party | Candidate | Votes | % | ± | |
|---|---|---|---|---|---|
| Conservative | John Proctor | 4,940 | 66.0 | -2.7 | |
| Labour | James Lewis | 1,581 | 21.1 | +2.0 | |
| Liberal Democrat | Edmund Conybeare | 960 | 12.8 | +0.6 | |
| Majority | 3,359 | 44.9 | -4.7 | ||
| Turnout | 7,481 | 36.6 | +2.6 | ||
| Conservative hold | Swing | -2.3 | |||
| Party | Candidate | Votes | % | ± | |
|---|---|---|---|---|---|
| Labour | Pauleen Grahame | 2,211 | 54.5 | +4.4 | |
| Conservative | Valerie Kendall | 1,370 | 33.8 | -3.9 | |
| Liberal Democrat | Michael Welby | 473 | 11.7 | -0.5 | |
| Majority | 841 | 20.7 | +8.3 | ||
| Turnout | 4,054 | 32.3 | +6.1 | ||
| Labour hold | Swing | +4.1 | |||
| Party | Candidate | Votes | % | ± | |
|---|---|---|---|---|---|
| Green | Ann Blackburn | 2,720 | 54.0 | -1.5 | |
| Labour | Malcolm Bedford | 1,601 | 31.8 | +3.8 | |
| Conservative | Glenn Broadbent | 501 | 9.9 | -2.4 | |
| Liberal Democrat | John Ewens | 217 | 4.3 | +0.1 | |
| Majority | 1,119 | 22.2 | -5.3 | ||
| Turnout | 5,039 | 29.7 | +1.6 | ||
| Green gain from Labour | Swing | -2.6 | |||
References
- ↑ "Leeds". BBC News Online. Retrieved 2010-02-14.
- 1 2 "Parties name election candidates". Yorkshire Evening Post. 2002-04-08. Retrieved 2010-02-17.
- ↑ "Opponents line-up for battle at polls". Yorkshire Evening Post. 2002-04-17. Retrieved 2010-02-17.
- ↑ "Parties set for a tight election battle in city". Yorkshire Evening Post. 2002-04-29. Retrieved 2010-02-17.
- ↑ Walker, David (2002-05-03). "Local Elections: Postal voting increases turnout by 28%: Ballots: Participation higher in BNP areas candidates". The Guardian. p. 9.
- 1 2 3 4 "Labour's grip loosened .. but stays strong". Yorkshire Evening Post. 2002-05-03. Retrieved 2010-02-17.
- 1 2 3 4 5 6 7 8 9 10 11 12 13 14 15 16 17 18 19 20 21 22 23 24 25 26 27 28 29 30 31 32 33 34 "Leeds City Council elections - May 2nd 2002" (PDF). Leeds City Council. Retrieved 2010-02-14.
- 1 2 3 4 5 6 7 8 9 10 11 12 13 14 15 16 17 18 19 20 21 22 23 24 25 26 27 28 29 30 31 32 33 34 "Leeds Election Results". Yorkshire Evening Post. 2002-05-03. Retrieved 2010-02-17.
- ↑ "Local Elections: Results". The Guardian. 2002-05-03. p. 9.
| City of Bradford Metropolitan District Council | |
|---|---|
| Calderdale Metropolitan Borough Council | |
| Kirklees Metropolitan Borough Council | |
| Leeds City Council | |
| Wakefield Metropolitan District Council | |
| West Yorkshire County Council | |
| West Riding County Council | |
| |