Leeds City Council election, 2015
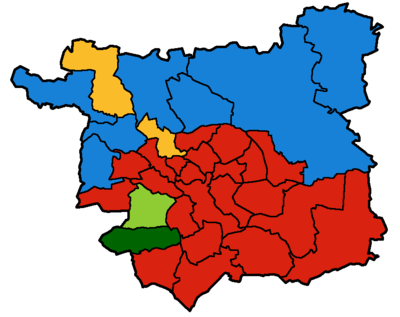
Map of the results of the 2015 Leeds council election.
The 2015 Leeds City Council election took place on 7 May 2015 to elect members of Leeds City Council in England.[1] This is on the same day as other local elections.
| Leeds City Council Election Result 2015[2] | ||||||||||
|---|---|---|---|---|---|---|---|---|---|---|
| Party | Seats | Gains | Losses | Net gain/loss | Seats % | Votes % | Votes | +/− | ||
| Labour | 22 | 0 | 0 | 0 | 66.7 | 39.8 | 141,856 | +1.2 | ||
| Conservative | 7 | 1 | 0 | +1 | 21.2 | 27.4 | 97,710 | +5.9 | ||
| UKIP | 0 | 0 | 0 | 0 | 0 | 12.9 | 45,953 | -3.8 | ||
| Green | 1 | 0 | 0 | 0 | 3.0 | 8.9 | 31,657 | -0.2 | ||
| Liberal Democrat | 2 | 0 | 0 | 0 | 6.1 | 8.4 | 29,955 | -1.8 | ||
| Morley Borough Independent | 1 | 0 | 0 | 0 | 3.0 | 1.9 | 6,794 | -0.6 | ||
| TUSC | 0 | 0 | 0 | 0 | 0 | 0.4 | 1,249 | +0.1 | ||
| Alliance for Green Socialism | 0 | 0 | 0 | 0 | 0 | 0.3 | 1,137 | -0.3 | ||
| Monster Raving Loony | 0 | 0 | 0 | 0 | 0 | 0.03 | 104 | +0.03 | ||
| Left Unity | 0 | 0 | 0 | 0 | 0 | 0.03 | 103 | +0.03 | ||
| A Voice for the Region | 0 | 0 | 0 | 0 | 0 | 0.02 | 70 | +0.02 | ||
| Independent | 0 | 0 | -1 | -1 | 0 | 0.0 | 0 | -0.3 | ||
This result had the following consequences for the total number of seats on the council after the elections:[2][3]
| Party | Previous council | New council | |||
|---|---|---|---|---|---|
| Labour | 63 | 63 | |||
| Conservative | 18 | 19 | |||
| Liberal Democrat | 9 | 9 | |||
| Morley Borough Independent | 5 | 5 | |||
| Green | 3 | 3 | |||
| Independent | 1 | 0 | |||
| Total | 99 | 99 | |||
| Working majority | 27 | 27 | |||
Ward results
The electoral division results listed below[2] are based on the changes from the 2011 elections,[4] not taking into account any mid-term by-elections or party defections.
| Party | Candidate | Votes | % | ± | |
|---|---|---|---|---|---|
| Conservative | Caroline Anderson | 5,534 | 46.1 | -4.1 | |
| Liberal Democrat | Cheryl Kebede | 2,611 | 21.8 | +0.5 | |
| Labour | Mark Henley | 2,236 | 18.6 | -2.0 | |
| UKIP | Malcolm Steele | 926 | 7.7 | +3.9 | |
| Green | Emma Carter | 696 | 5.8 | +1.7 | |
| Majority | 2,923 | 24.4 | -4.5 | ||
| Turnout | 12,003 | 75.2 | |||
| Conservative hold | Swing | -2.3 | |||
| Party | Candidate | Votes | % | ± | |
|---|---|---|---|---|---|
| Conservative | Dan Cohen | 6,472 | 51.4 | -1.9 | |
| Labour | Keith White | 3,907 | 31.0 | -4.4 | |
| UKIP | Carl McGuire | 943 | 7.5 | +0.6 | |
| Liberal Democrat | Simon Dowling | 698 | 5.5 | +5.5 | |
| Green | Miriam Moss | 471 | 3.7 | +3.7 | |
| Alliance for Green Socialism | Brian Jackson | 97 | 0.8 | -3.6 | |
| Majority | 2,565 | 20.4 | +2.5 | ||
| Turnout | 12,588 | 70.3 | |||
| Conservative hold | Swing | +1.2 | |||
| Party | Candidate | Votes | % | ± | |
|---|---|---|---|---|---|
| Labour | Jack Dunn | 4,301 | 39.5 | -9.2 | |
| Conservative | Timothy Atkin | 3,582 | 32.9 | +9.4 | |
| UKIP | David Daniel | 2,238 | 20.5 | +13.9 | |
| Green | Jude Omidiran | 399 | 3.7 | +3.7 | |
| Liberal Democrat | Victoria Bishop-Rowe | 373 | 3.4 | -2.8 | |
| Majority | 719 | 6.6 | -18.5 | ||
| Turnout | 10,893 | 62.3 | |||
| Labour hold | Swing | -9.3 | |||
| Party | Candidate | Votes | % | ± | |
|---|---|---|---|---|---|
| Labour | Jim McKenna | 4,612 | 48.3 | -14.5 | |
| UKIP | Dave Caldwell | 2,040 | 21.3 | +21.3 | |
| Conservative | Shane Mogan | 1,314 | 13.7 | -2.9 | |
| Green | Nick Crawley | 1,108 | 11.6 | -2.7 | |
| Liberal Democrat | Christine Glover | 381 | 4.0 | -3.0 | |
| TUSC | Carole O'Keefe | 103 | 1.1 | +1.1 | |
| Majority | 2,572 | 26.9 | -19.4 | ||
| Turnout | 9,558 | 54.6 | |||
| Labour hold | Swing | -17.9 | |||
| Party | Candidate | Votes | % | ± | |
|---|---|---|---|---|---|
| Labour | Adam Ogilvie | 4,335 | 53.1 | -8.2 | |
| UKIP | Tony Roberts | 1,876 | 23.0 | +13.9 | |
| Conservative | Robert Winfield | 1,158 | 14.2 | -3.6 | |
| Green | Emma Jaynes | 480 | 5.9 | -0.7 | |
| Liberal Democrat | Kathryn Gagen | 200 | 2.4 | -2.8 | |
| TUSC | Amy Cousens | 119 | 1.5 | +1.5 | |
| Majority | 2,459 | 30.1 | -13.4 | ||
| Turnout | 8,168 | 53.7 | |||
| Labour hold | Swing | -11.1 | |||
| Party | Candidate | Votes | % | ± | |
|---|---|---|---|---|---|
| Labour | Julie Haselwood | 4,267 | 45.8 | -15.0 | |
| UKIP | Anne Murgatroyd | 2,103 | 22.6 | +22.6 | |
| Conservative | Alexander Nancolas | 1,708 | 18.3 | -1.9 | |
| Green | Kate Bisson | 791 | 8.5 | -1.5 | |
| Liberal Democrat | Serena Glover | 389 | 4.2 | -4.8 | |
| TUSC | Kevin Pattison | 60 | 0.6 | +0.6 | |
| Majority | 2,164 | 23.2 | -17.3 | ||
| Turnout | 9,318 | 57.3 | |||
| Labour hold | Swing | -18.8 | |||
| Party | Candidate | Votes | % | ± | |
|---|---|---|---|---|---|
| Labour | Asghar Khan | 4,222 | 53.8 | +2.2 | |
| UKIP | Geoff Holloran | 1,622 | 20.7 | +20.7 | |
| Liberal Democrat | David Hollingsworth | 737 | 9.4 | -27.1 | |
| Conservative | Hayley Nancolas | 715 | 9.1 | +4.5 | |
| Green | Neil Seepujak | 400 | 5.1 | -2.2 | |
| TUSC | James Ellis | 150 | 1.9 | +1.9 | |
| Majority | 2,600 | 33.1 | +18.0 | ||
| Turnout | 7,846 | 50.9 | |||
| Labour hold | Swing | -9.3 | |||
| Party | Candidate | Votes | % | ± | |
|---|---|---|---|---|---|
| Conservative | Amanda Lesley Carter | 6,005 | 47.0 | -1.1 | |
| Labour | John James Bracken | 4,651 | 36.4 | -6.2 | |
| UKIP | Joe Murgatroyd | 1,119 | 8.8 | +8.8 | |
| Green | Clive Lord | 560 | 4.4 | +4.4 | |
| Liberal Democrat | Kate Arbuckle | 431 | 3.4 | -5.8 | |
| Majority | 1,354 | 10.6 | +5.1 | ||
| Turnout | 12,766 | 71.2 | |||
| Conservative hold | Swing | +2.6 | |||
| Party | Candidate | Votes | % | ± | |
|---|---|---|---|---|---|
| Labour | Mohammed Rafique | 6,467 | 58.0 | -5.6 | |
| Conservative | Farzana Arif | 1,692 | 15.2 | +1.8 | |
| Green | Mags Shevlin | 1,568 | 14.1 | +6.6 | |
| Liberal Democrat | Mark Harris | 876 | 7.9 | +0.2 | |
| Alliance for Green Socialism | Mike Davies | 555 | 5.0 | -2.8 | |
| Majority | 4,775 | 42.8 | -7.4 | ||
| Turnout | 11,158 | 62.7 | |||
| Labour hold | Swing | -3.7 | |||
| Party | Candidate | Votes | % | ± | |
|---|---|---|---|---|---|
| Labour | Patrick Davey | 5,292 | 44.9 | -17.8 | |
| Green | Ed Carlisle | 2,694 | 22.8 | +22.8 | |
| Conservative | Richard Salt | 2,320 | 19.6 | +2.6 | |
| UKIP | Khalil Kungulilo | 808 | 6.9 | +6.9 | |
| Liberal Democrat | Jahangir Aziz | 573 | 4.9 | -15.4 | |
| Monster Raving Loony | Christopher Worfolk | 104 | 0.9 | +0.9 | |
| Majority | 2,598 | 22.0 | -20.4 | ||
| Turnout | 11,791 | 53.9 | |||
| Labour hold | Swing | -20.3 | |||
| Party | Candidate | Votes | % | ± | |
|---|---|---|---|---|---|
| Labour | Pauleen Grahame | 5,012 | 45.8 | -11.1 | |
| Conservative | David Schofield | 2,669 | 24.4 | +1.5 | |
| UKIP | Darren Oddy | 2,363 | 21.6 | +13.7 | |
| Green | Ben Goldthorpe | 489 | 4.5 | +0.6 | |
| Liberal Democrat | Kate Langwick | 400 | 3.7 | -0.5 | |
| Majority | 2,343 | 21.4 | -12.6 | ||
| Turnout | 10,933 | 61.5 | |||
| Labour hold | Swing | -6.3 | |||
| Party | Candidate | Votes | % | ± | |
|---|---|---|---|---|---|
| Green | Ann Blackburn | 3,851 | 36.8 | -10.6 | |
| Labour | John Hardy | 3,208 | 30.6 | -6.7 | |
| UKIP | Gregory McDougall | 1,991 | 19.0 | +19.0 | |
| Conservative | Mohammed Rahman | 1,156 | 11.0 | -1.2 | |
| Liberal Democrat | Robert Jacques | 212 | 2.0 | -1.2 | |
| TUSC | Maddy Steeds | 58 | 0.6 | +0.6 | |
| Majority | 643 | 6.1 | -4.1 | ||
| Turnout | 10,476 | 58.7 | |||
| Green hold | Swing | -2.0 | |||
| Party | Candidate | Votes | % | ± | |
|---|---|---|---|---|---|
| Labour | Mark Dobson | 6,737 | 57.2 | -6.9 | |
| Conservative | Daniel Farrell | 3,137 | 26.7 | -5.7 | |
| UKIP | Mark Maniatt | 1,297 | 11.0 | +11.0 | |
| Green | Lesley Jeffries | 327 | 2.8 | +2.8 | |
| Liberal Democrat | Mitch Galdas | 270 | 2.3 | -1.1 | |
| Majority | 3,600 | 30.6 | -1.1 | ||
| Turnout | 11,768 | 72.4 | |||
| Labour hold | Swing | -0.6 | |||
| Party | Candidate | Votes | % | ± | |
|---|---|---|---|---|---|
| Labour | Arif Hussain | 6,187 | 73.9 | -6.3 | |
| UKIP | Marvin Kushman | 904 | 10.8 | +10.8 | |
| Conservative | Joshua Harvey | 554 | 6.6 | -1.1 | |
| Liberal Democrat | Adam Douglas | 413 | 4.9 | -3.5 | |
| Green | Peter Phizacklea | 319 | 3.8 | +3.8 | |
| Majority | 5,283 | 63.1 | -8.6 | ||
| Turnout | 8,377 | 51.5 | |||
| Labour hold | Swing | -8.6 | |||
| Party | Candidate | Votes | % | ± | |
|---|---|---|---|---|---|
| Conservative | Paul Wadsworth | 6,268 | 46.6 | +3.8 | |
| Labour | Suzie Shepherd | 3,678 | 27.3 | -10.0 | |
| UKIP | Katherynne Taylor | 1,503 | 11.2 | +11.2 | |
| Liberal Democrat | Cindy Cleasby | 1,206 | 9.0 | -1.2 | |
| Green | Benjamin Hall | 799 | 5.9 | -1.0 | |
| Majority | 2,590 | 19.3 | +13.8 | ||
| Turnout | 13,454 | 73.5 | |||
| Conservative hold | Swing | +6.9 | |||
| Party | Candidate | Votes | % | ± | |
|---|---|---|---|---|---|
| Conservative | Rachael Procter | 7,103 | 60.8 | +1.3 | |
| Labour | Tosin Abbey-Philip | 2,035 | 17.4 | +1.8 | |
| UKIP | Ian Greenberg | 1,289 | 11.0 | -8.8 | |
| Liberal Democrat | Christine Golton | 638 | 5.5 | +1.3 | |
| Green | Janet Heath | 624 | 5.3 | +4.3 | |
| Majority | 5,068 | 43.4 | -2.5 | ||
| Turnout | 11,689 | 76.7 | |||
| Conservative hold | Swing | -0.3 | |||
| Party | Candidate | Votes | % | ± | |
|---|---|---|---|---|---|
| Labour | Neil Anthony | 3,351 | 40.0 | +0.4 | |
| Green | Joe Salmon | 2,647 | 31.6 | +14.0 | |
| Conservative | Diane Fox | 1,043 | 12.4 | +2.9 | |
| Liberal Democrat | Penny Goodman | 1,038 | 12.4 | -15.9 | |
| UKIP | Claire Wilson-Sharp | 162 | 1.9 | +0.9 | |
| TUSC | Iain Dalton | 76 | 0.9 | -1.4 | |
| A Voice for the Region | Bob Buxton | 70 | 0.8 | +0.8 | |
| Majority | 704 | 8.4 | -2.9 | ||
| Turnout | 8,387 | 62.7 | |||
| Labour hold | Swing | -6.8 | |||
| Party | Candidate | Votes | % | ± | |
|---|---|---|---|---|---|
| Conservative | Dawn Julia Collins | 5,082 | 40.1 | +6.4 | |
| Labour | Jake Kelly | 3,081 | 24.3 | -3.6 | |
| Liberal Democrat | Martin Gareth Hughes | 2,480 | 19.5 | -11.5 | |
| UKIP | Paul Hellyer | 1,047 | 8.3 | +3.0 | |
| Green | Harriet Regina Barry | 873 | 6.9 | +6.9 | |
| TUSC | Gary McVeigh-Kaye | 125 | 1.0 | -1.1 | |
| Majority | 2,001 | 15.8 | +13.1 | ||
| Turnout | 12,688 | 73.1 | |||
| Conservative hold | Swing | +5.0 | |||
| Party | Candidate | Votes | % | ± | |
|---|---|---|---|---|---|
| Labour | Gerry Harper | 4,344 | 49.7 | -7.7 | |
| Green | Christopher Foren | 2,298 | 26.3 | +9.4 | |
| Conservative | Edward Hardy | 1,162 | 13.3 | +4.5 | |
| Liberal Democrat | Ellen Hudspith | 443 | 5.1 | -11.8 | |
| UKIP | Thomas Aitchinson | 379 | 4.3 | +4.3 | |
| TUSC | Tanis Belsham-Wray | 112 | 1.3 | +1.3 | |
| Majority | 2,046 | 23.4 | -17.0 | ||
| Turnout | 8,738 | 56.6 | |||
| Labour hold | Swing | -8.6 | |||
| Party | Candidate | Votes | % | ± | |
|---|---|---|---|---|---|
| Labour | Catherine Dobson | 4,792 | 54.8 | -18.7 | |
| UKIP | Phil Moore | 2,061 | 23.6 | +23.6 | |
| Conservative | Beatrice Greenwood | 1,235 | 14.1 | -2.5 | |
| Green | Louise Winrow | 350 | 4.0 | +4.0 | |
| Liberal Democrat | Joanne Binns | 304 | 3.5 | -6.4 | |
| Majority | 2,731 | 31.2 | -25.8 | ||
| Turnout | 8,742 | 53.2 | |||
| Labour hold | Swing | 21.2 | |||
| Party | Candidate | Votes | % | ± | |
|---|---|---|---|---|---|
| Labour | James Lewis | 5,639 | 49.5 | -13.8 | |
| Conservative | Thomas Crosfill | 2,878 | 25.3 | +3.6 | |
| UKIP | Tina Smith | 1,934 | 17.0 | +7.7 | |
| Green | Emma Dobson | 590 | 5.2 | +5.2 | |
| Liberal Democrat | Carmel Harrison | 344 | 3.0 | -2.7 | |
| Majority | 2,761 | 24.3 | -17.2 | ||
| Turnout | 11,385 | 69.5 | |||
| Labour hold | Swing | -8.7 | |||
| Party | Candidate | Votes | % | ± | |
|---|---|---|---|---|---|
| Labour | John Illingworth | 4,957 | 51.7 | -12.8 | |
| Green | Meadow Hudson | 1,755 | 18.3 | +8.9 | |
| Conservative | Matthew Wharton | 1,184 | 12.3 | +0.2 | |
| UKIP | Paul Denner | 1,017 | 10.6 | +10.6 | |
| Liberal Democrat | Johathan Heap | 548 | 5.7 | -5.6 | |
| TUSC | Dean Meehan | 133 | 1.4 | +1.4 | |
| Majority | 3,202 | 33.4 | -19.0 | ||
| Turnout | 9,594 | 61.6 | |||
| Labour hold | Swing | 10.9 | |||
| Party | Candidate | Votes | % | ± | |
|---|---|---|---|---|---|
| Labour | Judith Blake | 4,974 | 51.2 | -13.3 | |
| UKIP | Craig Sweaton | 2,921 | 30.1 | +30.1 | |
| Conservative | Zena Lopez | 1,199 | 12.3 | -0.9 | |
| Green | Fiona Love | 280 | 2.9 | +2.9 | |
| Liberal Democrat | Sadie Fisher | 237 | 2.4 | -2.5 | |
| Left Unity | Nick Jones | 103 | 1.1 | +1.1 | |
| Majority | 2,053 | 21.1 | -26.0 | ||
| Turnout | 9,714 | 51.0 | |||
| Labour hold | Swing | -21.7 | |||
| Party | Candidate | Votes | % | ± | |
|---|---|---|---|---|---|
| Labour | Rebecca Charlwood | 5,572 | 44.7 | +0.2 | |
| Conservative | Mark Dodsworth | 3,476 | 27.9 | +11.2 | |
| Liberal Democrat | Darren Finlay | 1,232 | 9.9 | -24.3 | |
| UKIP | Ian Laidlaw | 989 | 7.9 | +7.9 | |
| Green | Benjamin Hinchliffe | 979 | 7.9 | +7.9 | |
| Alliance for Green Socialism | Ros Campbell | 208 | 1.7 | -2.9 | |
| Majority | 2,096 | 16.8 | +6.5 | ||
| Turnout | 12,456 | 70.9 | |||
| Labour hold | Swing | -5.5 | |||
| Party | Candidate | Votes | % | ± | |
|---|---|---|---|---|---|
| Morley Borough Independent | Bob Gettings | 4,271 | 37.3 | -15.6 | |
| Labour | Mark Sewards | 2,505 | 21.9 | -1.3 | |
| Conservative | Sophie Tempest | 2,496 | 21.8 | +9.1 | |
| UKIP | Samuel Stead | 1,487 | 13.0 | +13.0 | |
| Green | Deborah Fenney | 354 | 3.1 | +3.1 | |
| Liberal Democrat | Peter Andrews | 263 | 2.3 | -0.6 | |
| TUSC | Karen Cussons | 78 | 0.7 | +0.7 | |
| Majority | 1,766 | 15.4 | -14.3 | ||
| Turnout | 11,454 | 64.9 | |||
| Morley Borough Independent hold | Swing | -7.2 | |||
| Party | Candidate | Votes | % | ± | |
|---|---|---|---|---|---|
| Labour | Neil Dawson | 3,071 | 30.5 | -2.9 | |
| Morley Borough Independent | Wyn Kidger | 2,523 | 25.0 | -7.6 | |
| Conservative | Kathleen Ann Tempest | 2,096 | 20.8 | +9.2 | |
| UKIP | Lindon Dove | 1,708 | 16.9 | +16.9 | |
| Green | Claire Hawker | 370 | 3.7 | +3.7 | |
| Liberal Democrat | John Durno MacArthur | 203 | 2.0 | -0.8 | |
| TUSC | Neil Cussons | 107 | 1.1 | +1.1 | |
| Majority | 548 | 5.4 | +4.6 | ||
| Turnout | 10,078 | 60.3 | |||
| Labour hold | Swing | +2.4 | |||
| Party | Candidate | Votes | % | ± | |
|---|---|---|---|---|---|
| Liberal Democrat | Colin Campbell | 4,347 | 35.5 | -3.1 | |
| Labour | John Eveleigh | 3,193 | 26.1 | -10.6 | |
| Conservative | John Bale | 2,200 | 18.0 | -6.7 | |
| UKIP | Tom Hollings | 1,396 | 11.4 | +11.4 | |
| Green | Mick Bradley | 1,098 | 9.0 | +9.0 | |
| Majority | 1,154 | 9.4 | +7.5 | ||
| Turnout | 12,234 | 69.5 | |||
| Liberal Democrat hold | Swing | +3.8 | |||
| Party | Candidate | Votes | % | ± | |
|---|---|---|---|---|---|
| Labour | Richard Lewis | 4,935 | 41.6 | -11.8 | |
| Conservative | Simon Seary | 4,266 | 35.9 | +7.0 | |
| UKIP | Roger Tattersall | 1,613 | 13.6 | +4.3 | |
| Green | Claire Allen | 629 | 5.3 | +0.6 | |
| Liberal Democrat | Jude Arbuckle | 354 | 3.0 | -0.8 | |
| TUSC | Michael Johnson | 72 | 0.6 | +0.6 | |
| Majority | 669 | 5.6 | -18.9 | ||
| Turnout | 11,869 | 68.1 | |||
| Labour hold | Swing | -9.4 | |||
| Party | Candidate | Votes | % | ± | |
|---|---|---|---|---|---|
| Labour | Karen Bruce | 4,206 | 38.6 | -7.5 | |
| Conservative | Steve Ellis | 2,715 | 24.9 | +8.7 | |
| Liberal Democrat | Ben Ward | 2,133 | 19.6 | -18.1 | |
| UKIP | Paul Spivey | 1,447 | 13.3 | +13.3 | |
| Green | Stephen Paul Terry | 408 | 3.7 | +3.7 | |
| Majority | 1,491 | 13.7 | +5.3 | ||
| Turnout | 10,909 | 68.7 | |||
| Labour hold | Swing | -8.1 | |||
| Party | Candidate | Votes | % | ± | |
|---|---|---|---|---|---|
| Labour | Christine MacNiven | 6,178 | 49.6 | -0.7 | |
| Conservative | Andy Paraskos | 3,506 | 28.1 | -5.2 | |
| Green | Paul Ellis | 1,021 | 8.2 | +1.5 | |
| UKIP | Warren Hendon | 773 | 6.2 | +6.2 | |
| Liberal Democrat | Najeeb Iqbal | 702 | 5.6 | -1.1 | |
| Alliance for Green Socialism | Malcolm Christie | 277 | 2.2 | -1.0 | |
| Majority | 2,672 | 21.4 | +4.4 | ||
| Turnout | 12,457 | 71.5 | |||
| Labour hold | Swing | +2.3 | |||
| Party | Candidate | Votes | % | ± | |
|---|---|---|---|---|---|
| Labour | Helen Hayden | 4,493 | 42.9 | -11.5 | |
| Conservative | Elizabeth Hayes | 3,059 | 29.2 | -9.6 | |
| UKIP | Bruce Naylor | 2,097 | 20.0 | +20.0 | |
| Liberal Democrat | Keith Norman | 420 | 4.0 | -2.8 | |
| Green | Nathan Allen | 401 | 3.8 | +3.8 | |
| Majority | 1,434 | 13.7 | -1.8 | ||
| Turnout | 10,470 | 63.6 | |||
| Labour hold | Swing | -1.0 | |||
| Party | Candidate | Votes | % | ± | |
|---|---|---|---|---|---|
| Liberal Democrat | Sue Bentley | 3,790 | 35.3 | -3.8 | |
| Labour | Alison Garthwaite | 2,901 | 27.0 | -4.1 | |
| Conservative | Dorothy Flynn | 1,802 | 16.7 | -2.6 | |
| Green | Martin Hemingway | 1,400 | 13.0 | +4.0 | |
| UKIP | Mike Cullen | 812 | 7.5 | +7.5 | |
| TUSC | Max Cussons | 56 | 0.5 | +0.5 | |
| Majority | 889 | 8.3 | +0.3 | ||
| Turnout | 10,761 | 68.2 | |||
| Liberal Democrat hold | Swing | +0.2 | |||
| Party | Candidate | Votes | % | ± | |
|---|---|---|---|---|---|
| Conservative | Alan Lamb | 6,924 | 58.4 | -1.5 | |
| Labour | John Lynch | 2,517 | 21.2 | -4.6 | |
| UKIP | Bronwen Cole | 1,085 | 9.1 | +2.5 | |
| Liberal Democrat | Sara Howell | 709 | 6.0 | -1.7 | |
| Green | Sam Murrey | 631 | 5.3 | +5.3 | |
| Majority | 4,407 | 37.1 | +2.9 | ||
| Turnout | 11,866 | 75.3 | |||
| Conservative hold | Swing | +1.6 | |||
References
- ↑ "Upcoming elections & referendums". The Electoral Commission. Archived from the original on 15 March 2015. Retrieved 23 March 2015.
- 1 2 3 "Election results - Local 2015". Leeds City Council. Retrieved 13 September 2015.
- ↑ Pantry, Lindsay; Roberts, John (8 May 2015). "Yorkshire's council election results in full: Success for Labour and Tories". Yorkshire Post.
- ↑ "Election results - Local 2011". Leeds City Council. Retrieved 10 April 2016.
| City of Bradford Metropolitan District Council | |
|---|---|
| Calderdale Metropolitan Borough Council | |
| Kirklees Metropolitan Borough Council | |
| Leeds City Council | |
| Wakefield Metropolitan District Council | |
| West Yorkshire County Council | |
| West Riding County Council | |
| |
This article is issued from Wikipedia - version of the 10/20/2016. The text is available under the Creative Commons Attribution/Share Alike but additional terms may apply for the media files.
