Sheffield City Council election, 1987
| | |||||||||||||||||||||||||||||||
| |||||||||||||||||||||||||||||||
| |||||||||||||||||||||||||||||||
|
| |||||||||||||||||||||||||||||||
| Map showing the results of the 1987 Sheffield City Council elections. | |||||||||||||||||||||||||||||||
| |||||||||||||||||||||||||||||||
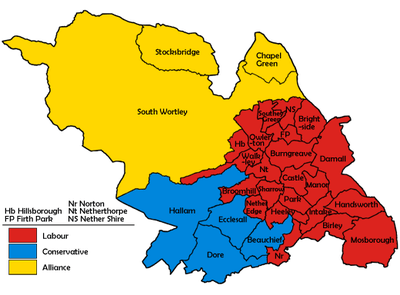
Elections to Sheffield City Council were held on 7 May 1987. One third of the council was up for election.
Election result
| Sheffield Local Election Result 1987 | ||||||||||
|---|---|---|---|---|---|---|---|---|---|---|
| Party | Seats | Gains | Losses | Net gain/loss | Seats % | Votes % | Votes | +/− | ||
| Labour | 23 | 2 | 0 | +2 | 74.2 | 51.1 | 87,584 | -2.5% | ||
| Conservative | 5 | 0 | 2 | -2 | 16.1 | 21.0 | 35,927 | +1.0% | ||
| SDP–Liberal Alliance | 3 | 0 | 0 | 0 | 9.7 | 27.7 | 47,444 | +2.4% | ||
| Green | 0 | 0 | 0 | 0 | 0.0 | 0.1 | 239 | -0.0% | ||
| Communist | 0 | 0 | 0 | 0 | 0.0 | 0.0 | 90 | +0.0% | ||
This result had the following consequences for the total number of seats on the Council after the elections:
| Party | Previous council | New council | |||
|---|---|---|---|---|---|
| Labour | 63 | 65 | |||
| Conservatives | 15 | 13 | |||
| SDP–Liberal Alliance | 9 | 9 | |||
| Total | 87 | 87 | |||
| Working majority | 39 | 43 | |||
Ward results
| Party | Candidate | Votes | % | ± | |
|---|---|---|---|---|---|
| Conservative | Clifford Godber | 2,972 | 36.7 | -2.9 | |
| SDP–Liberal Alliance | Peter Moore | 2,665 | 32.9 | +9.8 | |
| Labour | Roy Munn | 2,467 | 30.4 | -6.8 | |
| Majority | 307 | 3.8 | +1.4 | ||
| Turnout | 8,104 | 53.1 | +12.5 | ||
| Conservative hold | Swing | -6.3 | |||
| Party | Candidate | Votes | % | ± | |
|---|---|---|---|---|---|
| Labour | Joan Ramsbottom | 3,790 | 59.8 | -5.7 | |
| SDP–Liberal Alliance | Cyril Skipworth | 1,409 | 22.2 | +1.4 | |
| Conservative | Shirley Clayton | 1,139 | 18.0 | +4.4 | |
| Majority | 2,381 | 37.6 | -7.1 | ||
| Turnout | 6,338 | 39.2 | +5.2 | ||
| Labour hold | Swing | -3.5 | |||
| Party | Candidate | Votes | % | ± | |
|---|---|---|---|---|---|
| Labour | Patrick Heath | 2,912 | 71.1 | -4.9 | |
| SDP–Liberal Alliance | Francis Pierce | 702 | 17.1 | +1.5 | |
| Conservative | Simon Briggs | 479 | 11.7 | +3.3 | |
| Majority | 2,210 | 54.0 | -6.4 | ||
| Turnout | 4,093 | 31.7 | +2.2 | ||
| Labour hold | Swing | -3.2 | |||
| Party | Candidate | Votes | % | ± | |
|---|---|---|---|---|---|
| Labour | Jacqueline Mosley | 2,295 | 38.3 | -1.5 | |
| SDP–Liberal Alliance | Jane Padget | 1,868 | 31.2 | -0.4 | |
| Conservative | Richard Foster | 1,825 | 30.5 | +1.9 | |
| Majority | 427 | 7.1 | -1.1 | ||
| Turnout | 5,988 | 45.6 | +3.8 | ||
| Labour gain from Conservative | Swing | -0.5 | |||
| Party | Candidate | Votes | % | ± | |
|---|---|---|---|---|---|
| Labour | James Jamison | 3,009 | 66.5 | -13.1 | |
| SDP–Liberal Alliance | Sheila Rehman | 971 | 21.5 | +1.1 | |
| Conservative | Isobel Watson | 542 | 12.0 | +12.0 | |
| Majority | 2,038 | 45.0 | -14.2 | ||
| Turnout | 4,522 | 36.5 | +4.0 | ||
| Labour hold | Swing | -7.1 | |||
| Party | Candidate | Votes | % | ± | |
|---|---|---|---|---|---|
| Labour | David Skinner | 3,061 | 77.5 | -6.4 | |
| SDP–Liberal Alliance | Peter Horsfield | 463 | 11.7 | +1.8 | |
| Conservative | Joan Graham | 424 | 10.7 | +4.5 | |
| Majority | 2,598 | 65.8 | -8.2 | ||
| Turnout | 3,948 | 30.9 | +1.8 | ||
| Labour hold | Swing | -4.1 | |||
| Party | Candidate | Votes | % | ± | |
|---|---|---|---|---|---|
| SDP–Liberal Alliance | Geoffrey Griffiths | 4,508 | 54.2 | +6.4 | |
| Labour | Peter Duff | 3,245 | 39.0 | -6.7 | |
| Conservative | Kathryn Robinson | 559 | 6.7 | +0.3 | |
| Majority | 1,263 | 15.2 | +13.1 | ||
| Turnout | 8,312 | 46.9 | +8.0 | ||
| SDP–Liberal Alliance hold | Swing | +6.5 | |||
| Party | Candidate | Votes | % | ± | |
|---|---|---|---|---|---|
| Labour | Roy Hattersley | 3,278 | 63.3 | +21.2 | |
| SDP–Liberal Alliance | Dennis Boothroyd | 1,056 | 20.4 | -6.6 | |
| Conservative | Colin Cavill | 844 | 16.3 | +1.1 | |
| Majority | 2,222 | 42.9 | +27.8 | ||
| Turnout | 5,178 | 35.1 | +4.0 | ||
| Labour hold | Swing | +13.9 | |||
| Party | Candidate | Votes | % | ± | |
|---|---|---|---|---|---|
| Conservative | Patricia Davey | 4,114 | 51.5 | +2.1 | |
| Labour | Edward Lamb | 2,053 | 25.7 | -2.3 | |
| SDP–Liberal Alliance | Janice Sidebottom | 1,820 | 22.8 | +0.2 | |
| Majority | 2,061 | 25.8 | +4.4 | ||
| Turnout | 7,987 | 48.0 | +7.9 | ||
| Conservative hold | Swing | +2.2 | |||
| Party | Candidate | Votes | % | ± | |
|---|---|---|---|---|---|
| Conservative | Richard Old | 4,019 | 52.0 | +4.3 | |
| SDP–Liberal Alliance | Christine Freeman | 2,212 | 28.6 | -3.4 | |
| Labour | Roy Darke | 1,497 | 19.4 | -0.9 | |
| Majority | 1,807 | 23.4 | +7.7 | ||
| Turnout | 7,728 | 48.9 | +6.6 | ||
| Conservative hold | Swing | +3.8 | |||
| Party | Candidate | Votes | % | ± | |
|---|---|---|---|---|---|
| Labour | Howard Knight | 3,601 | 74.8 | -5.8 | |
| SDP–Liberal Alliance | Glyn Evans | 1,215 | 25.2 | +25.2 | |
| Majority | 1,486 | 49.6 | -19.0 | ||
| Turnout | 4,816 | 35.7 | +4.9 | ||
| Labour hold | Swing | -15.5 | |||
| Party | Candidate | Votes | % | ± | |
|---|---|---|---|---|---|
| Conservative | Angela Knight | 3,810 | 49.5 | +9.0 | |
| Conservative | Nicholas Aslam | 3,799 | |||
| SDP–Liberal Alliance | John Knight | 2,388 | 31.0 | -3.9 | |
| SDP–Liberal Alliance | Andrew Milton | 2,308 | |||
| Labour | Kevin Mahoney | 1,495 | 19.4 | -5.1 | |
| Labour | James Prosser | 1,341 | |||
| Majority | 1,411 | 18.5 | +12.9 | ||
| Turnout | 7,693 | 44.8 | -4.1 | ||
| Conservative hold | Swing | ||||
| Conservative hold | Swing | +6.4 | |||
| Party | Candidate | Votes | % | ± | |
|---|---|---|---|---|---|
| Labour | Elsie Smith | 3,462 | 51.6 | -17.6 | |
| SDP–Liberal Alliance | Alice Smith | 2,602 | 38.8 | +23.3 | |
| Conservative | Marjorie Kirby | 620 | 9.2 | -4.4 | |
| Green | Roger Dunn | 23 | 0.3 | -1.3 | |
| Majority | 860 | 12.8 | -40.9 | ||
| Turnout | 6,707 | 44.2 | +10.0 | ||
| Labour hold | Swing | -20.4 | |||
| Party | Candidate | Votes | % | ± | |
|---|---|---|---|---|---|
| Labour | John Crowder | 3,359 | 57.9 | -0.7 | |
| SDP–Liberal Alliance | Douglas Oldfield | 1,220 | 21.0 | +1.1 | |
| Conservative | John Webster | 1,217 | 21.0 | +0.5 | |
| Majority | 2,139 | 36.9 | -1.2 | ||
| Turnout | 5,796 | 38.8 | +3.8 | ||
| Labour hold | Swing | -0.9 | |||
| Party | Candidate | Votes | % | ± | |
|---|---|---|---|---|---|
| Labour | John Buckley | 3,334 | 46.8 | -3.4 | |
| SDP–Liberal Alliance | Francis Butler | 2,370 | 33.3 | +2.3 | |
| Conservative | Michael Warner | 1,413 | 19.8 | +1.0 | |
| Majority | 964 | 13.5 | -5.7 | ||
| Turnout | 7,117 | 46.9 | +4.4 | ||
| Labour hold | Swing | -2.8 | |||
| Party | Candidate | Votes | % | ± | |
|---|---|---|---|---|---|
| Labour | Michael Bower | 3,499 | 59.0 | -2.2 | |
| Conservative | Elizabeth Bradbury | 1,253 | 21.1 | -1.0 | |
| SDP–Liberal Alliance | Sheila Hughes | 1,178 | 19.8 | +3.2 | |
| Majority | 2,246 | 37.9 | -1.2 | ||
| Turnout | 5,930 | 37.5 | +4.6 | ||
| Labour hold | Swing | -0.6 | |||
| Party | Candidate | Votes | % | ± | |
|---|---|---|---|---|---|
| Labour | Paul Colk | 2,921 | 79.2 | N/A | |
| SDP–Liberal Alliance | Pamela Brown | 429 | 11.6 | N/A | |
| Conservative | Robert Usher | 338 | 9.1 | N/A | |
| Majority | 2,492 | 67.6 | N/A | ||
| Turnout | 3,688 | N/A | |||
| Labour hold | Swing | N/A | |||
| Party | Candidate | Votes | % | ± | |
|---|---|---|---|---|---|
| Labour | Norman Sellars | 4,425 | 59.3 | -5.8 | |
| Conservative | Gordon Millward | 1,602 | 21.5 | +3.8 | |
| SDP–Liberal Alliance | Louise Truman | 1,430 | 19.2 | +2.0 | |
| Majority | 2,823 | 37.8 | -9.6 | ||
| Turnout | 7,457 | 35.6 | +6.7 | ||
| Labour hold | Swing | -4.8 | |||
| Party | Candidate | Votes | % | ± | |
|---|---|---|---|---|---|
| Labour | Patricia Midgley | 2,508 | 38.5 | -0.6 | |
| SDP–Liberal Alliance | George Manley | 1,919 | 29.4 | +2.7 | |
| Conservative | Paul Verhaert | 1,873 | 28.7 | -1.7 | |
| Green | Jane Beharrell | 216 | 3.3 | -0.4 | |
| Majority | 589 | 9.1 | +0.4 | ||
| Turnout | 6,516 | 46.3 | +2.4 | ||
| Labour gain from Conservative | Swing | -1.6 | |||
| Party | Candidate | Votes | % | ± | |
|---|---|---|---|---|---|
| Labour | Stephen Jones | 3,350 | 72.6 | -5.8 | |
| SDP–Liberal Alliance | George Clayton | 1,266 | 27.4 | +14.1 | |
| Majority | 2,084 | 45.2 | -19.9 | ||
| Turnout | 4,616 | 35.3 | +2.1 | ||
| Labour hold | Swing | -9.9 | |||
| Party | Candidate | Votes | % | ± | |
|---|---|---|---|---|---|
| Labour | Christopher Walker | 3,372 | 69.3 | -4.3 | |
| SDP–Liberal Alliance | Peter McNutt | 768 | 15.8 | -10.6 | |
| Conservative | Henry Cornford | 723 | 14.8 | +14.8 | |
| Majority | 2,604 | 53.5 | +6.3 | ||
| Turnout | 4,863 | 38.3 | +6.0 | ||
| Labour hold | Swing | +3.1 | |||
| Party | Candidate | Votes | % | ± | |
|---|---|---|---|---|---|
| Labour | Frank White | 3,617 | 59.4 | -4.3 | |
| Conservative | Albert Marsden | 1,371 | 22.5 | +4.4 | |
| SDP–Liberal Alliance | Ian Auckland | 1,104 | 18.1 | +0.0 | |
| Majority | 2,246 | 36.9 | -8.7 | ||
| Turnout | 6,092 | 44.9 | +5.8 | ||
| Labour hold | Swing | -4.3 | |||
| Party | Candidate | Votes | % | ± | |
|---|---|---|---|---|---|
| Labour | Helen Jackson | 3,251 | 68.6 | -5.4 | |
| SDP–Liberal Alliance | John Brocklebank | 883 | 18.6 | +3.8 | |
| Conservative | Lorna Banham | 602 | 12.7 | +1.6 | |
| Majority | 2,368 | 50.0 | -9.2 | ||
| Turnout | 4,736 | 36.2 | +6.3 | ||
| Labour hold | Swing | -4.6 | |||
| Party | Candidate | Votes | % | ± | |
|---|---|---|---|---|---|
| Labour | Vivienne Nicholson | 3,449 | 78.5 | -4.3 | |
| SDP–Liberal Alliance | Donald Smith | 492 | 11.2 | +1.7 | |
| Conservative | Jeremy Richardson | 454 | 10.3 | +2.6 | |
| Majority | 2,957 | 67.3 | -6.0 | ||
| Turnout | 4,395 | 31.2 | +6.5 | ||
| Labour hold | Swing | -3.0 | |||
| Party | Candidate | Votes | % | ± | |
|---|---|---|---|---|---|
| Labour | Doris Askham | 2,619 | 63.3 | -1.4 | |
| Conservative | Anne Smith | 780 | 18.8 | +3.5 | |
| SDP–Liberal Alliance | Muhammad Zahur | 649 | 15.7 | -1.5 | |
| Communist | Brian Turley | 90 | 2.2 | +0.5 | |
| Majority | 1,839 | 44.5 | -3.0 | ||
| Turnout | 4,138 | 33.9 | +2.7 | ||
| Labour hold | Swing | -2.4 | |||
| Party | Candidate | Votes | % | ± | |
|---|---|---|---|---|---|
| SDP–Liberal Alliance | David Baker | 4,191 | 48.7 | +1.0 | |
| Labour | Eldon Hanson | 2,667 | 31.0 | -5.1 | |
| Conservative | Lynn Wilson | 1,738 | 20.2 | +4.0 | |
| Majority | 524 | 17.7 | +6.1 | ||
| Turnout | 8,596 | 46.9 | +5.2 | ||
| SDP–Liberal Alliance hold | Swing | +3.0 | |||
| Party | Candidate | Votes | % | ± | |
|---|---|---|---|---|---|
| Labour | Anthony Damme | 3,632 | 81.3 | N/A | |
| SDP–Liberal Alliance | Raymond Mellor | 834 | 18.7 | N/A | |
| Majority | 2,798 | 62.6 | N/A | ||
| Turnout | 4,466 | 35.9 | N/A | ||
| Labour hold | Swing | N/A | |||
| Party | Candidate | Votes | % | ± | |
|---|---|---|---|---|---|
| SDP–Liberal Alliance | Malcolm Johnson | 2,590 | 53.0 | +5.4 | |
| Labour | Judith Chandler | 1,751 | 35.9 | -5.9 | |
| Conservative | Beryl Fleming | 540 | 11.0 | +0.5 | |
| Majority | 839 | 17.1 | +11.3 | ||
| Turnout | 4,881 | 46.3 | +8.1 | ||
| SDP–Liberal Alliance hold | Swing | +5.6 | |||
| Party | Candidate | Votes | % | ± | |
|---|---|---|---|---|---|
| Labour | Bill Owen | 3,665 | 55.7 | +1.8 | |
| Labour | Jean Cromar | 3,474 | |||
| SDP–Liberal Alliance | David Brown | 2,242 | 34.0 | -3.7 | |
| SDP–Liberal Alliance | Margaret Ritchie | 2,002 | |||
| Conservative | Giles Orton | 676 | 10.2 | +1.9 | |
| Conservative | Christine Smith | 635 | |||
| Majority | 1,232 | 21.7 | +5.5 | ||
| Turnout | 6,583 | 43.7 | +0.8 | ||
| Labour hold | Swing | ||||
| Labour hold | Swing | +2.7 | |||
References
| Metropolitan boroughs |
|
|---|---|
| District councils (England) |
|
| District councils (Wales) |
|
| |
| Barnsley Metropolitan Borough Council | |
|---|---|
| Doncaster Metropolitan Borough Council | |
| Rotherham Metropolitan Borough Council | |
| Sheffield City Council |
|
| South Yorkshire County Council |
|
| West Riding County Council | |
| |
This article is issued from Wikipedia - version of the 11/29/2016. The text is available under the Creative Commons Attribution/Share Alike but additional terms may apply for the media files.