Glacier mass balance
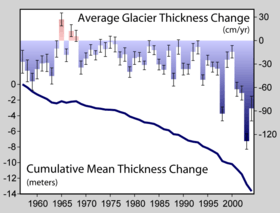

Crucial to the survival of a glacier is its mass balance or surface mass balance (SMB), the difference between accumulation and ablation (sublimation and melting). Climate change may cause variations in both temperature and snowfall, causing changes in the surface mass balance.[1] Changes in mass balance control a glacier's long-term behavior and are the most sensitive climate indicators on a glacier.[2] From 1980-2012 the mean cumulative mass loss of glaciers reporting mass balance to the World Glacier Monitoring Service is -16 m. This includes 23 consecutive years of negative mass balances.[2]

A glacier with a sustained negative balance is out of equilibrium and will retreat, while one with a sustained positive balance is out of equilibrium and will advance. Glacier retreat results in the loss of the low elevation region of the glacier. Since higher elevations are cooler than lower ones, the disappearance of the lowest portion of the glacier reduces overall ablation, thereby increasing mass balance and potentially reestablishing equilibrium. However, if the mass balance of a significant portion of the accumulation zone of the glacier is negative, it is in disequilibrium with the local climate. Such a glacier will melt away with a continuation of this local climate.[3] The key symptom of a glacier in disequilibrium is thinning along the entire length of the glacier.[4] For example, Easton Glacier (pictured below) will likely shrink to half its size, but at a slowing rate of reduction, and stabilize at that size, despite the warmer temperature, over a few decades. However, the Grinnell Glacier (pictured below) will shrink at an increasing rate until it disappears. The difference is that the upper section of Easton Glacier remains healthy and snow-covered, while even the upper section of the Grinnell Glacier is bare, melting and has thinned. Small glaciers with shallow slopes such as Grinnell Glacier are most likely to fall into disequilibrium if there is a change in the local climate.
In the case of positive mass balance, the glacier will continue to advance expanding its low elevation area, resulting in more melting. If this still does not create an equilibrium balance the glacier will continue to advance. If a glacier is near a large body of water, especially an ocean, the glacier may advance until iceberg calving losses bring about equilibrium.
Measurement methods


Mass balance
Mass balance is measured by determining the amount of snow accumulated during winter, and later measuring the amount of snow and ice removed by melting in the summer. The difference between these two parameters is the mass balance. If the amount of snow accumulated during the winter is larger than the amount of melted snow and ice during the summer, the mass balance is positive and the glacier has increased in volume. On the other hand, if the melting of snow and ice during the summer is larger than the supply of snow in the winter, the mass balance is negative and the glacier volume decreases. Mass balance is reported in meters of water equivalent. This represents the average thickness gained (positive balance) or lost (negative balance) from the glacier during that particular year.[5]
To determine mass balance in the accumulation zone, snowpack depth is measured using probing, snowpits or crevasse stratigraphy. Crevasse stratigraphy makes use of annual layers revealed on the wall of a crevasse.[6] Akin to tree rings, these layers are due to summer dust deposition and other seasonal effects. The advantage of crevasse stratigraphy is that it provides a two-dimensional measurement of the snowpack layer, not a point measurement. It is also usable in depths where probing or snowpits are not feasible. In temperate glaciers, the insertion resistance of a probe increases abruptly when its tip reaches ice that was formed the previous year. The probe depth is a measure of the net accumulation above that layer. Snowpits dug through the past winters residual snowpack are used to determine the snowpack depth and density. The snowpack's mass balance is the product of density and depth. Regardless of depth measurement technique the observed depth is multiplied by the snowpack density to determine the accumulation in water equivalent. It is necessary to measure the density in the spring as snowpack density varies. Measurement of snowpack density completed at the end of the ablation season yield consistent values for a particular area on temperate alpine glaciers and need not be measured every year. In the ablation zone, ablation measurements are made using stakes inserted vertically into the glacier either at the end of the previous melt season or the beginning of the current one. The length of stake exposed by melting ice is measured at the end of the melt (ablation) season. Most stakes must be replaced each year or even mid-way through the summer.

Net balance
Net balance is the mass balance determined between successive mass balance minimums. This is the stratigraphic method focusing on the minima representing a stratigraphic horizon. In the northern mid-latitudes, a glacier's year follows the hydrologic year, starting and ending near the beginning of October. The mass balance minimum is the end of the melt season. The net balance is then the sum of the observed winter balance (bw) normally measured in April or May and summer balance (bs) measured in September or early October.

Annual balance
Annual balance is the mass balance measured between specific dates. The mass balance is measured on the fixed date each year, again sometime near the start of October in the mid northern latitudes.[7]
Geodetic methods
Geodetic methods are an indirect method for the determination of mass balance of glacier. Maps of a glacier made at two different points in time can be compared and the difference in glacier thickness observed used to determine the mass balance over a span of years. This is best accomplished today using Differential Global Positioning System. Sometimes the earliest data for the glacier surface profiles is from images that are used to make topographical maps and digital elevation models. Aerial mapping or photogrammetry is now used to cover larger glaciers and icecaps such found in Antarctica and Greenland, however, because of the problems of establishing accurate ground control points in mountainous terrain, and correlating features in snow and where shading is common, elevation errors are typically not less than 10 m (32 ft).[8] Laser altimetry provides a measurement of the elevation of a glacier along a specific path, e.g., the glacier centerline. The difference of two such measurements is the change in thickness, which provides mass balance over the time interval between the measurements. Again a good method over a span of time but not for annual change detection. The value of geodetic programs is providing an independent check of traditional mass balance work, by comparing the cumulative changes over ten or more years.[9]
Mass balance research worldwide
Mass balance studies have been carried out in various countries worldwide, but have mostly conducted in the Northern Hemisphere due to there being more mid-latitude glaciers in that hemisphere. The World Glacier Monitoring Service annually compiles the mass balance measurements from around the world. From 2002-2006, continuous data is available for only 7 glaciers in the southern hemisphere and 76 glaciers in the Northern Hemisphere. The mean balance of these glaciers was its most negative in any year for 2005/06.[10] The similarity of response of glaciers in western North America indicates the large scale nature of the driving climate change.[11]
Alaska
The Taku Glacier near Juneau, Alaska has been studied by the Juneau Icefield Research Program since 1946, and is the longest continuous mass balance study of any glacier in North America. Taku is the world's thickest known temperate alpine glacier, and experienced positive mass balance between the years 1946 and 1988, resulting in a huge advance. The glacier has since been in a negative mass balance state, which may result in a retreat if the current trends continue.[12] The Juneau Icefield Research Program also has studied the mass balance of the Lemon Creek Glacier since 1953. The glacier has had an average annual balance of -0.44 m per year from 1953–2006, resulting in a mean loss of over 27 m of ice thickness. This loss has been confirmed by laser altimetry.[13]
Austrian Glacier Mass Balance
The mass balance of Hintereisferner and Kesselwandferner glaciers in Austria have been continuously monitored since 1952 and 1965 respectively. Having been continuously measured for 55 years, Hintereisferner has one of the longest periods of continuous study of any glacier in the world, based on measured data and a consistent method of evaluation. Currently this measurement network comprises about 10 snow pits and about 50 ablation stakes distributed across the glacier. In terms of the cumulative specific balances, Hintereisferner experienced a net loss of mass between 1952 and 1964, followed by a period of recovery to 1968. Hintereisferner reached an intermittent minimum in 1976, briefly recovered in 1977 and 1978 and has continuously lost mass in the 30 years since then. Total mass loss has been 26 m since 1952[14] Sonnblickkees Glacier has been measured since 1957 and the glacier has lost 12 m of mass, an average annual loss of -0.23 m per year.[15]
New Zealand
Glacier mass balance studies have been ongoing in New Zealand since 1957. Tasman Glacier has been studied since then by the New Zealand Geological Survey and later by the Ministry of Works, measuring the ice stratigraphy and overall movement. However, even earlier fluctuation patterns were documented on the Franz Josef and Fox Glaciers in 1950. Other glaciers on the South Island studied include Ivory Glacier since 1968, while on the North Island, glacier retreat and mass balance research has been conducted on the glaciers on Mount Ruapehu since 1955. On Mount Ruapehu, permanent photographic stations allow repeat photography to be used to provide photographic evidence of changes to the glaciers on the mountain over time.[16]
An aerial photographic survey of 50 glaciers in the South Island has been carried out for most years since 1977. The data was used to show that between 1976 and 2005 there was a 10% loss in glacier volume.[17]
North Cascade glacier mass balance program
The North Cascade Glacier Climate Project measures the annual balance of 10 glaciers, more than any other program in North America, to monitor an entire glaciated mountain range, which was listed as a high priority of the National Academy of Sciences in 1983. These records extend from 1984–2008 and represent the only set of records documenting the mass balance changes of an entire glacier clad range. North Cascade glaciers annual balance has averaged −0.48 m/a from 1984–2008, a cumulative thickness loss of over 13 m or 20–40% of their total volume since 1984 due to negative mass balances. The trend in mass balance is becoming more negative which is fueling more glacier retreat and thinning.[18]
Norway mass balance program
Norway maintains the most extensive mass balance program in the world and is largely funded by the hydropower industry. Mass balance measurements are currently (2012) performed on fifteen glaciers in Norway. In southern Norway six of the glaciers have been measured continuously since 1963 or earlier, and they constitute a west-east profile reaching from the maritime Ålfotbreen Glacier, close to the western coast, to the continental Gråsubreen Glacier, in the eastern part of Jotunheimen. Storbreen Glacier in Jotunheimen has been measured for a longer period of time than any other glacier in Norway, starting in 1949, while Engabreen Glacier at Svartisen has the longest series in northern Norway (starting in 1970). The Norwegian program is where the traditional methods of mass balance measurement were largely derived.[19]
Sweden Storglaciären
The Tarfala research station in the Kebnekaise region of northern Sweden is operated by Stockholm University. It was here that the first mass balance program was initiated immediately after World War II, and continues to the present day. This survey was the initiation of the mass balance record of Storglaciären Glacier, and constitutes the longest continuous study of this type in the world. Storglaciären has had a cumulative negative mass balance from 1946-2006 of -17 m. The program began monitoring the Rabots Glaciär in 1982, Riukojietna in 1985, and Mårmaglaciären in 1988. All three of these glaciers have had a strong negative mass balance since initiation.[20]
Iceland Glacier mass balance
Glacier mass balance is measured once or twice annually on numerous stakes on the several ice caps in Iceland by the National Energy Authority. Regular pit and stake mass-balance measurements have been carried out on the northern side of Hofsjökull since 1988 and likewise on the Þrándarjökull since 1991. Profiles of mass balance (pit and stake) have been established on the eastern and south-western side of Hofsjökull since 1989. Similar profiles have been assessed on the Tungnaárjökull, Dyngjujökull, Köldukvíslarjökull and Brúarjökull outlet glaciers of Vatnajökull since 1992 and the Eyjabakkajökull outlet glacier since 1991.[21]
Swiss mass balance program
Temporal changes in the spatial distribution of the mass balance result primarily from changes in accumulation and melt along the surface. As a consequence, variations in the mass of glaciers reflect changes in climate and the energy fluxes at the Earth's surface. The Swiss glaciers Gries in the central Alps and Silvretta in the eastern Alps, have been measured for many years. The distribution of seasonal accumulation and ablation rates are measured in-situ. Traditional field methods are combined with remote sensing techniques to track changes in mass, geometry and the flow behaviour of the two glaciers. These investigations contribute to the Swiss Glacier Monitoring Network and the International network of the World Glacier Monitoring Service (WGMS).[22]
United States Geological Survey (USGS)
The USGS operates a long-term "benchmark" glacier monitoring program which is used to examine climate change, glacier mass balance, glacier motion, and stream runoff. This program has been ongoing since 1965 and has been examining three glaciers in particular. Gulkana Glacier in the Alaska Range and Wolverine Glacier in the Coast Ranges of Alaska have both been monitored since 1965, while the South Cascade Glacier in Washington State has been continuously monitored since the International Geophysical Year of 1957. This program monitors one glacier in each of these mountain ranges, collecting detailed data to understand glacier hydrology and glacier climate interactions.[23]
Geological Survey of Canada-Glaciology Section (GSC)
The GSC operates Canada's Glacier-Climate Observing System as part of its Climate Change Geoscience Program. With its University partners, it conducts monitoring and research on glacier-climate changes, water resources and sea level change using a network of reference observing sites located in the Cordillera and the Canadian Arctic Archipelago. This network is augmented with remote sensing assessments of regional glacier changes. Sites in the Cordillera include the Helm, Place, Andrei, Kaskakwulsh, Haig, Peyto, Ram River, Castle Creek, Kwadacha and Bologna Creek Glaciers; in the Arctic Archipelago include the White, Baby and Grise Glaciers and the Devon, Meighen, Melville and Agassiz Ice Caps. GSC reference sites are monitored using the standard stake based glaciological method (stratigraphic) and periodic geodetic assessments using airborne lidar. Detailed information, contact information and database available here:[24] Helm Glacier (-33 m) and Place Glacier (-27 m) have lost more than 20% of their entire volume, since 1980, Peyto Glacier (-20 m) is close to this amount. The Canadian Arctic White Glacier has not been as negative at (-6 m) since 1980.
Bolivia mass balance network
The glacier monitoring network in Bolivia, a branch of the glacio-hydrological system of observation installed throughout the tropical Andes mountains by IRD and partners since 1991, has monitored mass balance on Zongo (6000 m asl), Chacaltaya (5400 m asl) and Charquini glaciers (5380 m asl). A system of stakes has been used, with frequent field observations, as often as monthly. These measurements have been made in concert with energy balance to identify the cause of the rapid retreat and mass balance loss of these tropical glaciers.[25]
PTAA-Mass balance model
A recently developed glacier balance model based on Monte Carlo principals is a promising supplement to both manual field measurements and geodetic methods of measuring mass balance using satellite images. The PTAA (precipitation-temperature-area-altitude) model requires only daily observations of precipitation and temperature collected at usually low-altitude weather stations, and the area-altitude distribution of the glacier.[26][27] Output are daily snow accumulation (Bc) and ablation (Ba) for each altitude interval, which is converted to mass balance by Bn = Bc - Ba. Snow Accumulation (Bc) is calculated for each area-altitude interval based on observed precipitation at one or more lower altitude weather stations located in the same region as the glacier and three coefficients that convert precipitation to snow accumulation. It is necessary to use established weather stations that have a long unbroken records so that annual means and other statistics can be determined. Ablation (Ba) is determined from temperature observed at weather stations near the glacier. Daily maximum and minimum temperatures are converted to glacier ablation using twelve coefficients.
The fifteen independent coefficients that are used to convert observed temperature and precipitation to ablation and snow accumulation apply a simplex optimizing procedure. The simplex automatically and simultaneously calculates values for each coefficient using Monte Carlo principals that rely on random sampling to obtain numerical results. Similarly, the PTAA model makes repeated calculations of mass balance, minutely re-adjusting the balance for each iteration.
The PTAA model has been tested for eight glaciers in Alaska, Washington, Austria and Nepal. Calculated annual balances are compared with measured balances for approximately 60 years for each of five glaciers. The Wolverine and Gulkana in Alaska, Hintereisferner, Kesselwandferner and Vernagtferner in Austria. It has also been applied to the Langtang Glacier in Nepal. Results for these tests are shown on the GMB (glacier mass balance) website at ptaagmb.com. Linear regressions of model versus manual balance measurements are based on a split-sample approach so that the calculated mass balances are independent of the temperature and precipitation used to calculate the mass balance.
Regression of model versus measured annual balances yield R2 values of 0.50 to 0.60. Application of the model to Bering Glacier in Alaska demonstrated a close agreement with ice volume loss for the 1972-2003 period measured with the geodetic method. Determining the mass balance and runoff of the partially debris-covered Langtang Glacier in Nepal demonstrates an application of this model to a glacier in the Himalayan Range.[28]
Correlation between ablation of glaciers in the Wrangell Range in Alaska and global temperatures observed at 7000 weather stations in the Northern Hemisphere indicates that glaciers are more sensitive to the global climate than are individual temperature stations, which do not show similar correlations.[29]
Validation of the model to demonstrate the response of glaciers in Northwestern United States to future climate change is shown in a hierarchical modeling approach.[30] Climate downscaling to estimate glacier mass using the PTAA model is applied to determine the balance of the Bering and Hubbard Glaciers and is also validated for the Gulkana, a USGS benchmark glacier.[31]
See also
References
- ↑ Mauri S. Pelto (Nichols College). "Glacier Mass Balance of North Cascade, Washington Glaciers 1984–2004". In "Hydrologic Processes". Retrieved February 27, 2008.
- 1 2 Michael Zemp, WGMS (September 9, 2008). "Glacier Mass Balance". World Glacier Monitoring Service.
- ↑ Mauri S. Pelto (Nichols College). "The Disequilibrium of North Cascade, Washington Glaciers 1984–2004". In "Hydrologic Processes". Retrieved February 14, 2006.
- ↑ Pelto, M.S. (2010). "Forecasting temperate alpine glacier survival from accumulation zone observations" (PDF). The Cryosphere. 4: 67–75. doi:10.5194/tc-4-67-2010. Retrieved February 9, 2010.
- ↑ Dyurgerov, M. (M. Meier and R. Armstrong, eds.). "Glacier mass balance and regime measurements and analysis, 1945–2003". Institute of Arctic and Alpine Research, University of Colorado. Distributed by National Snow and Ice Data Center, Boulder, CO. Retrieved 2002 (updated 2005). Check date values in:
|access-date=(help) - ↑ Mauri S. Pelto; Director NCGCP (March 9, 2008). "Glacier Mass Balance". North Cascade Glacier Climate Project.
- ↑ Mauri S. Pelto; Director NCGCP (March 28, 2006). "Glacier Mass Balance". North Cascade Glacier Climate Project.
- ↑ David Rippin; Ian Willis; Neil Arnold; Andrew Hodson; John Moore; Jack Kohler; Helgi Bjornsson (2003). "Changes in Geometry and Subglacial Drainage of Midre Lovénbreen, Svalbard, Determined from Digital Elevation Models" (PDF). Earth Surface Processes and Landforms. 28 (3): 273–298. doi:10.1002/esp.485.
- ↑ Andreas Bauder; G. Hilmar Gudmundsson (March 28, 2006). "Mass Balance Determination using Photogrammetric Methods and Numerical Flow Modeling". Laboratory of Hydraulics, Hydrology and Glaciology.
- ↑ "Glacier Mass Balance Bulletin". WGMS. Retrieved 2008-03-09.
- ↑ Pelto, Mauri. "Western North American Glacier Mass Balance 1984-2005, Equilibrium or Disequilibrium Response?" (PDF). Climate and Cryosphere. North Cascade Glacier Climate Project. Retrieved 2008-03-09.
- ↑ Pelto, Mauri; Matt Beedle; Maynard M. Miller. "Mass Balance Measurements of the Taku Glacier, Juneau Icefield, Alaska 1946-2005". Juneau Icefield Research Program. Retrieved 2007-01-09.
- ↑ "MASS BALANCE MEASUREMENTS ON THE LEMON CREEK GLACIER, JUNEAU ICEFIELD, ALASKA 1953-2005". Juneau Icefield Research Program. Retrieved 2009-06-09.
- ↑ "Mass balance of Hintereisferner". Institute for Meteorology and Geophysics, University of Innsbruck, Austria. January 20, 2004. Retrieved 2007-01-09.
- ↑ "GLACIER MASS BALANCE BULLETIN, Bulletin No. 9 (2004–2005)" (PDF). World glacier Monitoring Service, University of Zurich, Switzerland. 2007. Retrieved 2009-06-27.
- ↑ "Glaciers of New Zealand". Satellite Image Atlas of Glaciers of the World. U.S. Geological Survey. Retrieved 2007-01-16.
- ↑ Salinger, Jim; Chinn, Trevor; Willsman, Andrew; Fitzharris, Blair (September 2008). "Glacier response to climate change". Water & Atmosphere. NIWA. 16 (3). ISSN 1172-1014. Retrieved 25 October 2010.
- ↑ Pelto, Mauri (November 9, 2006). "Glacier Mass Balance". North Cascade Glacier Climate Project. Retrieved 2009-06-09.
- ↑ Norwegian Water Resources; Energy Directorate (March 28, 2006). "Mass balance measurements". Glaciological investigations in Norway.
- ↑ "Storglaciären". Stockholm University. February 9, 2003. Retrieved 2009-06-27.
- ↑ "Iceland". Iceland National Energy Authority. 2006. Archived from the original (PDF) on March 31, 2010. Retrieved 2008-03-09.
- ↑ Bauder, Andreas; Martin Funk (March 20, 2006). "Mass Balance Studies on Griesgletscher and Silvrettagletscher". The Swiss Glaciers. Laboratory of Hydraulics, Hydrology and Glaciology, Swiss Federal Institute of Technology. Archived from the original on 2006-12-31. Retrieved 2007-01-09.
- ↑ "Benchmark Glaciers". Water Resources of Alaska-Glacier and Snow Program. United States Geological Survey. July 9, 2004. Retrieved 2007-01-09.
- ↑ "State and Evolution of Canada's Glaciers". Glaciology Section. Geological Survey of Canada. June 30, 2009. Retrieved dead link May 2015. Check date values in:
|access-date=(help) - ↑ "Benchmark Glaciers". Institute of Hydraulics and Hydrology of Bolivia. Bernard Francou, Institut de Recherche pour le Développement (IRD. January 2001. Retrieved 2008-03-09.
- ↑ Tangborn, W.V., Using low-altitude meteorological observations to calculate the mass balance of Alaska’s Columbia Glacier and relate it to calving and speed. Report of a Workshop, February 28 – March 2, 1997, Byrd Polar Research Center, Report No. 15. Retrieved 2016-09-14.
- ↑ Tangborn, W.V., A Mass Balance Model that Uses Low-altitude Meteorological Observations and the Area–Altitude Distribution of a Glacier, Geografiska Annaler: Series A, Physical Geography, Volume 81, Issue 4, December 1999, Pages: 753–765. Retrieved 2016-09-14.
- ↑ Tangborn, W.V. and Rana, B., 2000, Mass Balance and Runoff of the Partially Debris-Covered Langtang Glacier, Nepal, presented as Debris-Covered Glaciers, Edited by M. Nakawa, C.F. Raymond, & A. Fountain, IAHS Publication 264. Retrieved 2016-09-14.
- ↑ Tangborn, W.V., Mass Balance, Runoff and Surges of Bering Glacier, Alaska. The Cryosphere 7,1-9. 2013. Retrieved 2016-09-14.
- ↑ Zhang J., U.S. Bhatt, W. V. Tangborn, and C.S. Lingle, 2007a: Response of Glaciers in Northwestern North America to Future Climate Change: an Atmosphere/Glacier Hierarchical Modeling Approach, Annals of Glaciology, Vol. 46, 283 – 290. Retrieved 2016-09-14.
- ↑ Zhang, J., U. S. Bhatt, W. V. Tangborn, and C. S. Lingle, 2007b: Climate downscaling for estimating glacier mass balances in northwestern North America: Validation with a USGS benchmark glacier, Geophysical Research Letters, 34, L21505, doi:10.1029/2007GL031139.
External links
| Wikimedia Commons has media related to Glaciers. |
- World Glacier Monitoring Service
- How does mass balance vary over Antarctica?
- An introduction to Glacier Mass Balance
