2004–05 Australian region cyclone season
| |
| Season summary map |
| First system formed |
30 August 2004 |
| Last system dissipated |
5 April 2005 |
| Strongest storm1 |
Ingrid – 924 hPa (mbar), 220 km/h (140 mph) (10-minute sustained) |
| Tropical lows |
13 |
| Tropical cyclones |
10 |
| Severe tropical cyclones |
4 |
| Total fatalities |
Unknown |
| Total damage |
Unknown |
| 1Strongest storm is determined by lowest pressure |
Australian region tropical cyclone seasons
2002–03, 2003–04, 2004–05, 2005–06, 2006–07 |
| Related articles |
|
|
The 2004–05 Australian region cyclone season was an event in the ongoing cycle of tropical cyclone formation. It began on 1 November 2004 and ended on 30 April 2005. The regional tropical cyclone operational plan also defines a tropical cyclone year separately from a tropical cyclone season, which runs from 1 July 2004 to 30 June 2005.
Tropical cyclones in this area are monitored by four Tropical Cyclone Warning Centres (TCWCs): the Australian Bureau of Meteorology in Perth, Darwin, and Brisbane; and TCWC Port Moresby in Papua New Guinea.[1]
Storms
Tropical Cyclone Phoebe
| Category 1 tropical cyclone (Australian scale) |
| Tropical storm (SSHWS) |
|
|
| Duration |
30 August – 5 September |
| Peak intensity |
85 km/h (50 mph) (10-min) 990 hPa (mbar) |
A tropical disturbance developed in the east of the region monitored by Réunion on 30 August, from an active monsoon band that coincided with a burst in the Madden–Julian oscillation. The system moved southeast and entered the Perth Tropical Cyclone Warning Centre's area of responsibility on 1 September.
The system was upgraded to Tropical Cyclone Phoebe early on 2 September when it was about 800 km west-northwest of the Cocos Islands. Phoebe quickly reached its peak strength that day, with winds of 85 km/h, as it continued to move to the southeast. The cyclone weakened as it moved over cooler water and dissipated about 550 km from the Cocos Islands. Phoebe posed no threat to any land.[2]
Tropical Low
| Tropical low (Australian scale) |
| Tropical storm (SSHWS) |
|
|
| Duration |
3 December – 5 December |
| Peak intensity |
55 km/h (35 mph) (10-min) 998 hPa (mbar) |
A tropical low developed in the Perth AOR on 2 December near the coast of Java. According to Perth, the storm had a maximum sustained winds of 30 knots (56 km/h), while the JTWC assigned the storm peak sustained winds of 35 knots (65 km/h) and classifying it as a tropical storm.
Tropical Cyclone Raymond
| Category 1 tropical cyclone (Australian scale) |
| Tropical storm (SSHWS) |
|
|
| Duration |
30 December – 10 January |
| Peak intensity |
85 km/h (50 mph) (10-min) 985 hPa (mbar) |
A tropical low developed from an area of convection of the Western Australia coast on 30 December. The system drifted southeast, then turned to the northeast over the following days without significant development. The low began to drift to the southeast again on 1 January and the convection began to increase, with it becoming Tropical Cyclone Raymond on 2 January, when it was 460 km north-northeast of Broome.
The cyclone peaked with 85 km/h winds as it moved east, and made landfall as a Category 1 cyclone just west of Kalumburu the same day. The cyclone weakened over land, and the remnant low continued east over the Northern Territory, entering the Gulf of Carpentaria on 5 January. The low reversed direction and dissipated by 10 January.[3] Cyclone Raymond caused no damage, but brought the first heavy rain of the reason to northern Kimberley.[4]
Tropical Cyclone Sally
| Category 2 tropical cyclone (Australian scale) |
| Tropical storm (SSHWS) |
|
|
| Duration |
7 January – 9 January |
| Peak intensity |
95 km/h (60 mph) (10-min) 985 hPa (mbar) |
A area of convection began to develop 930 km west-southwest of Jakarta on 6 January, becoming a tropical low the next day. The low intensified as it drifted south and was named Sally 370 km east-southeast of the Cocos Islands on 8 January. Cyclone Sally slowly moved to the southwest, under the influence of a mid-level ridge to the southeast, reaching its peak with 95 km/h winds on 9 January. The storm then rapidly weakened as a result of the presence of dry air and increased wind shear, before dissipating early on 10 January 460 km west-southwest of the Cocos Islands. Cyclone Sally had no effects on land.[5]
Severe Tropical Cyclone Kerry
| Category 3 severe tropical cyclone (Australian scale) |
| Category 2 tropical cyclone (SSHWS) |
|
|
| Duration |
8 January – 18 January |
| Peak intensity |
150 km/h (90 mph) (10-min) 955 hPa (mbar) |
Tropical Cyclone Kerry developed from Tropical Depression 5F on 5 January in RSMC Nadi's Area of Responsibility, 585 km (364 mi) northeast of Port Vila, Vanuatu. Kerry moved to the southwest with 75 km/h (45 mph) winds as it moved over Vanuatu. Once past the island, Kerry moved on a west-southwest course and it began to intensify after turning to the west. The storm reached a peak intensity of 160 km/h (100 mph) before turning towards the south-southeast. The storm began to weaken under vertical shear and was downgraded to a depression on 13 January.
Tropical Low (10S)
| Tropical low (Australian scale) |
| Tropical storm (SSHWS) |
|
|
| Duration |
11 January – 17 January |
| Peak intensity |
55 km/h (35 mph) (10-min) 998 hPa (mbar) |
Tropical Cyclone Tim
| Category 1 tropical cyclone (Australian scale) |
| Tropical storm (SSHWS) |
|
|
| Duration |
23 January – 25 January |
| Peak intensity |
85 km/h (50 mph) (10-min) 990 hPa (mbar) |
A tropical low located about 930 km north of Learmonth, Western Australia began to develop a deeper convection on 23 January, despite being beneath the subtropical ridge. The low became Tropical Cyclone Tim the next day, when it was 700 km southeast of Christmas Island. Tim moved slowly to the southwest, as a result of steering from an anticyclone to the southeast. The storm reached briefly reached a peak with wind of 85 km/h late on 23 January. Tim lost tropical cyclone status on 25 January to 470 km south-west of Christmas Island and the remnant continued west before dissipating. There was no damage as a result of Cyclone Tim.[5]
Severe Tropical Cyclone Harvey
| Category 3 severe tropical cyclone (Australian scale) |
| Tropical storm (SSHWS) |
|
|
| Duration |
5 February – 7 February |
| Peak intensity |
130 km/h (80 mph) (10-min) 967 hPa (mbar) |
The Bureau of Meteorology began monitoring a tropical low off Groote Eylandt in the Gulf of Carpentaria on 3 February 2005. The low intensified and was named Harvey three days later. The storm made landfall near the Queensland/Northern Territory border on 7 February as a Category 3 (Australian scale) system. Minor structural damage was reported along the Robinson River and Mornington Island was battered by high winds and heavy rain, however no casualties were reported.
Tropical Cyclone Vivienne
| Category 1 tropical cyclone (Australian scale) |
| Tropical storm (SSHWS) |
|
|
| Duration |
4 February – 9 February |
| Peak intensity |
65 km/h (40 mph) (10-min) 990 hPa (mbar) |
A tropical low developed within the monsoon trough about 550 km northwest of Broome, Western Australia on 4 February. The low gradually became more organized as it drifted slowly to the southwest, but did not intensify until it became Tropical Cyclone Vivienne on 8 February. The cyclone peaked with 65 km/h winds and remained near stationary, before dissipating later that day.[6] Oil and gas production in the Timor Sea was disrupted by Cyclone Vivienne.[7]
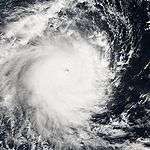
Severe Tropical Cyclone Ingrid
| Category 5 severe tropical cyclone (Australian scale) |
| Category 4 tropical cyclone (SSHWS) |
|
|
| Duration |
5 March – 17 March |
| Peak intensity |
230 km/h (145 mph) (10-min) 924 hPa (mbar) |
Cyclone Ingrid was an intense cyclone, impacting Queensland, Northern Territory and Western Australia as a Category 4 or 5 cyclone.[8]
Severe Tropical Cyclone Willy
| Category 3 severe tropical cyclone (Australian scale) |
| Category 2 tropical cyclone (SSHWS) |
|
|
| Duration |
9 March – 14 March |
| Peak intensity |
140 km/h (85 mph) (10-min) 960 hPa (mbar) |
A tropical low began to develop on 8 March 830 km north of Port Hedland, Western Australia. The low did not move as it developed and became Tropical Cyclone Willy in the same area. Willy moved slowly west-southwest, roughly parallel to the Australian coast, strengthening steadily in the favourable environment. It reached its peak with 140 km/h winds on 11 March when it was 550 km northwest of Onslow.
Cyclone Willy then turned to the southwest and maintained its strength for a day before it began to weaken. The storm turned to the west and weakened into a remnant low on 14 March. The remnant continued to drift west away from Australia before dissipating a few days later.[9] Oil production in the Timor Sea was disrupted by Cyclone Willy, but there were no effects on land.[7]
Severe Tropical Cyclone Adeline-Juliet
| Category 3 severe tropical cyclone (Australian scale) |
| Category 2 tropical cyclone (SSHWS) |
|
|
| Duration |
3 April – 5 April (Out of basin) |
| Peak intensity |
140 km/h (85 mph) (10-min) 960 hPa (mbar) |
A tropical low formed roughly 710 km east-northeast of the Cocos Islands on 1 April. The system developed moved southwest towards the Cocos Islands and became Tropical Cyclone Juliet on 3 April, when it was 45 km east of the islands. The system steadily intensified as it moved west, becoming a severe tropical cyclone on 4 April. Cyclone Adeline crossed into Réunion's area of responsibility on 5 April, by which time it had 140 km/h winds.
Météo-France renamed the storm Juliet when they assumed responsibility for the cyclone, as it passed west of 90°E.[10] Cyclone Adeline triggered gale warnings on the Cocos Islands, where 160 mm of rain fell in one day. The storm caused minor damage and uprooted trees on the islands.[4]
Tropical Low
| Tropical low (Australian scale) |
|
|
| Duration |
13 April – 15 April |
| Peak intensity |
Winds not specified 990 hPa (mbar) |
During 12 April a tropical low developed within the northern Arafura Sea.[11][12] Over the next couple of days the system moved eastwards, with deep atmospheric convection developing over the western quadrants by 15 April.[11][12] By this time the system was located about 100 km (60 mi) to the southwest of Port Moresby in Papua New Guinea and was producing gales and rough seas around Papua New Guinea.[11][12] The system subsequently approached and interacted with south-eastern Papua New Guinea, before it moved into an area of increasing vertical wind shear and started weakening.[11][12] The system was last formally noted during that day before it dissipated a few days later.[11][12]
Seasonal effects
See also
References
External links