1976 Atlantic hurricane season
 | |
| Season summary map | |
| First system formed | May 21, 1976 |
|---|---|
| Last system dissipated | October 28, 1976 |
| Strongest storm1 | Belle – 957 mbar (hPa) (28.26 inHg), 120 mph (195 km/h) (1-minute sustained) |
| Total depressions | 23 |
| Total storms | 10 |
| Hurricanes | 6 |
| Major hurricanes (Cat. 3+) | 2 |
| Total fatalities | 72 |
| Total damage | $100 million (1976 USD) |
| 1Strongest storm is determined by lowest pressure | |
1974, 1975, 1976, 1977, 1978 | |
The 1976 Atlantic hurricane season was an average Atlantic hurricane season, officially starting on June 1, 1976 and ending on November 30, dates which conventionally limit the period of each year when most tropical cyclones develop in the Atlantic Ocean. The season produced 23 tropical cyclones, of which ten developed into named storms; six became hurricanes, and two attained major hurricane status. The strongest hurricane of the season was Hurricane Belle, which reached Category 3 status on the Saffir-Simpson Hurricane Scale east of North Carolina; Belle later struck Long Island, New York as a Category 1 hurricane, causing $100 million in damage (1976 USD) and a total of five deaths across the New England region of the United States.
The season began with Subtropical Storm One on May 21, prior to the official start of the season; the bounds of the season are from June 1 to November 30, which conventionally delimit the period of each year when most tropical cyclones form in the Atlantic basin. Tropical Storm Dottie caused flooding rains in Florida that caused a total of four deaths. In early September, Hurricane Emmy caused 68 indirect deaths when a Venezuelan Air Force plane carrying a school choir crashed on a landing attempt at Lajes Air Base in the Azores during the storm.
Seasonal summary

Officially, the 1976 hurricane season began on June 1 and ended November 30;[1][2] however, the first system – Subtropical Storm One – developed on May 21.[3] Conditions across the Atlantic were somewhat unfavorable for tropical cyclogenesis throughout the year, with high wind shear dominating the Caribbean Sea and Gulf of Mexico. The bulk of the season's activity was confined to August when five named storms formed.[4]
Compared the previous ten year average of storms per season, the 1976 season was considered an average one. However, the lack of activity in both the Caribbean Sea and Gulf of Mexico was considered a rare event that had only occurred one other time in 1962 since 1900.[4]
The year's activity was reflected with a cumulative accumulated cyclone energy (ACE) rating of 84,[5] classifying it as a "near-normal" season.[6] ACE is, broadly speaking, a measure of the power of the hurricane multiplied by the length of time it existed, so storms that last a long time, as well as particularly strong hurricanes, have high ACEs. ACE was only calculated on tropical systems at or exceeding 34 knots (39 mph, 63 km/h) or tropical storm strength.[7]
Storms
Subtropical Storm One
| Subtropical storm (SSHWS) | |||
|---|---|---|---|
| |||
| Duration | May 21 – May 25 | ||
| Peak intensity | 50 mph (85 km/h) (1-min) 994 mbar (hPa) | ||


On May 19 an upper-level trough produced widespread thunderstorms over the Gulf of Mexico. Slowly, the system organized, first to a subtropical depression on May 21, then to a subtropical storm on May 23. The storm began to move faster, and on May 23, it hit the Florida Panhandle. After moving across Georgia at a forward motion of 25 mph (40 km/h) the storm reached its peak of maximum sustained winds reaching 50 mph (85 km/h) while southeast of the Carolinas on May 24.[8] After transitioning into an extratropical cyclone, the system traveled generally northeast and ultimately dissipated on May 31 south of Iceland.[9]
Heavy rainfall was associated with the system, but little damage occurred.[8]
Tropical Storm Anna
| Tropical storm (SSHWS) | |||
|---|---|---|---|
| |||
| Duration | July 28 – August 1 | ||
| Peak intensity | 45 mph (75 km/h) (1-min) 999 mbar (hPa) | ||


The system that became Tropical Storm Anna formed in the central Atlantic, several hundred miles southeast of Bermuda. It began as a subtropical depression on July 28, and strengthened to Subtropical Storm Two on July 30. That afternoon it rapidly acquired tropical characteristics, and was named Anna. Anna reached its peak of 45 mph (75 km/h) winds that day, but became disorganized and turned into an extratropical system on August 1. Steering currents were weak, so the system made a slow counterclockwise loop around the Azores. After turning east on August 5, the system doubled back to the southwest the following day before completely dissipating on August 7.[10]
Hurricane Belle
| Category 3 hurricane (SSHWS) | |||
|---|---|---|---|
| |||
| Duration | August 6 – August 10 | ||
| Peak intensity | 120 mph (195 km/h) (1-min) 957 mbar (hPa) | ||


In late July, a tropical wave emerged off the west coast of Africa. Traversing the Atlantic Ocean for more than a week, the system eventually consolidated into a tropical depression near the Bahamas on August 6. Remaining nearly stationary for a day, the depression strengthened into a tropical storm on August 7 and a hurricane later that day as it acquired a northwest motion. Formation of an eye accompanied quick intensification and Belle reached its peak the following day with winds of 120 mph (195 km/h).[3][11] The hurricane subsequently turned north and accelerated, skirting the Outer Banks of North Carolina. Early on August 10, Belle made landfall in Long Island, New York, as a minimal hurricane before moving inland over southern New England as a tropical storm hours later. Thereafter, Belle transitioned into an extratropical cyclone before moving over Atlantic Canada.[11] The system turned east while over the north Atlantic and ultimately dissipated on August 15 to the south of Iceland.[10]
Threatening much of the East Coast of the United States, hurricane warnings were issued from Georgia to Maine. An estimated 500,000 people evacuated coastal areas accordingly. Overall, impacts from Belle were less than expected and mainly attributed to flooding across New England. Hundreds of thousands of residents lost power due to high winds. A total of 12 people lost their lives, mostly incidents indirectly related to the hurricane, and damage reached an estimated $100 million.[11][12][13] Portions of New Jersey, New York, and Vermont were later declared major disaster areas by then-President Gerald Ford.[14][15][16] Some damage also took place in New Brunswick, Canada, from heavy rain.[17]
Tropical Storm Dottie
| Tropical storm (SSHWS) | |||
|---|---|---|---|
| |||
| Duration | August 18 – August 21 | ||
| Peak intensity | 50 mph (85 km/h) (1-min) 996 mbar (hPa) | ||


A strong upper level trough led to the formation of a low pressure area in the eastern Gulf of Mexico, on August 17. This low became a tropical depression on August 18. After drifting to the east-southeast, a pressure of a 1,004 mbar (29.6 inHg) occurred on August 19. The storm rapidly moved to the northeast, reaching tropical storm strength on the way. After passing over Florida, Dottie moved to the north, reaching a peak of 50 mph (85 km/h) winds. Conditions appeared favorable, and a hurricane watch was issued. However, upper-level winds ripped the storm apart on August 20, and it was barely a tropical storm at its South Carolina landfall on August 21. It weakened to a tropical depression, and advisories were stopped, later on August 21. A tide in Atlantic Beach, North Carolina reached 3.5 feet (1.1 m) above normal. The remnant low of the system followed its track, moving southwestward into Florida, bringing more rain to the area. A total of 10.68 in (271.3 mm) of rain fell at Fort Lauderdale.[18] Dottie lost its identity after re-entering the Gulf of Mexico on August 25. Damage was minor, but four deaths occurred due to a fishing boat sinking over the Bahamas.[19][20][21]
Hurricane Candice
| Category 1 hurricane (SSHWS) | |||
|---|---|---|---|
| |||
| Duration | August 18 – August 24 | ||
| Peak intensity | 90 mph (150 km/h) (1-min) 964 mbar (hPa) | ||

On August 11, a cold-core low was located south of Bermuda. Over the next week, the system warmed and moved toward the surface. On August 18, it became a tropical depression, and later that day, it was named Tropical Storm Candice. Moving to the northeast, it remained weak until August 21, when it rapidly became a hurricane, located at 41ºN, 400 miles (640 km) east of Cape Cod. When Candice became a hurricane, it was one of only seven hurricanes to reach hurricane strength north of 40ºN. Soon after, Candice rapidly moved to the northeast, and it lost its identity to a cold front on August 24.
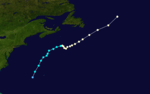
Hurricane Emmy
| Category 2 hurricane (SSHWS) | |||
|---|---|---|---|
| |||
| Duration | August 20 – September 4 | ||
| Peak intensity | 105 mph (165 km/h) (1-min) 974 mbar (hPa) | ||
.JPG)

The tropical depression that became Hurricane Emmy developed on August 20 from a tropical wave, located about 1,000 mi (1,600 km) east of the Lesser Antilles. As it moved west-northwestward, the area strengthened to a tropical storm on August 22. On August 24, it recurved to the northeastward, and strengthened to a hurricane on August 25. Its eastward movement so early in the year is almost unprecedented, as it occurred from the rapid development of a low pressure system to its northeast. Emmy moved recurved back northwest on August 26, but again moved eastward on August 29, when it reached its peak of 105 mph (165 km/h). It gradually weakened, and on September 4, a weakened extratropical Emmy was absorbed by the larger circulation of Hurricane Frances while located over the Azores.[22]
Hurricane Emmy caused 68 deaths when a Venezuelan Air Force plane carrying a school choir crashed on a landing attempt at Lajes Air Base in the Azores during the storm.[22]
Hurricane Frances
| Category 3 hurricane (SSHWS) | |||
|---|---|---|---|
| |||
| Duration | August 27 – September 4 | ||
| Peak intensity | 115 mph (185 km/h) (1-min) 963 mbar (hPa) | ||
.JPG)

Like Emmy, the tropical depression that became Hurricane Frances formed from a tropical wave on August 27, while midway between the Lesser Antilles and the coast of Africa. The next day, it became a tropical storm, and on August 30, Frances became a hurricane. As it recurved to the north and east, Frances reached its peak of 115 mph (185 km/h) on September 1. Steady weakening occurred afterwards, and Frances became extratropical on September 4.
Subtropical Storm Three
| Subtropical storm (SSHWS) | |||
|---|---|---|---|
| |||
| Duration | September 13 – September 17 | ||
| Peak intensity | 45 mph (75 km/h) (1-min) 1011 mbar (hPa) | ||

On September 12, the interaction between mid-tropospheric low and a diffuse stationary front led to the formation of a low pressure system over central Florida. As it moved north-northeastward, it developed a circulation and became a subtropical depression on September 13. The next day it became a subtropical storm, and reached its peak of 45 mph (75 km/h) over the western tropical Atlantic, off the coast of Georgia. The storm quickly made landfall near Charleston, South Carolina, and dissipated over southern Virginia on September 17.
Hurricane Gloria
| Category 2 hurricane (SSHWS) | |||
|---|---|---|---|
| |||
| Duration | September 26 – October 4 | ||
| Peak intensity | 105 mph (165 km/h) (1-min) 970 mbar (hPa) | ||


A tropical wave became a tropical depression on September 26, located 400 miles (640 km) northeast of the Lesser Antilles. On September 27 while moving northward, it strengthened to become Tropical Storm Gloria. After moving northwestward for a day, Gloria moved northeast, strengthening to a 105 mph (165 km/h) hurricane on September 30. Steady weakening ensued, and Gloria lost its tropical characteristics on October 4.
Hurricane Holly
| Category 1 hurricane (SSHWS) | |||
|---|---|---|---|
| |||
| Duration | October 22 – October 28 | ||
| Peak intensity | 75 mph (120 km/h) (1-min) 990 mbar (hPa) | ||


The tropical depression that became Hurricane Holly formed from a tropical wave 200 miles (320 km) east of the northern Lesser Antilles on October 22. After a day, the storm became Tropical Storm Holly, strengthening to Hurricane Holly on October 24. Holly weakened to a tropical storm on October 25. The storm became extratropical on October 28 while located 400 miles (640 km) northwest of the Azores islands.
Other storms

Throughout the 1976 season, there were 11 tropical depressions monitored that did not achieve gale intensity.[3]
Tropical Depression Ten in early October brought heavy rains to Puerto Rico.[23]
Seasonal effects
This is a table of all of the storms that have formed during the 1976 Atlantic hurricane season. It includes their names, duration, peak strength, areas affected, damage, and death totals. Deaths in parentheses are additional and indirect (an example of an indirect death would be a traffic accident), but were still related to that storm. Damage and deaths include totals while the storm was extratropical, a wave, or a low, and all of the damage figures are in 1976 USD.
| Saffir–Simpson hurricane wind scale | ||||||
| TD | TS | C1 | C2 | C3 | C4 | C5 |
| Storm name |
Dates active | Storm category
at peak intensity |
Max 1-min wind mph (km/h) |
Min. press. (mbar) |
Areas affected | Damage (millions USD) |
Deaths | |||
|---|---|---|---|---|---|---|---|---|---|---|
| One | May 21 – 25 | Subtropical storm | 50 (85) | 994 | Southeastern United States | Minimal | None | |||
| Depression | June 7 – 9 | Tropical depression | 35 (55) | N/A | None | None | None | |||
| Depression | June 11 – 12 | Tropical depression | 35 (55) | N/A | Florida | None | None | |||
| Depression | July 20 – 22 | Tropical depression | 30 (45) | N/A | None | None | None | |||
| Depression | July 23 – 24 | Tropical depression | 30 (45) | N/A | None | None | None | |||
| Anna | July 28 – August 1 | Tropical storm | 45 (75) | 999 | Azores | None | None | |||
| Belle | August 6 – 10 | Category 3 hurricane | 120 (195) | 957 | North Carolina, Mid-Atlantic states, New England, Atlantic Canada | 101 | 12 | |||
| Dottie | August 18 – 21 | Tropical storm | 50 (85) | 996 | Southeastern United States, Bahamas | Minimal | 4 | |||
| Candice | August 18 – 24 | Category 1 hurricane | 90 (150) | 964 | None | None | None | |||
| Emmy | August 20 – September 4 | Category 2 hurricane | 105 (165) | 974 | Lesser Antilles, Azores | Minimal | 68 | |||
| Frances | August 27 – September 4 | Category 3 hurricane | 115 (185) | 963 | Azores | None | None | |||
| Depression | September 4 – 6 | Tropical depression | 30 (45) | N/A | None | None | None | |||
| Depression | September 5 – 7 | Tropical depression | 30 (45) | N/A | None | None | None | |||
| Three | September 13 – 17 | Subtropical storm | 50 (85) | 1011 | Southeastern United States | None | None | |||
| Depression | September 20 – 27 | Tropical depression | 35 (55) | N/A | None | None | None | |||
| Depression | September 22 – 24 | Tropical depression | 30 (45) | N/A | None | None | None | |||
| Gloria | September 26 – October 4 | Category 2 hurricane | 105 (165) | 970 | None | None | None | |||
| Depression | September 26 – 28 | Tropical depression | 35 (55) | N/A | None | None | None | |||
| Ten | October 3 – 12 | Tropical depression | 35 (55) | N/A | Lesser Antilles, Hispaniola, Puerto Rico | None | None | |||
| Depression | October 12 – 15 | Tropical depression | 35 (55) | N/A | None | None | None | |||
| Holly | October 22 – 28 | Category 1 hurricane | 75 (120) | 990 | None | None | None | |||
| Season Aggregates | ||||||||||
| 21 cyclones | May 21 – October 29 | 120 (195) | 957 | 101 | 84 | |||||
Storm names
The following names were used for named storms that formed in the Atlantic basin in 1976.[1] No storms were retired following the season; however, an overhaul of the naming system in 1979 to include male names resulted in the majority of this list being discarded.[24]
|
|
See also
- List of Atlantic hurricanes
- List of Atlantic hurricane seasons
- 1976 Pacific hurricane season
- 1976 Pacific typhoon season
- 1976 North Indian Ocean cyclone season
- Southern Hemisphere tropical cyclone seasons: 1975–76, 1976–77
References
- 1 2 "Hurricane Unit Ready for 'Crying Wolf' Charges". The Danville Register. Miami, Florida. Associated Press. May 23, 1976. p. 8B. – via Newspapers.com (subscription required)
- ↑ "Hurricane Season Ends". The Naples Daily News. Miami, Florida. United Press International. November 30, 1976. p. 9A. – via Newspapers.com (subscription required)
- 1 2 3 Hurricane Research Division (May 5, 2015). "Atlantic hurricane best track (HURDAT version 2)". National Hurricane Center. National Oceanic and Atmospheric Administration. Archived from the original (.txt) on June 11, 2015. Retrieved June 4, 2015.
- 1 2 Miles B. Lawrence (April 1977). "Atlantic Hurricane Season of 1976: General Summary" (PDF). Monthly Weather Review. American Meteorological Society. 105 (4): 497–498. Bibcode:1977MWRv..105..497L. doi:10.1175/1520-0493(1977)105<0497:AHSO>2.0.CO;2. Retrieved June 17, 2015.
- ↑ "Atlantic basin Comparison of Original and Revised HURDAT". Hurricane Research Division. National Oceanic and Atmospheric Administration. March 2011. Retrieved June 17, 2015.
- ↑ "Background Information: The North Atlantic Hurricane Season". Climate Prediction Center. National Oceanic and Atmospheric Administration. August 7, 2014. Retrieved June 17, 2015.
- ↑ David Levinson (August 20, 2008). "2005 Atlantic Ocean Tropical Cyclones". National Climatic Data Center. Retrieved June 17, 2015.
- 1 2 Miles B. Lawrence (April 1977). "Atlantic Hurricane Season of 1976: Subtropical storm no. 1, 21-25 May" (PDF). Monthly Weather Review. American Meteorological Society. 105 (4): 507. Bibcode:1977MWRv..105..497L. doi:10.1175/1520-0493(1977)105<0497:AHSO>2.0.CO;2. Retrieved June 17, 2015.
- ↑ Elwyn E. Wilson, ed. (November 1976). "Marine Weather Review: Principal Tracks of Centers of Cyclones at Sea Level, North Atlantic May 1976". Mariners Weather Log. Washington, D.C. National Oceanic and Atmospheric Administration, Environmental Data Service. 20 (6): 354.
- 1 2 Elwyn E. Wilson, ed. (January 1977). "Marine Weather Review: Principal Tracks of Centers of Cyclones at Sea Level, North Atlantic August 1976". Mariners Weather Log. Washington, D.C. National Oceanic and Atmospheric Administration, Environmental Data Service. 21 (1): 37.
- 1 2 3 Miles B. Lawrence (April 1977). "Atlantic Hurricane Season of 1976: Hurricane Belle, 6-10 August" (PDF). Monthly Weather Review. American Meteorological Society. 105 (4): 500–504. Bibcode:1977MWRv..105..497L. doi:10.1175/1520-0493(1977)105<0497:AHSO>2.0.CO;2. Retrieved June 4, 2015.
- ↑ "Hurricane Belle at Long Island Beach". Pittsburgh Post Gazette. New York, New York. Associated Press. August 10, 1976. pp. 1, 3. Retrieved June 4, 2015.
- ↑ "Belle leaves victims". The Portsmouth Herald. Vernon, Connecticut. Associated Press. August 16, 1976. p. 1. – via Newspapers.com (subscription required)
- ↑ "Designated Areas: New Jersey Severe Storms, High Winds, Flooding". Federal Emergency Management Agency. Government of the United States. August 21, 1976. Retrieved June 6, 2015.
- ↑ "Designated Areas: New York Hurricane Belle". Federal Emergency Management Agency. Government of the United States. September 3, 1976. Retrieved June 6, 2015.
- ↑ "Hurricane Belle leaves four dead". The Bryan Times. August 11, 1976. p. 11. Retrieved June 5, 2015.
- ↑ "Rain damage". The Portsmouth Herald. Fredericton, Canada. Associated Press. August 17, 1976. p. 6. – via Newspapers.com (subscription required)
- ↑ David M. Roth. Tropical Storm Dottie Rainfall Page. Retrieved on 2007-12-25.
- ↑ Dottie TCR Page 1
- ↑ Dottie TCR Page 2
- ↑ Dottie TCR Page 3
- 1 2 Miles B. Lawrence (April 1977). "Atlantic Hurricane Season of 1976: Hurricane Emmy, 20 August-4 September" (PDF). Monthly Weather Review. American Meteorological Society. 105 (4): 505–506. Bibcode:1977MWRv..105..497L. doi:10.1175/1520-0493(1977)105<0497:AHSO>2.0.CO;2. Retrieved June 17, 2015.
- ↑ David M. Roth (2015). "Tropical Depression Ten - October 8-13, 1976". Weather Prediction Center. National Oceanic and Atmospheric Administration. Retrieved June 17, 2015.
- ↑ "Tropical Cyclone Naming History and Retired Names". National Hurricane Center. Miami, Florida: National Oceanic and Atmospheric Administration. April 17, 2015. Retrieved June 17, 2015.
External links
Tropical cyclones of the 1976 Atlantic hurricane season | ||
|---|---|---|
| ||
| ||