1975 Atlantic hurricane season
 | |
| Season summary map | |
| First system formed | June 27, 1975 |
|---|---|
| Last system dissipated | December 13, 1975 |
| Strongest storm1 | Gladys – 939 mbar (hPa) (27.73 inHg), 140 mph (220 km/h) (1-minute sustained) |
| Total depressions | 28 |
| Total storms | 9 |
| Hurricanes | 6 |
| Major hurricanes (Cat. 3+) | 3 |
| Total fatalities | 80 |
| Total damage | $490 million (1975 USD) |
| 1Strongest storm is determined by lowest pressure | |
1973, 1974, 1975, 1976, 1977 | |
The 1975 Atlantic hurricane season officially began on June 1, 1975, and lasted until November 30, 1975. These dates conventionally delimit the period of each year when most tropical cyclones form in the Atlantic basin. The activity level of the season was average, after several consecutive years of below average activity, with nine storms forming of which six reached hurricane strength.
The most notable storm of the season was September's Hurricane Eloise, which caused heavy damage and 80 deaths in Puerto Rico, Hispaniola, and Florida.
Season summary
The season's activity was reflected with a cumulative accumulated cyclone energy (ACE) rating of 76.[1] ACE is, broadly speaking, a measure of the power of the hurricane multiplied by the length of time it existed, so storms that last a long time, as well as particularly strong hurricanes, have high ACEs. ACE is only calculated for full advisories on tropical systems at or exceeding 34 knots (39 mph, 63 km/h) or tropical storm strength. Although officially, subtropical storms are not included,[2] the subtropical stage of Doris is not excluded from the above ACE value.
Storms
Tropical Storm Amy
| Tropical storm (SSHWS) | |||
|---|---|---|---|
| |||
| Duration | June 27 – July 4 | ||
| Peak intensity | 70 mph (110 km/h) (1-min) 981 mbar (hPa) | ||


A trough of low pressure developed into a tropical depression while just north of Grand Bahama on June 27.[3][4] The depression headed generally northward and remained weak. Upon nearing the coast of the Carolinas, the depression turned sharply eastward ahead of a rapidly approaching trough. Early on June 29, the system intensified into Tropical Storm Amy offshore North Carolina. Further intensification and the storm reached its peak intensity with winds of 70 mph (110 km/h) and a barometric pressure of 981 mbar (hPa; 28.97 inHg) by July 2.[4] During most of the storm's existence, Amy featured many subtropical characteristics but was not classified as such due to the proximity to land.[3] By July 4, the system moved southeast of Newfoundland before becoming extratropical.[4]
The main effects from Amy were rough seas, reaching up to 15 ft (4.6 m) in height, that were felt from North Carolina to New Jersey, inflicting minor coastal flooding and beach erosion.[3][5] The storm also brought generally light rainfall to land, peaking at 5.87 in (149 mm) in Belhaven, North Carolina.[6] Offshore North Carolina, a schooner carrying four people capsized on June 30, resulting in the death of the father of the other three crew members. They remained at sea for roughly 15 days before being rescued by a Greek merchant ship.[7]
Hurricane Blanche
| Category 1 hurricane (SSHWS) | |||
|---|---|---|---|
| |||
| Duration | July 24 – July 28 | ||
| Peak intensity | 85 mph (140 km/h) (1-min) 980 mbar (hPa) | ||


A tropical wave emerged into the Atlantic Ocean from the west coast of Africa on July 14. The system remained weak for about a week, before convection began increasing significantly on July 21. After wind shear decreased,[3] the wave managed to develop into a tropical depression on July 24 about 355 miles (570 km) northeast of the Turks and Caicos Islands. It moved northwestward until early on July 26,[4] when an approaching cold front and associated trough caused the depression to turn northeastward.[3] Around that time, the cyclone intensified into Tropical Storm Blanche.[4] Because the cold front weakened and baroclinity,[3] Blanche continued to intensify, becoming a Category 1 hurricane on July 27. Slightly further deepening occurred, with the storm peaking with winds of 85 mph (140 km/h) and a minimum barometric pressure of 980 mbar (29 inHg). Before 12:00 UTC on July 28, Blanche made landfall in Barrington, Nova Scotia, with winds of 80 mph (130 km/h). The system quickly transitioned into an extratropical cyclone, which soon dissipated.[4]
In Atlantic Canada, the remnants of Blanche produced high winds, gusting up to 70 mph (110 km/h) and moderate rainfall, peaking at 3.1 in (79 mm) in Chatham, New Brunswick.[8]
Tropical Depression Three
| Tropical depression (SSHWS) | |||
|---|---|---|---|
| |||
| Duration | July 24 – July 26 | ||
| Peak intensity | 35 mph (55 km/h) (1-min) 1007 mbar (hPa) | ||

On July 24, the fifth tropical depression of the season formed over the southwestern Gulf of Mexico. Deep convection associated with the system persisted around the center of circulation.[9] Forecasters at the time anticipated the depression to intensify into a tropical storm before moving over land.[10] Not long after forming, the depression made landfall in Tampico, Mexico at peak intensity; a barometric pressure of 1007 mbar (hPa; 29.74 inHg) was recorded in the city with sustained winds of 37 mph (60 km/h). Just prior to this, an air force reconnaissance mission into the cyclone found 50 mph (85 km/h) winds; however, due to the interaction with land, the NHC did not upgrade the depression. The system was no longer monitored by the NHC after landfall.[9]
Tropical Depression Four
| Tropical depression (SSHWS) | |||
|---|---|---|---|
| |||
| Duration | July 27 – July 30 | ||
| Peak intensity | 35 mph (55 km/h) (1-min) | ||

Tropical Depression Four developed from a trough of low pressure in the northeastern Gulf of Mexico about 60 mi (95 km) southwest of Cape San Blas, Florida, on July 27.[3][4] The depression moved west-northwestward and strengthened slightly to reach winds of 35 mph (55 km/h), but remained below tropical storm intensity and made landfall in eastern Louisiana. Once inland, the depression slowly weakened and re-curved northwestward on July 30 into Mississippi. Around that time, the depression dissipated.[4] The remnants persisted at least until August 3, at which time it was situated over Arkansas.
The tropical depression dropped heavy rainfall, with some areas of the Florida Panhandle experiencing more than 20 in (510 mm) of precipitation. Bay, Gulf, Holmes, Okaloosa, Santa Rosa, Wakulla, and Walton were hardest hit. Numerous roads were flooded and closed, with $3.2 million in damage incurred to that infrastructure. About 500 homes suffered flood damage, 22 of which were destroyed. Damage is estimated to have reached $8.5 million in the state of Florida alone.[11] In southern Alabama, overflowing rivers flooded several businesses and homes in Brewton and East Brewton. Damage in Alabama totaled approximately $300,000.[12]
Hurricane Caroline
| Category 3 hurricane (SSHWS) | |||
|---|---|---|---|
| |||
| Duration | August 24 – September 1 | ||
| Peak intensity | 115 mph (185 km/h) (1-min) 963 mbar (hPa) | ||


A tropical wave that emerged into the Atlantic from the west coast of Africa on August 15 developed into a tropical depression about 200 mi (320 km) north of Hispaniola on August 24.[3][4] The depression moved west-southwestward and failed to intensify before crossing the Turks and Caicos Islands and making landfall near Mayarí, Holguín Province, in Cuba on August 25. After emerging into the Caribbean Sea, the cyclone headed west-northwestward beginning on August 27. By the following day, the depression entered into the Gulf of Mexico after passing just offshore the Yucatán Peninsula. The system then intensified into Tropical Storm Caroline early on August 29. At 00:00 UTC on August 30, Caroline intensified into a hurricane. Further strengthening occurred, with the storm peaked as a Category 3 hurricane with winds of 115 mph (185 km/h) and a minimum pressure of 963 mbar (28.4 inHg) about 24 hours later. Around that time, Caroline made landfall in a rural area of Tamaulipas. The system rapidly weakened and dissipated on September 1.[4]
In Mexico, the storm produced 10 ft (3 m) storm tides along the coast, while 5-10 in (127–254 mm) of rain fell inland. The rainfalls caused flooding, which forced 1,000 people to evacuate and left moderate damage to homes and businesses. The precipitation ended an eight-month drought that was affecting inland portions of northern Mexico and decreasing the area's corn production.[13] Along the coast, several small villages sustained significant damage from the hurricane's storm surge.[14] Portions of south Texas also experienced heavy rainfall, with 11.93 in (303 mm) at Port Isabel.[6] Brownsville broke a record for the highest amount of precipitation observed on a day in August.[15] Two deaths occurred from drowning in Galveston.[16]
Hurricane Doris
| Category 2 hurricane (SSHWS) | |||
|---|---|---|---|
| |||
| Duration | August 28 – September 4 | ||
| Peak intensity | 110 mph (175 km/h) (1-min) 965 mbar (hPa) | ||

The subtropical storm that became Hurricane Doris formed from a frontal low on August 28 over the north-central Atlantic. Subtropical Storm One moved to the northwest, where it gained tropical characteristics. On August 31, it was designated Hurricane Doris. It peaked as a 105 mph (169 km/h) hurricane, but a nontropical low-pressure system caused the storm to lose its tropical characteristics on September 4.
Doris made meteorological history when, on August 31, it became the first Atlantic hurricane ever to be upgraded to hurricane intensity solely on the basis of satellite pictures.[17]
Hurricane Eloise
| Category 3 hurricane (SSHWS) | |||
|---|---|---|---|
| |||
| Duration | September 13 – September 24 | ||
| Peak intensity | 125 mph (205 km/h) (1-min) 955 mbar (hPa) | ||


A tropical wave developed into a tropical depression on September 13 to the east of the Virgin Islands. The system tracked westward and strengthened into Tropical Storm Eloise while passing to the north of Puerto Rico. Eloise briefly reached hurricane intensity soon thereafter, but weakened back to a tropical storm around landfall over Hispaniola. The cyclone emerged into open waters of the northern Caribbean Sea. After striking the northern Yucatan Peninsula, Eloise turned northward and re-intensified. In the Gulf of Mexico, the cyclone quickly deepened, becoming a Category 3 hurricane on September 23. The hurricane made landfall west of Panama City, Florida, before moving inland across Alabama and dissipating on September 24.
The storm produced heavy rainfall throughout Puerto Rico and Hispaniola, causing extensive flooding that left severe damage and more than 40 fatalities. Thousands of people in these areas became homeless as flood waters submerged numerous communities. As Eloise progressed westward, it affected Cuba to a lesser extent. In advance of the storm, about 100,000 residents evacuated from the Gulf Coast region. Upon making landfall in Florida, Eloise generated wind gusts of 155 mph (249 km/h), which demolished hundreds of buildings in the area. The storm's severe winds, waves, and storm surge left numerous beaches, piers, and other coastal structures heavily impaired.
Wind-related damage extended into inland Alabama and Georgia. Further north, torrential rains along the entire East Coast of the United States created an unprecedented and far-reaching flooding event, especially into the Mid-Atlantic States. In that region, an additional 17 people died as a result of freshwater flooding from the post-tropical storm; infrastructural and geological effects were comparable to those from Hurricane Agnes several years prior. Across the United States, damage amounted to approximately $560 million. The storm killed 80 people along its entire track; due to the severe damage, the name "Eloise" was retired from the Atlantic tropical cyclone naming lists.
Hurricane Faye
| Category 2 hurricane (SSHWS) | |||
|---|---|---|---|
| |||
| Duration | September 18 – September 29 | ||
| Peak intensity | 105 mph (165 km/h) (1-min) 977 mbar (hPa) | ||


The tropical depression that became Hurricane Faye developed from a tropical wave on September 18, located 500 mi (800 km) west of Cape Verde. The depression reached tropical storm strength on 19th, but couldn't strengthen much further due to increasing upper-level shear. It weakened to a tropical depression on September 23, but managed to become a tropical storm again on September 25 and a hurricane on September 26 due to more favorable conditions. It passed by Bermuda on the September 27, but the island was spared from major damage. Later that day it turned eastward, and after two days became extra tropical.
As the eye of Faye passed roughly 40 mi (65 km) northeast of Bermuda, winds up to 69 mph (111 km/h) and heavy rains were recorded on the island.[18] Up to 2.8 in (71 mm) of rain fell in Bermuda from the hurricane.[6] Already severely impacted by flooding from Eloise days earlier, New England prepared for additional flooding from Faye. The National Weather Service issued flash flood watches, resulting in more evacuations.[19]
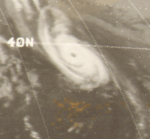
Hurricane Gladys
| Category 4 hurricane (SSHWS) | |||
|---|---|---|---|
| |||
| Duration | September 22 – October 3 | ||
| Peak intensity | 140 mph (220 km/h) (1-min) 939 mbar (hPa) | ||


A tropical wave emerged into the Atlantic from the west coast of Africa on September 17. The system developed into a tropical depression while several hundred miles southwest of Cape Verde on September 22. Initially, the depression remained weak, but after encountering warm sea surface temperatures and low wind shear, it became Tropical Storm Gladys on September 24. The storm then entered a more unfavorable environment, but on September 28, Gladys became a Category 1 hurricane. Shortly thereafter, the storm reentered an area favorable for strengthening. Eventually, a well-defined eye became visible on satellite imagery.
As the storm tracked to the east of the Bahamas, a curve to the north began, at which time an anticyclone developed atop the cyclone. This subsequently allowed Gladys to rapidly intensify into a Category 4 hurricane, reaching maximum sustained winds of 140 mph (230 km/h) on October 2. Thereafter, Gladys began to weaken and passed very close to Cape Race, Newfoundland before merging with a large extratropical cyclone the next day. Effects from the system along the East Coast of the United States were minimal, although heavy rainfall and rough seas were reported. In Newfoundland, strong winds and light precipitation were observed.
Tropical Depression Twelve
| Tropical depression (SSHWS) | |||
|---|---|---|---|
| |||
| Duration | October 14 – October 17 | ||
| Peak intensity | 35 mph (55 km/h) (1-min) | ||
A tropical depression formed in the southern Gulf of Mexico on October 14. Rounding the western periphery of the subtropical ridge, the depression strengthened while moving northeast towards the central Gulf coast ahead of an advancing cold front. Moving inland late on October 16, the depression became an extratropical cyclone as it through the Southeast and Mid-Atlantic states, before moving offshore New England. Heavy rains fell along the frontal boundary ahead of the system, leading to flooding across eastern Louisiana, central Mississippi, the western Florida panhandle, central Tennessee, western Virginia, and eastern New York.
The heavy rains which fell upon Jackson, Mississippi established a new daily rainfall record for October 16 and a new 24-hour rainfall record for the month of October. Eight bridges were damaged across Jackson County, Tennessee due to the floods. Heavy rains led to extensive damage to the soybean and corn crops in Hickman and Marion counties in Tennessee. Six tornadoes touched down in association with this system, with two reported in Alabama, two across northwest Florida, and two across North Carolina. One died due to flooding in Mississippi.[20]
Tropical Storm Hallie
| Tropical storm (SSHWS) | |||
|---|---|---|---|
| |||
| Duration | October 24 – October 27 | ||
| Peak intensity | 50 mph (85 km/h) (1-min) 1002 mbar (hPa) | ||


A frontal trough exited the East Coast of the United States on October 18. The southern portion of the system became stationary near the Bahamas; simultaneously, a cut-off upper-level low formed in the same region. The disturbance produced scattered convection, until a tropical wave merged with it on October 23. The system developed into a subtropical depression by October 24, while located about 100 mi (160 km) east of Daytona Beach, Florida. The depression drifted northward on October 25 and eventually acquired tropical characteristics by October 26. Due to tropical storm force winds, the system was reclassified as Tropical Storm Hallie, while situated about 100 mi (160 km) east of Charleston, South Carolina. Hallie accelerated to the northeast starting on October 26. By the following day, Hallie peaked with winds of 50 mph (85 km/h). Later that day, Hallie merged with a frontal zone and became extratropical offshore Virginia.[21][22]
The precursor to Hallie produced extensive cloudiness precipitation in the Bahamas.[23] On October 27, gale warnings were issued for portions of the Outer Banks of North Carolina, and small craft advisories were posted for coastal areas from Georgia to Virginia.[24] Tides along the North Carolina and Virginia coasts were generally between 1 and 2 ft (0.30 and 0.61 m) above normal. Generally light precipitation fell, peaking at 2.55 in (65 mm) in Manteo, North Carolina.[23] Additionally, the pressure gradient between Hallie and a high pressure area increased winds across much of the East Coast of the United States.[21] However, because the storm remained primarily offshore, damage was minimal, and no fatalities were reported.[3]
Subtropical Storm Two
| Subtropical storm (SSHWS) | |||
|---|---|---|---|
| |||
| Duration | December 9 – December 13 | ||
| Peak intensity | 70 mph (110 km/h) (1-min) 985 mbar (hPa) | ||

An extratropical low pressure system developed into a subtropical storm about 615 mi (990 km) east-southeast of Cape Race, Newfoundland, at 12:00 UTC on December 9.[3][4] The storm moved rapidly southward and intensified, reaching maximum sustained winds of 70 mph (110 km/h) about 24 hours later. Shortly thereafter, sustained winds began decreasing. However, late on December 11, the storm attained its minimum barometric pressure of 985 mbar (29.1 inHg). The system began moving southeastward and then eastward. By 12:00 UTC on December 12, the cyclone weakened to a subtropical depression. Moving northward, it dissipated 24 hours later while situated about 505 mi (815 km) south-southwest of Flores Island in the Azores.[4]
Other storms

In addition to the named storms and notable tropical depressions, several other minor tropical depression developed during the season. On June 24, the first tropical depression developed over the central Atlantic. It tracked westward for two days, before executing a counter-clockwise loop. By June 28, the system had completed the loop and was tracking north. The depression dissipated about 305 miles (491 km) southeast of Sable Island on June 29. A third tropical depression formed northeast of the Bahamas on July 4. Tracking northeastward, the system did not intensify and was last noted over open waters midday on July 5.[4]
On September 3, a tropical depression developed near Cape Verde. Generally tracking west, the depression eventually dissipated near the Lesser Antilles on September 9. Another tropical depression developed near west coast of Africa on September 3. It moved generally westward and dissipated on September 6. Tropical Depression Seven formed on September 5, in the southwestern Gulf of Mexico. Tracking west-northwestward, the system nearly attained tropical storm-status; however, it made landfall later that day near Tampico, Mexico and dissipated not long after. Another tropical depression developed near Bermuda on September 11. Initially, the depression drifted northeastward but later accelerated and dissipated by September 14.[4]
Tropical Depression Eleven developed near the Gulf of Honduras on September 25 and tracked slowly westward. By September 28, the depression made landfall in northern Belize before dissipating two days later. A tropical depression developed over the eastern Atlantic Ocean on October 3. It dissipated by October 5. Tropical Depression formed on October 27 over the southwestern Caribbean Sea and tracked northwest. After turning nearly due west, the depression briefly made landfall near the Nicaragua–Honduras border and made another landfall in southern Belize shortly before dissipating on October 29.[4]
On November 8, a tropical depression developed off the coast of Honduras. Moving north-northwestward, the system gradually intensified. Between November 9 and 10, reconnaissance missions into the depression found winds of 40 mph (65 km/h); however, the NHC did not upgrade it to a tropical storm, because weaken occurred shortly thereafter. Over the following few days, the system gradually turned southward and made landfall in the southwestern edge of the Yucatán Peninsula on November 12, shortly before dissipating. In late November, another tropical depression formed over the central Atlantic. A short-lived system, it formed on November 29 and dissipated on December 1.[4]
Season effects
This is a table of the storms in the 1975 Atlantic hurricane season. It mentions all of the season's storms and their names, landfall(s), peak intensities, damages, and death totals. Deaths in parentheses are additional and indirect(an example of such being a traffic accident or landslide), but are still related to that storm. The damage and death totals in this list include impacts when the storm was a precursor wave or post-tropical low, and all of the damage figures are in 1975 USD.
| Saffir–Simpson hurricane wind scale | ||||||
| TD | TS | C1 | C2 | C3 | C4 | C5 |
| Storm name |
Dates active | Storm category
at peak intensity |
Max 1-min wind mph (km/h) |
Min. press. (mbar) |
Areas affected | Damage (millions USD) |
Deaths | |||
|---|---|---|---|---|---|---|---|---|---|---|
| One | June 5 – June 7 | Tropical depression | None | None | 0 | |||||
| Two | June 24 – June 29 | Tropical depression | None | None | 0 | |||||
| Amy | June 26 – July 4 | Tropical storm | 70 (110) | 981 | North Carolina, Newfoundland | minimal | 0 | |||
| Four | July 4 – July 5 | Tropical depression | None | None | 0 | |||||
| Five | July 12 – July 13 | Tropical depression | None | None | 0 | |||||
| Six | July 18 - July 19 | Tropical depression | Mexico | unknown | unknown | |||||
| Blanche | July 23 - July 28 | Category 1 hurricane | 85 (140) | 980 | Maine, Nova Scotia | minimal | 0 | |||
| Eight | July 24 - July 26 | Tropical depression | 35 (55) | 1008 | Mexico | unknown | unknown | |||
| Nine | July 27 - July 31 | Tropical depression | Louisiana, Mississippi, Alabama, Florida | >8.5 | 0 | |||||
| Caroline | August 24 - September 1 | Category 3 hurricane | 115 (185) | 963 | Cuba, Yucatán peninsula | unknown | 0 | |||
| Doris | August 28 - September 4 | Category 2 hurricane | 110 (175) | 965 | None | None | 0 | |||
| Twelve | September 3 - September 6 | Tropical depression | None | None | 0 | |||||
| Thirteen | September 3 - September 9 | Tropical depression | None | None | 0 | |||||
| Fourteen | September 5 - September 7 | Tropical depression | Mexico | unknown | unknown | |||||
| Fifteen | September 11 - September 14 | Tropical depression | None | None | 0 | |||||
| Eloise | September 13 - September 24 | Category 3 hurricane | 125 (205) | 955 | Puerto Rico, Hispaniola, Florida, Alabama | >550 | 80 | |||
| Faye | September 18 - September 29 | Category 2 hurricane | 105 (165) | 977 | Bermuda | minimal | 0 | |||
| Gladys | September 22 - October 3 | Category 4 hurricane | 140 (220) | 939 | None | None | 0 | |||
| Nineteen | September 25- September 30 | Tropical depression | Yucatán peninsula | unknown | 0 | |||||
| Twenty | October 1 - October 1 | Tropical depression | Mississippi, Alabama, Florida, Georgia | unknown | unknown | |||||
| Twenty-one | October 3 - October 5 | Tropical depression | None | None | 0 | |||||
| Twenty-two | October 13 - October 18 | Tropical depression | Louisiana, Mississippi, Alabama, Florida | unknown | unknown | |||||
| Twenty-three | October 15 - October 17 | Tropical depression | None | None | 0 | |||||
| Hallie | October 24 - October 28 | Tropical storm | 50 (85) | 1002 | South Carolina, North Carolina, Virginia | minimal | 0 | |||
| Twenty-five | October 26 - October 29 | Tropical depression | Nicaragua, Honduras, Belize | unknown | unknown | |||||
| Twenty-six | November 7 - November 12 | Tropical depression | Honduras, Yucatán peninsula | unknown | unknown | |||||
| Twenty-seven | November 29 - December 1 | Tropical depression | None | None | 0 | |||||
| Two | December 6 - December 13 | Subtropical storm | 70 (110) | 985 | None | None | 0 | |||
| Season Aggregates | ||||||||||
| 28 cyclones | June 5 – December 13 | 140 (220) | 939 | >550 | 80 | |||||
Storm names
The following names were used for named storms (tropical storms and hurricanes) that formed in the North Atlantic in 1975.[25] Storms were named Amy, Caroline, Doris, Eloise and Faye for the first time in 1975. Names that were not assigned are marked in gray.
|
|
Retirement
The name Eloise was later retired.
See also
- List of Atlantic hurricanes
- List of Atlantic hurricane seasons
- 1975 North Indian Ocean cyclone season
- 1975 Pacific hurricane season
- 1975 Pacific typhoon season
- Southern Hemisphere tropical cyclone seasons: 1974–75, 1975–76
References
- ↑ Hurricane Research Division (March 2011). "Atlantic basin Comparison of Original and Revised HURDAT". National Oceanic and Atmospheric Administration. Retrieved 2011-07-23.
- ↑ David Levinson (2008-08-20). "2005 Atlantic Ocean Tropical Cyclones". National Climatic Data Center. Retrieved 2011-07-23.
- 1 2 3 4 5 6 7 8 9 10 Paul Herbert. "Atlantic Hurricane Season of 1975" (PDF). National Oceanic and Atmospheric Administration. Retrieved 2009-07-17.
- 1 2 3 4 5 6 7 8 9 10 11 12 13 14 15 16 National Hurricane Center; Hurricane Research Division (July 6, 2016). "Atlantic hurricane best track (HURDAT version 2)". United States National Oceanic and Atmospheric Administration. Retrieved December 5, 2016.
- ↑ "Tropical Storm Amy Drifting Slowly At Sea". Ocala Star-Banner. Associated Press. June 30, 1975. Retrieved November 27, 2015.
- 1 2 3 Roth, David M. (April 29, 2015). "Tropical Cyclone Point Maxima". Tropical Cyclone Rainfall Data. United States Weather Prediction Center. Retrieved May 8, 2016.
- ↑ "Boat survival 'tribute' to builder who died in coma". The Free-Lance-Star. Associated Press. July 17, 1975. Retrieved November 27, 2015.
- ↑ "Canadian Tropical Cyclone Season Summary for 1975". Canadian Hurricane Centre. July 3, 2009. Retrieved August 28, 2009.
- 1 2 Herbert, Paul (April 1976). "Atlantic Hurricane Season of 1975" (PDF). National Hurricane Center. Retrieved August 28, 2009.
- ↑ Staff Writer (September 8, 1975). "Tropical Depression Heads for Tampico, May Gain Strength". Los Angeles Times. Retrieved August 28, 2009.
- ↑ "Storm Data and Unusual Weather Phenomena" (PDF). Storm Data. Asheville, North Carolina: National Climatic Data Center. 17 (7): 18. July 1975. ISSN 0039-1972. Archived from the original (PDF) on November 5, 2016. Retrieved November 5, 2016.
- ↑ General Summary of National Flood Events. National Climatic Data Center. National Oceanic and Atmospheric Administration. July 1975. p. 24. Retrieved November 5, 2016.
- ↑ "Caroline Downgraded". The Daytona Beach News-Journal. Associated Press. September 1, 1975. Retrieved November 12, 2016.
- ↑ Preliminary Report: Hurricane Caroline: August 24 – September 1 (Report). Miami, Florida: National Hurricane Center. 1975. p. 2. Retrieved November 12, 2016.
- ↑ "Texas Weather Last Year Seems 'Practically Normal'". The Victoria Advocate. Associated Press. March 2, 1976.
- ↑ "Caroline is Downgraded, Mexico gets only light damage". The Galveston Daily News. United Press International. September 1, 1975.
- ↑ Miles B. Lawrence (April 1979). "Atlantic Hurricane Season of 1978" (PDF). Monthly Weather Review. American Meteorological Society. p. 482. Retrieved 2008-09-19.
- ↑ "Islands Feel Faye". The Ledger. Associated Press. September 27, 1975. Retrieved August 28, 2009.
- ↑ United Press International (September 28, 1975). "Faye adds to flooding". St. Petersburg Times. Retrieved August 28, 2009.
- ↑ David M. Roth. Tropical Depression Twelve – October 15-20, 1975. Retrieved on 2008-11-24.
- 1 2 Preliminary Report: Tropical Storm Hallie: October 24–28, 1975 (Report). National Hurricane Center. p. 1. Retrieved November 12, 2016.
- ↑ Preliminary Report: Tropical Storm Hallie: October 24–28, 1975 (Report). National Hurricane Center. p. 2. Retrieved November 12, 2016.
- 1 2 David M. Roth (January 3, 2008). Tropical Storm Hallie – October 23–27, 1975. Weather Prediction Center (Report). National Oceanic and Atmospheric Administration. Retrieved November 12, 2016.
- ↑ "Hallie Heads to Open Sea". The Ledger. Associated Press. October 27, 1975. Retrieved November 12, 2016.
- ↑ "Fewer Big Hurricanes Spawned This Season". Associated Press. 1974-12-01. Retrieved 2007-12-01.
External links
| Wikimedia Commons has media related to 1975 Atlantic hurricane season. |
Tropical cyclones of the 1975 Atlantic hurricane season | ||
|---|---|---|
| ||
| ||