South Australian state election, 1985
| | ||||||||||||||||||||||||||||||||||||||||||||
| ||||||||||||||||||||||||||||||||||||||||||||
| ||||||||||||||||||||||||||||||||||||||||||||
| ||||||||||||||||||||||||||||||||||||||||||||
.jpg)
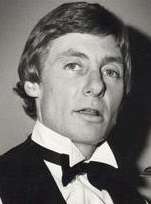
State elections were held in South Australia on 7 December 1985. All 47 seats in the South Australian House of Assembly were up for election. The incumbent Australian Labor Party led by Premier of South Australia John Bannon defeated the Liberal Party of Australia led by Leader of the Opposition John Olsen.
| Party | Votes | % | Swing | Seats | Change | |
|---|---|---|---|---|---|---|
| Australian Labor Party | 393,652 | 48.19 | +1.91 | 27 | +3 | |
| Liberal Party of Australia | 344,337 | 42.15 | -0.52 | 16 | -5 | |
| Australian Democrats | 34,732 | 4.25 | -2.87 | 0 | 0 | |
| Independent Labor | 18,641 | 2.28 | * | 2 | +2 | |
| Nationals SA | 14,056 | 1.72 | -0.60 | 1 | 0 | |
| Independent Liberal | 5,224 | 0.64 | * | 1 | +1 | |
| Independent | 5,368 | 0.66 | -0.94 | 0 | -1 | |
| Other | 878 | 0.11 | 0 | 0 | ||
| Total | 816,888 | 47 | ||||
| Australian Labor Party | WIN | 53.20 | +2.30 | 29 | +4 | |
| Liberal Party of Australia | 46.80 | -2.30 | 18 | -4 | ||
Independents: Martyn Evans, Norm Peterson, Stan Evans
Background
Parliamentary elections for both houses of the Parliament of South Australia were held in South Australia on 7 December 1985, which saw John Bannon and the Australian Labor Party win a second successive term, against the Liberal Party of Australia opposition led by John Olsen.
Bannon's consensual approach to government differed markedly from the Dunstan era. While then there had been a stream of social reform under Dunstan, Bannon's priorities were oriented in economics. He established the Olympic Dam copper and uranium mine, the submarine project, the defence industry, the Hyatt and Adelaide Casino complex, conversion of part of the Adelaide railway station into the Adelaide Convention Centre, sold land reserved for freeways under the MATS plan, and staged the Formula One Grand Prix. Poker machines (pokies) were introduced in South Australia, a decision Bannon would come to regret decades later. Other measures were introduced such as action to prevent destruction of vegetation and urban renewal programmes to invigorate some of the declining inner suburbs in Adelaide.
Labor won the election with an increased majority. The Liberal Party retained John Olsen as leader, partly because his main rival Dean Brown lost his seat to Independent Liberal Stan Evans.
In the South Australian Legislative Council, the sole balance of power was held unbroken by the Australian Democrats from their inception in mid-1970s, until the late 1990s. Though the Democrats would exceed 16 percent of the vote at the 1997 election, during the following term the Democrats would lose the sole balance of power for the first time, sharing the balance of power with independent members, slowly losing numbers and influence, until they were eventually without parliamentary representation as of the 2010 election.
Post-election Pendulum
| LABOR SEATS (27) | |||
| Marginal | |||
| Adelaide | Michael Duigan | ALP | 0.6% |
| Fisher | Philip Tyler | ALP | 1.1% |
| Newland | Di Gayler | ALP | 1.5% |
| Bright | Derek Robertson | ALP | 1.6% |
| Hayward | June Appleby | ALP | 2.8% |
| Unley | Kym Mayes | ALP | 5.0% |
| Todd | John Klunder | ALP | 5.9% |
| Fairly safe | |||
| Norwood | Greg Crafter | ALP | 6.3% |
| Henley Beach | Don Ferguson | ALP | 7.3% |
| Florey | Susan Lenehan | ALP | 8.2% |
| Safe | |||
| Walsh | John Trainer | ALP | 10.7% |
| Hartley | Terry Groom | ALP | 12.5% |
| Albert Park | Kevin Hamilton | ALP | 12.9% |
| Mitchell | Ron Payne | ALP | 13.5% |
| Baudin | Don Hopgood | ALP | 13.7% |
| Gilles | Jack Slater | ALP | 14.2% |
| Peake | Keith Plunkett | ALP | 15.7% |
| Mawson | Susan Lenehan | ALP | 16.1% |
| Whyalla | Frank Blevins | ALP | 17.0% |
| Briggs | Mike Rann | ALP | 17.4% |
| Spence | Roy Abbott | ALP | 18.4% |
| Ross Smith | John Bannon | ALP | 18.7% |
| Playford | Terry McRae | ALP | 19.4% |
| Stuart | Gavin Keneally | ALP | 22.0% |
| Napier | Terry Hemmings | ALP | 23.5% |
| Ramsay | Lynn Arnold | ALP | 24.2% |
| Price | Murray De Laine | ALP | 24.3% |
| LIBERAL SEATS (16) | |||
| Marginal | |||
| Hanson | Heini Becker | LIB | 0.9% |
| Morphett | John Oswald | LIB | 4.7% |
| Fairly safe | |||
| Mitcham | Stephen Baker | LIB | 8.3% |
| Coles | Jennifer Adamson | LIB | 8.4% |
| Heysen | David Wotton | LIB | 8.8% |
| Light | Bruce Eastick | LIB | 9.3% |
| Mount Gambier | Harold Allison | LIB | 9.9% |
| Safe | |||
| Kavel | Stephen Baker | LIB | 11.0% |
| Goyder | John Meier | LIB | 12.4% |
| Alexandra | Ted Chapman | LIB | 15.2% |
| Eyre | Graham Gunn | LIB | 15.8% |
| Chaffey | Peter Arnold | LIB | 16.3% |
| Custance | John Olsen | LIB | 16.3% |
| Bragg | Graham Ingerson | LIB | 17.5% |
| Victoria | Dale Baker | LIB | 18.3% |
| Murray-Mallee | Peter Lewis | LIB | 18.6% |
| CROSSBENCH SEATS (4) | |||
| Davenport | Stan Evans | IND | 2.8% v LIB |
| Elizabeth | Martyn Evans | IND | 4.0% v ALP |
| Semaphore | Norm Peterson | IND | 7.3% v ALP |
| Flinders | Peter Blacker | NAT | 8.3% v LIB |
Legislative Council Results
| 1985 Legislative Council Result (STV GV) | |||
| Party | Seats | ||
| Australian Labor Party | 48.0% | 5 | |
| Liberal Party of Australia | 39.3% | 5 | |
| Australian Democrats | 5.5% | 1 | |
| Nationals SA | 1.6% | ||
| 1985-1989 Legislative Council | |||
| Party | Seats | ||
| Australian Labor Party | 10 | ||
| Liberal Party of Australia | 10 | ||
| Australian Democrats | 2 | ||
See also
- Results of the South Australian state election, 1985 (House of Assembly)
- Results of the South Australian state election, 1985 (Legislative Council)
- Members of the South Australian House of Assembly, 1985-1989
- Members of the South Australian Legislative Council, 1985-1989
References
- History of South Australian elections 1857-2006, volume 1: ECSA
- Historical lower house results
- Historical upper house results
- State and federal election results in Australia since 1890
External links
| General elections | |
|---|---|
| Referendums | |