Electoral district of Newland
| Newland South Australia—House of Assembly | |
|---|---|
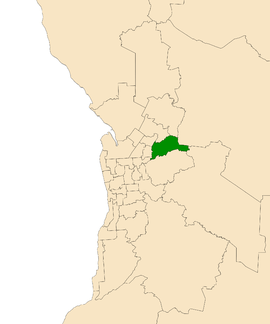 Electoral district of Newland (green) in the Greater Adelaide area | |
| State | South Australia |
| Created | 1977 |
| MP | Tom Kenyon |
| Party | Australian Labor Party (SA) |
| Namesake | Simpson Newland |
| Electors | 24,467 (2014) |
| Area | 69.3 km2 (26.8 sq mi) |
| Demographic | Metropolitan |
Newland is an electoral district of the House of Assembly in the Australian state of South Australia. It is named after pioneer Simpson Newland, a prominent figure in nineteenth-century South Australia. It is a 69.3 km² suburban electorate in north-eastern Adelaide, taking in the suburbs of Banksia Park, Fairview Park, Lower Hermitage, Upper Hermitage, Houghton, St Agnes, Surrey Downs, Tea Tree Gully, Vista and Yatala Vale as well as parts of Chain of Ponds, Highbury, Hope Valley, Inglewood, Millbrook, Redwood Park and Ridgehaven.
Replacing the abolished seat of Tea Tree Gully, Newland was created at the 1976 redistribution, taking effect at the 1977 election,[1] and followed a bellwether pattern until the 1989 election, where it was won by Liberal candidate Dorothy Kotz, who developed a strong personal following in Newland and had little difficulty being re-elected at successive elections until her retirement at the 2006 election. Upon her retirement, however, her personal vote evaporated, and this, combined with a landslide Labor victory across the state, saw Labor candidate Tom Kenyon take the seat for Labor.[2] It became the Labor government's most marginal seat at the 2014 election.
Members for Newland
| Member | Party | Term | |
|---|---|---|---|
| John Klunder | Labor | 1977–1979 | |
| Brian Billard | Liberal | 1979–1982 | |
| John Klunder | Labor | 1982–1985 | |
| Di Gayler | Labor | 1985–1989 | |
| Dorothy Kotz | Liberal | 1989–2006 | |
| Tom Kenyon | Labor | 2006–present | |
Election results
| Party | Candidate | Votes | % | ± | |
|---|---|---|---|---|---|
| Labor | Tom Kenyon | 9,473 | 42.8 | −0.5 | |
| Liberal | Glenn Docherty | 9,269 | 41.8 | +3.8 | |
| Family First | Kate Horan | 1,774 | 8.0 | +1.1 | |
| Greens | Mark Nolan | 1,641 | 7.4 | −0.6 | |
| Total formal votes | 22,157 | 96.9 | +0.4 | ||
| Informal votes | 700 | 3.1 | −0.4 | ||
| Turnout | 22,857 | 93.4 | −0.7 | ||
| Two-party-preferred result | |||||
| Labor | Tom Kenyon | 11,394 | 51.4 | −1.2 | |
| Liberal | Glenn Docherty | 10,763 | 48.6 | +1.2 | |
| Labor hold | Swing | −1.2 | |||
Notes
- ↑ "Statistical Record of the Legislature, 1836 - 2007" (PDF). Parliament of South Australia. Retrieved 26 January 2014.
- ↑ Newland, 2014 election: Poll Bludger
- ↑ 2014 State Election Results – Newland, ECSA.
- ↑ 2014 State Election Results – Newland, ABC.
External links
Coordinates: 34°47′31″S 138°45′22″E / 34.792°S 138.756°E