Hornsey and Wood Green (UK Parliament constituency)
| Hornsey and Wood Green | |
|---|---|
|
Borough constituency for the House of Commons | |
|
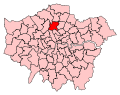
Boundary of Hornsey and Wood Green in Greater London. | |
| County | Greater London |
| Electorate | 79,878 (December 2010)[1] |
| Current constituency | |
| Created | 1983 |
| Member of parliament | Catherine West (Labour) |
| Number of members | One |
| Created from | Hornsey and Wood Green |
| Overlaps | |
| European Parliament constituency | London |
Hornsey and Wood Green is a constituency[n 1] in the London Borough of Haringey represented in the House of Commons of the UK Parliament since May 2015 by Catherine West, of the Labour Party.[n 2]
Boundaries
1983-2010: The London Borough of Haringey wards of Alexandra, Archway, Bowes Park, Crouch End, Fortis Green, Highgate, Hornsey Central, Hornsey Vale, Muswell Hill, Noel Park, South Hornsey, and Woodside.
2010-present: The London Borough of Haringey wards of Alexandra, Bounds Green, Crouch End, Fortis Green, Highgate, Hornsey, Muswell Hill, Noel Park, Stroud Green, and Woodside.
Constituency profile
The constituency takes in the western part of the London Borough of Haringey, stretching from Highgate in the south west of the seat, through the mainly affluent Muswell Hill, through Crouch End and on to the more deprived Wood Green in the north east corner of the seat.
This is a fashionable and trendy area, though there are also concentrated pockets of former and current council housing and unemployment overall, leading to more social housing reliance than the London average.[2]
The area has long had a diverse population, ethnically, including Jewish, Cypriot, Muslim and Afro-Caribbean communities and the constituency includes Alexandra Palace.
History
The constituency was created in 1983 from abolished Hornsey and Wood Green. In those boundary changes the Wood Green seat was broadly divided into two, with half being merged with Hornsey and the rest being transferred to the neighbouring constituency of Tottenham, to the east — a very small part of the Hornsey seat was also transferred to Tottenham at the same time.
Since its creation the seat has been successively represented by Members of Parliament from all three main British political parties in general elections. This was a Conservative Party seat until 1992 but by 1997 swung so heavily it suggested a Labour Party safe seat — Barbara Roche enjoyed a majority of over 20,000. The Liberal Democrats, however, supplanted those parties in the area, both at Parliamentary level where they won the seat in 2005 and held it until 2015; and in local terms.[n 3] At the 2015 election this seat had the lowest combined Conservative and UKIP percentage in England (11.45%).
Members of Parliament
| Election | Member[3] | Party | |
|---|---|---|---|
| 1983 | Hugh Rossi | Conservative | |
| 1992 | Barbara Roche | Labour | |
| 2005 | Lynne Featherstone | Liberal Democrat | |
| 2015 | Catherine West | Labour | |
Election results
Elections in the 2010s
| Party | Candidate | Votes | % | ± | |
|---|---|---|---|---|---|
| Labour | Catherine West[6] | 29,417 | 50.9 | +16.9 | |
| Liberal Democrat | Lynne Featherstone | 18,359 | 31.8 | -14.7 | |
| Conservative | Suhail Rahuja | 5,347 | 9.3 | -7.4 | |
| Green | Gordon Peters | 3,146 | 5.4 | +3.2 | |
| UKIP | Clive Morrison[7] | 1,271 | 2.2 | n/a | |
| Christian Peoples | Helen Spiby-Vann | 118 | 0.2 | n/a | |
| Workers Revolutionary | Frank Sweeney | 82 | 0.1 | n/a | |
| Hoi Polloi | Geoff Moseley | 45 | 0.1 | n/a | |
| Majority | 11,058 | 19.1 | |||
| Turnout | 57,785 | 72.9 | +4.0 | ||
| Labour gain from Liberal Democrat | Swing | 15.8 | |||
| Party | Candidate | Votes | % | ± | |
|---|---|---|---|---|---|
| Liberal Democrat | Lynne Featherstone | 25,595 | 46.5 | +3.2 | |
| Labour | Karen Jennings | 18,720 | 34.0 | −4.3 | |
| Conservative | Richard Merrin | 9,174 | 16.7 | +4.0 | |
| Green | Pete McAskie | 1,261 | 2.3 | −2.7 | |
| Independent | Stephane de Roche | 201 | 0.4 | N/A | |
| Independent | Rohen Kapur | 91 | 0.2 | N/A | |
| Majority | 6,875 | 12.5 | |||
| Turnout | 55,042 | 68.9 | +7.1 | ||
| Liberal Democrat hold | Swing | 3.7 | |||
Elections in the 2000s
| Party | Candidate | Votes | % | ± | |
|---|---|---|---|---|---|
| Liberal Democrat | Lynne Featherstone | 20,512 | 43.3 | +17.5 | |
| Labour | Barbara Roche | 18,117 | 38.3 | −11.6 | |
| Conservative | Peter J. Forrest | 6,014 | 12.7 | −3.0 | |
| Green | Jayne E. Forbes | 2,377 | 5.0 | −0.1 | |
| UKIP | Roy A. Freshwater | 310 | 0.7 | N/A | |
| Majority | 2,395 | 5.1 | |||
| Turnout | 47,330 | 61.8 | +3.8 | ||
| Liberal Democrat gain from Labour | Swing | 14.6 | |||
| Party | Candidate | Votes | % | ± | |
|---|---|---|---|---|---|
| Labour | Barbara Roche | 21,967 | 49.9 | −11.9 | |
| Liberal Democrat | Lynne Featherstone | 11,353 | 25.8 | +14.5 | |
| Conservative | Jason D. Hollands | 6,921 | 15.7 | −6.2 | |
| Green | Jayne E. Forbes | 2,228 | 5.1 | +2.7 | |
| Socialist Alliance | Louise H. Christian | 1,106 | 2.5 | N/A | |
| Socialist Labour | Ella J. Rule | 294 | 0.7 | −0.5 | |
| Reform 2000 | Erdil Ataman | 194 | 0.4 | N/A | |
| Majority | 10,614 | 24.1 | |||
| Turnout | 44,063 | 58.0 | −11.1 | ||
| Labour hold | Swing | ||||
Elections in the 1990s
| Party | Candidate | Votes | % | ± | |
|---|---|---|---|---|---|
| Labour | Barbara Roche | 31,792 | 61.7 | +13.3 | |
| Conservative | Helena D. Hart | 11,293 | 21.9 | −17.2 | |
| Liberal Democrat | Lynne Featherstone | 5,794 | 11.3 | +1.3 | |
| Green | Hilary J. Jago | 1,214 | 2.4 | +0.5 | |
| Referendum | Rachel Miller | 808 | 1.6 | N/A | |
| Socialist Labour | Pat W. Sikorski | 586 | 1.1 | N/A | |
| Majority | 20,499 | 39.8 | +30.5 | ||
| Turnout | 51,487 | 69.1 | |||
| Labour hold | Swing | 13.2 | |||
| Party | Candidate | Votes | % | ± | |
|---|---|---|---|---|---|
| Labour | Barbara Roche | 27,020 | 48.5 | +8.5 | |
| Conservative | Andrew Boff | 21,843 | 39.2 | −3.8 | |
| Liberal Democrat | Peter G.Dunphy | 5,547 | 9.9 | −5.2 | |
| Green | Elizabeth Magdalene Crosby | 1,051 | 1.9 | 0.0 | |
| Natural Law | P.R.G. Davies | 197 | 0.35 | N/A | |
| Revolutionary Communist | William Massey | 89 | 0.16 | N/A | |
| Majority | 5,177 | 9.3 | |||
| Turnout | 55,747 | 75.7 | +2.4 | ||
| Labour gain from Conservative | Swing | ||||
Elections in the 1980s
| Party | Candidate | Votes | % | ± | |
|---|---|---|---|---|---|
| Conservative | Hugh Rossi | 25,397 | 43.0 | +0.5 | |
| Labour | Barbara Roche | 23,618 | 40.0 | +5.0 | |
| Social Democratic | Douglas Eden | 8,928 | 15.1 | −5.8 | |
| Green | Elizabeth Magdalene Crosby | 1,154 | 1.9 | +0.3 | |
| Majority | 1,779 | 3.0 | −4.5 | ||
| Turnout | 73.3 | +2.2 | |||
| Conservative hold | Swing | ||||
| Party | Candidate | Votes | % | ± | |
|---|---|---|---|---|---|
| Conservative | Hugh Rossi | 22,323 | 42.5 | N/A | |
| Labour | Valerie A. Veness | 18,424 | 35.0 | N/A | |
| Social Democratic | Michael I. Burrell | 10,995 | 20.9 | N/A | |
| Green | Peter S.I. Lang | 854 | 1.6 | N/A | |
| Majority | 3,899 | 7.5 | N/A | ||
| Turnout | 52,596 | 71.2 | N/A | ||
| Conservative win (new seat) | |||||
See also
- List of Parliamentary constituencies in Greater London
- Opinion polling for the next United Kingdom general election in individual constituencies
Notes and references
- Notes
- ↑ A borough constituency (for the purposes of election expenses and type of returning officer)
- ↑ As with all constituencies, the constituency elects one Member of Parliament (MP) by the first past the post system of election at least every five years.
- ↑ At local level the London Borough of Haringey's Council was until the 2014 local elections split almost straight down the middle in political terms – the western part that forms this seat returning Liberal Democrat councillors, while the eastern part that forms Tottenham being solidly Labour. However, at the 2014 elections Labour gained a number of seats particularly in Stroud Green and Crouch End
- References
- ↑ "Electorate Figures - Boundary Commission for England". 2011 Electorate Figures. Boundary Commission for England. 4 March 2011. Retrieved 13 March 2011.
- ↑ 2001 Census
- ↑ Leigh Rayment's Historical List of MPs – Constituencies beginning with "H" (part 4)
- ↑ "Election Data 2015". Electoral Calculus. Archived from the original on 17 October 2015. Retrieved 17 October 2015.
- ↑ http://voting.haringey.gov.uk/#a-hwg 19Aug15
- ↑ /http://ukpollingreport.co.uk/2015guide/hornseyandwoodgreen/
- ↑ http://www.hamhighbroadway.co.uk/home/election-2015/ukip_s_clive_morrison_i_will_blow_my_whistle_to_stamp_out_racists_in_the_party_1_4006256
- ↑ "Election Data 2010". Electoral Calculus. Archived from the original on 17 October 2015. Retrieved 17 October 2015.
- ↑ Hornsey and Wood Green: Constituency
- ↑ "Election Data 2005". Electoral Calculus. Archived from the original on 15 October 2011. Retrieved 18 October 2015.
- ↑ "Election Data 2001". Electoral Calculus. Archived from the original on 15 October 2011. Retrieved 18 October 2015.
- ↑ "Election Data 1997". Electoral Calculus. Archived from the original on 15 October 2011. Retrieved 18 October 2015.
- ↑ "Election Data 1992". Electoral Calculus. Archived from the original on 15 October 2011. Retrieved 18 October 2015.
- ↑ "Election Data 1987". Electoral Calculus. Archived from the original on 15 October 2011. Retrieved 18 October 2015.
- ↑ "Election Data 1983". Electoral Calculus. Archived from the original on 15 October 2011. Retrieved 18 October 2015.
Coordinates: 51°35′24″N 0°07′59″W / 51.590°N 0.133°W
