East Quincy, California
| East Quincy | |
|---|---|
| census-designated place | |
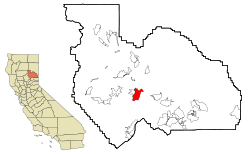 Location in Plumas County and the state of California | |
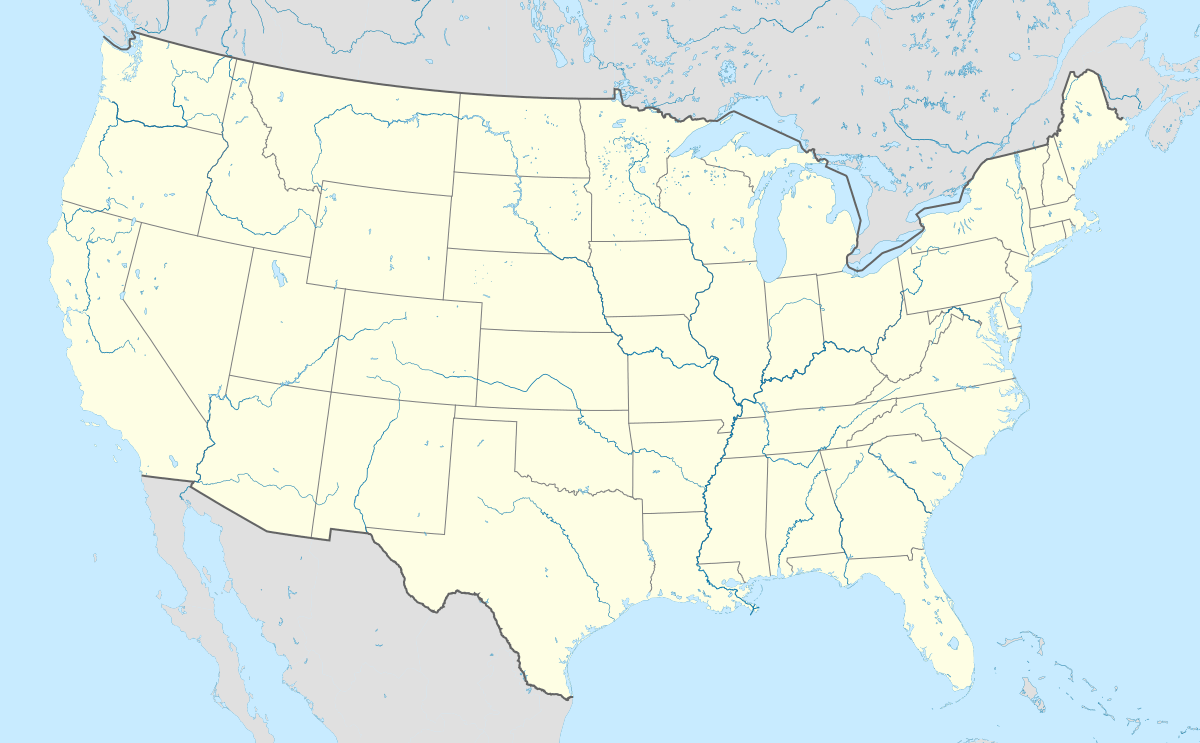 East Quincy Location in the United States | |
| Coordinates: 39°56′7″N 120°54′28″W / 39.93528°N 120.90778°WCoordinates: 39°56′7″N 120°54′28″W / 39.93528°N 120.90778°W | |
| Country |
|
| State |
|
| County | Plumas |
| Area[1] | |
| • Total | 12.107 sq mi (31.357 km2) |
| • Land | 12.107 sq mi (31.357 km2) |
| • Water | 0 sq mi (0 km2) 0% |
| Elevation | 3,491 ft (1,064 m) |
| Population (2010) | |
| • Total | 2,489 |
| • Density | 210/sq mi (79/km2) |
| Time zone | Pacific (PST) (UTC-8) |
| • Summer (DST) | PDT (UTC-7) |
| ZIP code | 95971 |
| Area code(s) | 530 |
| FIPS code | 06-21026 |
| GNIS feature ID | 1658463 |
East Quincy is a census-designated place (CDP) in Plumas County, California, United States. The population was 2,489 at the 2010 census, up from 2,398 at the 2000 census.
Geography
East Quincy is located at 39°56′7″N 120°54′28″W / 39.93528°N 120.90778°W (39.935153, -120.907670).[2]
According to the United States Census Bureau, the CDP has a total area of 12.1 square miles (31 km2), all of it land.
Demographics
2010
The 2010 United States Census[3] reported that East Quincy had a population of 2,489. The population density was 205.6 people per square mile (79.4/km²). The racial makeup of East Quincy was 2,174 (87.3%) White, 79 (3.2%) African American, 43 (1.7%) Native American, 15 (0.6%) Asian, 0 (0.0%) Pacific Islander, 32 (1.3%) from other races, and 146 (5.9%) from two or more races. Hispanic or Latino of any race were 161 persons (6.5%).
The Census reported that 2,451 people (98.5% of the population) lived in households, 0 (0%) lived in non-institutionalized group quarters, and 38 (1.5%) were institutionalized.
There were 1,081 households, out of which 299 (27.7%) had children under the age of 18 living in them, 469 (43.4%) were opposite-sex married couples living together, 114 (10.5%) had a female householder with no husband present, 64 (5.9%) had a male householder with no wife present. There were 77 (7.1%) unmarried opposite-sex partnerships, and 11 (1.0%) same-sex married couples or partnerships. 333 households (30.8%) were made up of individuals and 102 (9.4%) had someone living alone who was 65 years of age or older. The average household size was 2.27. There were 647 families (59.9% of all households); the average family size was 2.78.
The population was spread out with 525 people (21.1%) under the age of 18, 261 people (10.5%) aged 18 to 24, 559 people (22.5%) aged 25 to 44, 796 people (32.0%) aged 45 to 64, and 348 people (14.0%) who were 65 years of age or older. The median age was 42.1 years. For every 100 females there were 103.5 males. For every 100 females age 18 and over, there were 106.3 males.
There were 1,170 housing units at an average density of 96.6 per square mile (37.3/km²), of which 665 (61.5%) were owner-occupied, and 416 (38.5%) were occupied by renters. The homeowner vacancy rate was 1.9%; the rental vacancy rate was 4.8%. 1,522 people (61.1% of the population) lived in owner-occupied housing units and 929 people (37.3%) lived in rental housing units.
2000
As of the census[4] of 2000, there were 2,398 people, 1,016 households, and 667 families residing in the CDP. The population density was 198.6 people per square mile (76.7/km²). There were 1,069 housing units at an average density of 88.5 per square mile (34.2/km²). The racial makeup of the CDP was 91.45% White, 2.50% Black or African American, 1.54% Native American, 0.79% Asian, 0.08% Pacific Islander, 1.29% from other races, and 2.34% from two or more races. 3.25% of the population were Hispanic or Latino of any race.
There were 1,016 households out of which 32.3% had children under the age of 18 living with them, 49.6% were married couples living together, 11.4% had a female householder with no husband present, and 34.3% were non-families. 27.3% of all households were made up of individuals and 6.7% had someone living alone who was 65 years of age or older. The average household size was 2.32 and the average family size was 2.80.
In the CDP the population was spread out with 24.3% under the age of 18, 9.5% from 18 to 24, 26.2% from 25 to 44, 28.0% from 45 to 64, and 12.0% who were 65 years of age or older. The median age was 39 years. For every 100 females there were 103.4 males. For every 100 females age 18 and over, there were 101.2 males.
The median income for a household in the CDP was $35,648, and the median income for a family was $50,000. Males had a median income of $38,107 versus $21,815 for females. The per capita income for the CDP was $17,299. About 9.5% of families and 14.4% of the population were below the poverty line, including 11.6% of those under age 18 and 6.5% of those age 65 or over.
Politics
In the state legislature, East Quincy is in the 1st Senate District, represented by Republican Ted Gaines,[5] and the 1st Assembly District, represented by Republican Brian Dahle.[6]
Federally, East Quincy is in California's 1st congressional district, represented by Republican Doug LaMalfa.[7]
References
- ↑ U.S. Census
- ↑ "US Gazetteer files: 2010, 2000, and 1990". United States Census Bureau. 2011-02-12. Retrieved 2011-04-23.
- ↑ "2010 Census Interactive Population Search: CA - East Quincy CDP". U.S. Census Bureau. Retrieved July 12, 2014.
- ↑ "American FactFinder". United States Census Bureau. Retrieved 2008-01-31.
- ↑ "Senators". State of California. Retrieved March 10, 2013.
- ↑ "Members Assembly". State of California. Retrieved March 2, 2013.
- ↑ "California's 1st Congressional District - Representatives & District Map". Civic Impulse, LLC. Retrieved March 3, 2013.

