Climate of New York


The climate of New York state is generally humid continental, while the extreme southeastern portion of the state (New York City area) lies in the warm temperate climate zone. Winter temperatures average below freezing during January and February in much of New York state, but several degrees above freezing along the Atlantic coastline, including New York City.
Seasonally, summer-like conditions prevail from June to early September statewide, while areas in far southern New York and New York City have summer conditions from late May through late September. Cold air damming east of the Appalachians leads to protracted periods of cloud cover and precipitation east of the range, primarily between the October and April months. Winter-like conditions prevail from November through April in northern New York, and from December through March in southern New York. On average, western New York is much cloudier than points south and east in New York, much of it generated from the Great Lakes. Greenhouse gas emission is low on a per capita basis when compared to most other states due to the extensive use of mass transit, particularly across New York City. The significant urbanization within New York city has led to an urban heat island, which causes temperatures to be warmer overnight in all seasons.
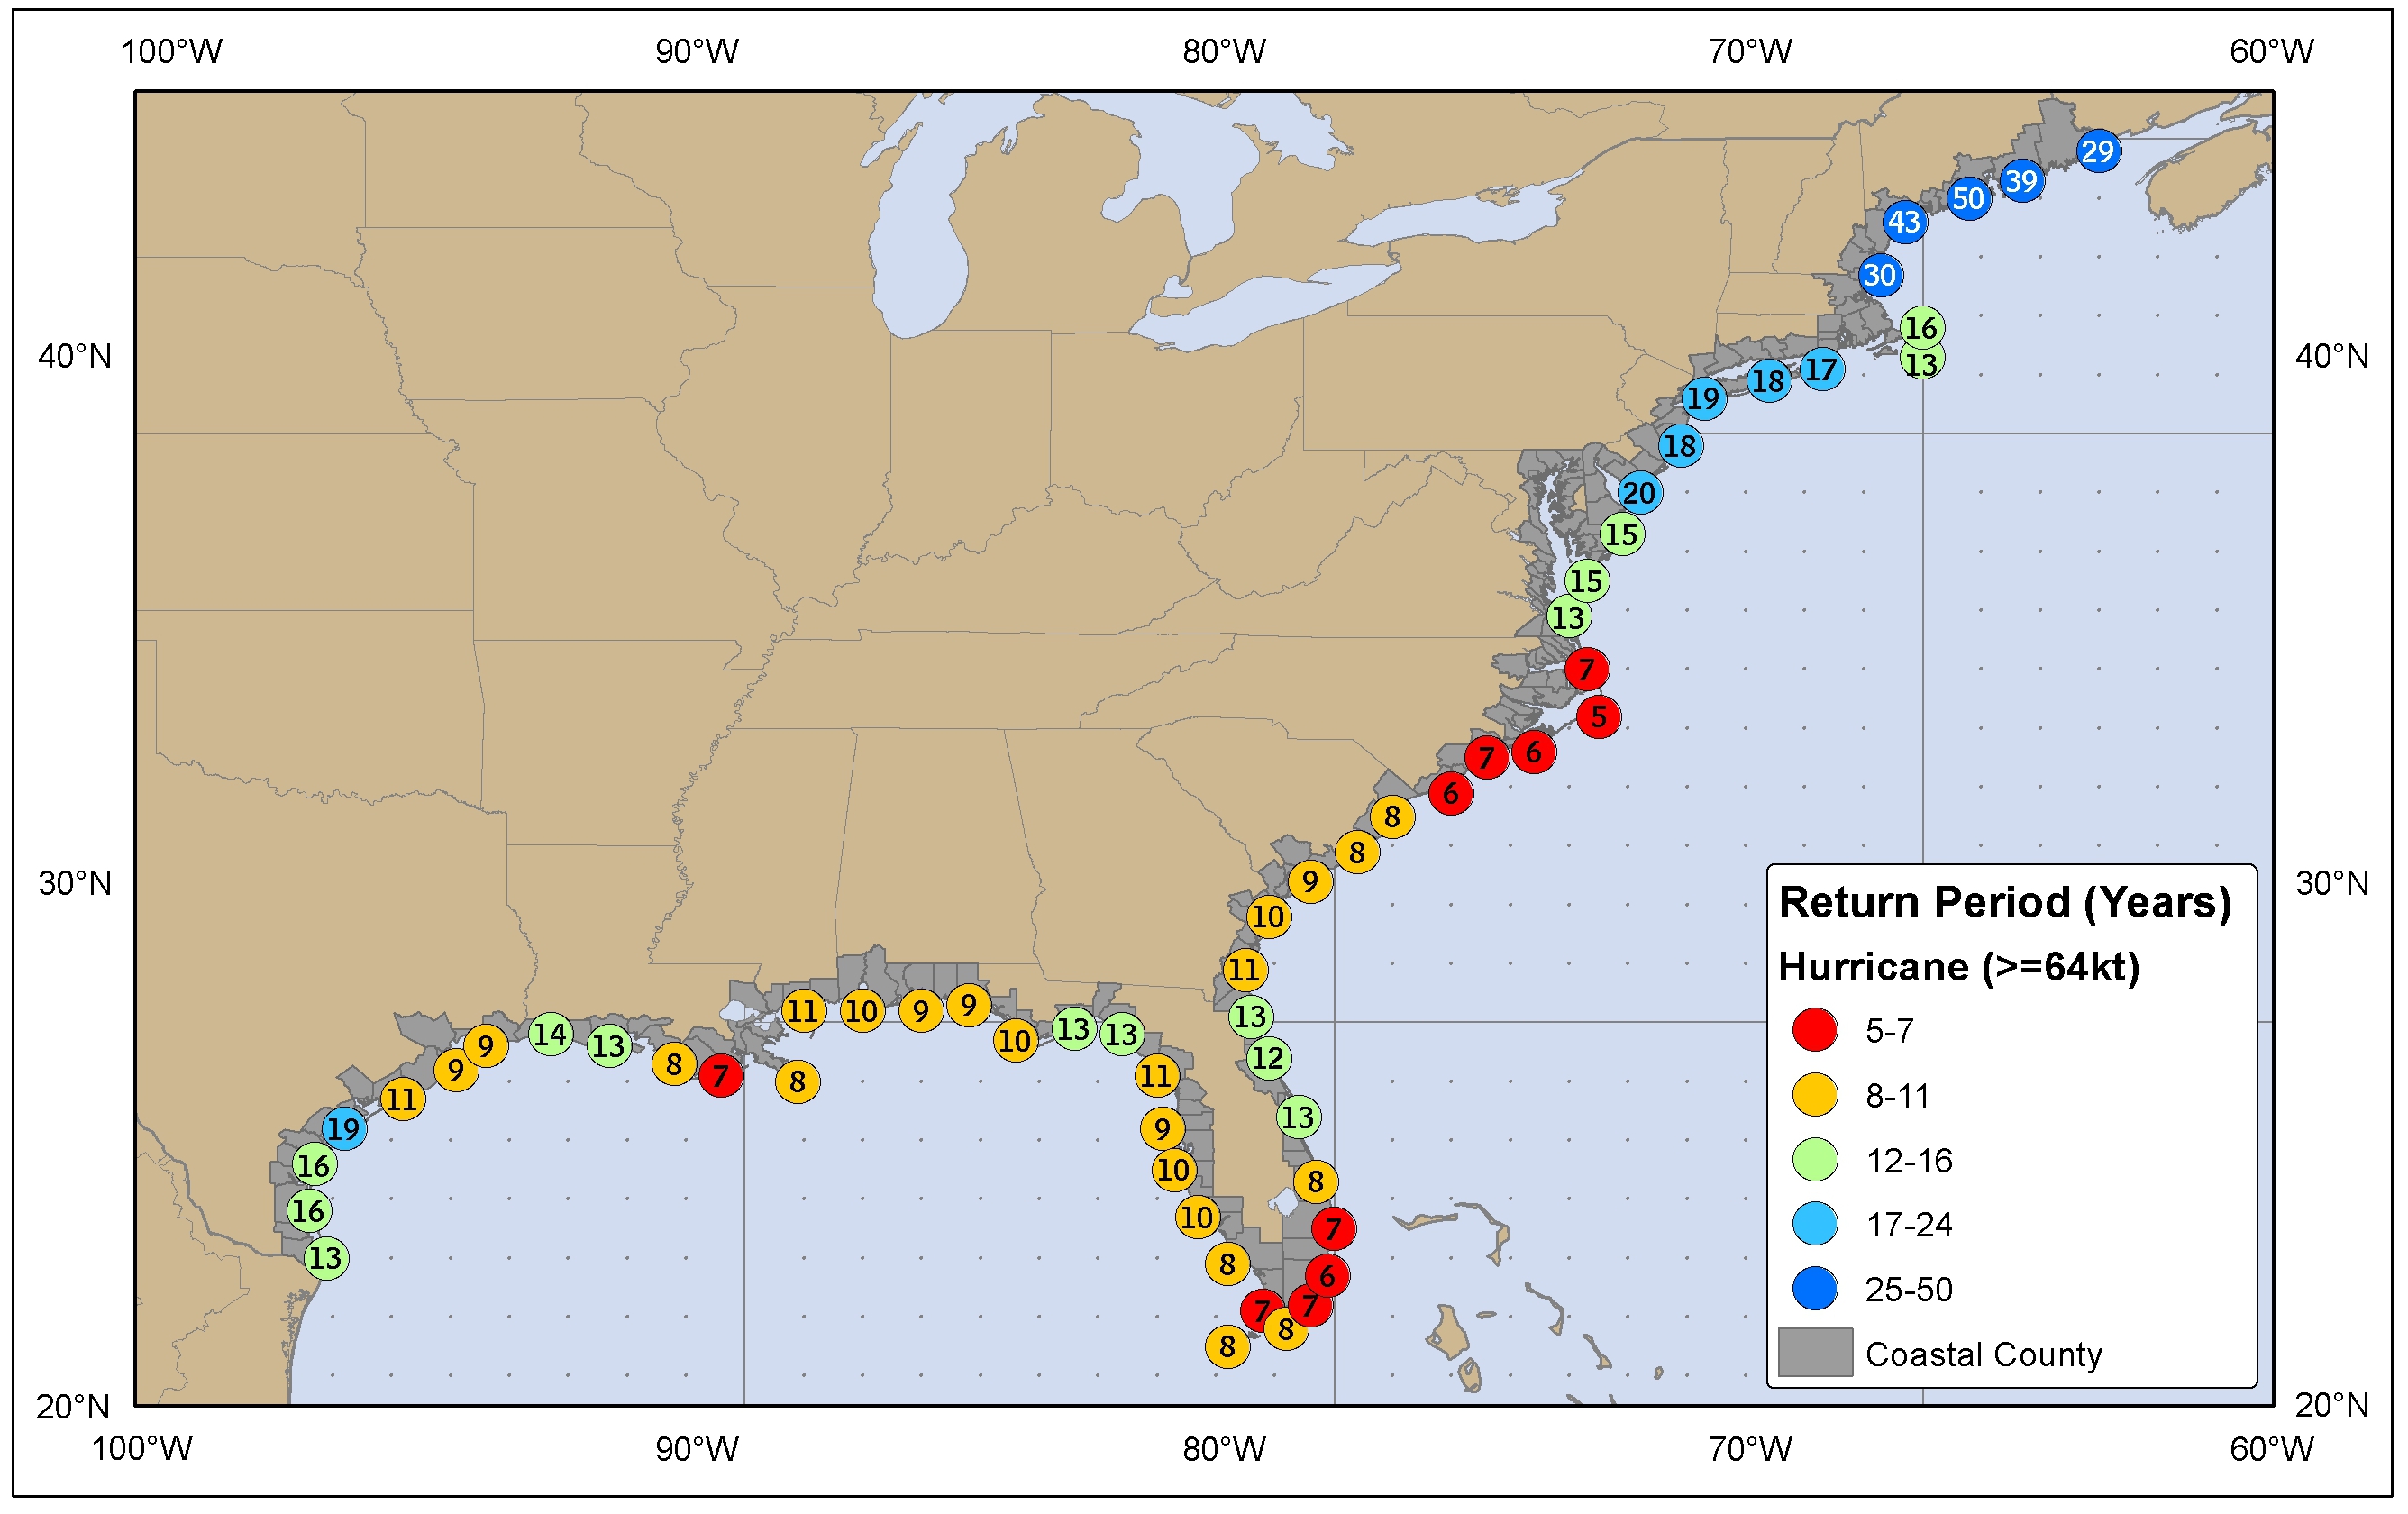
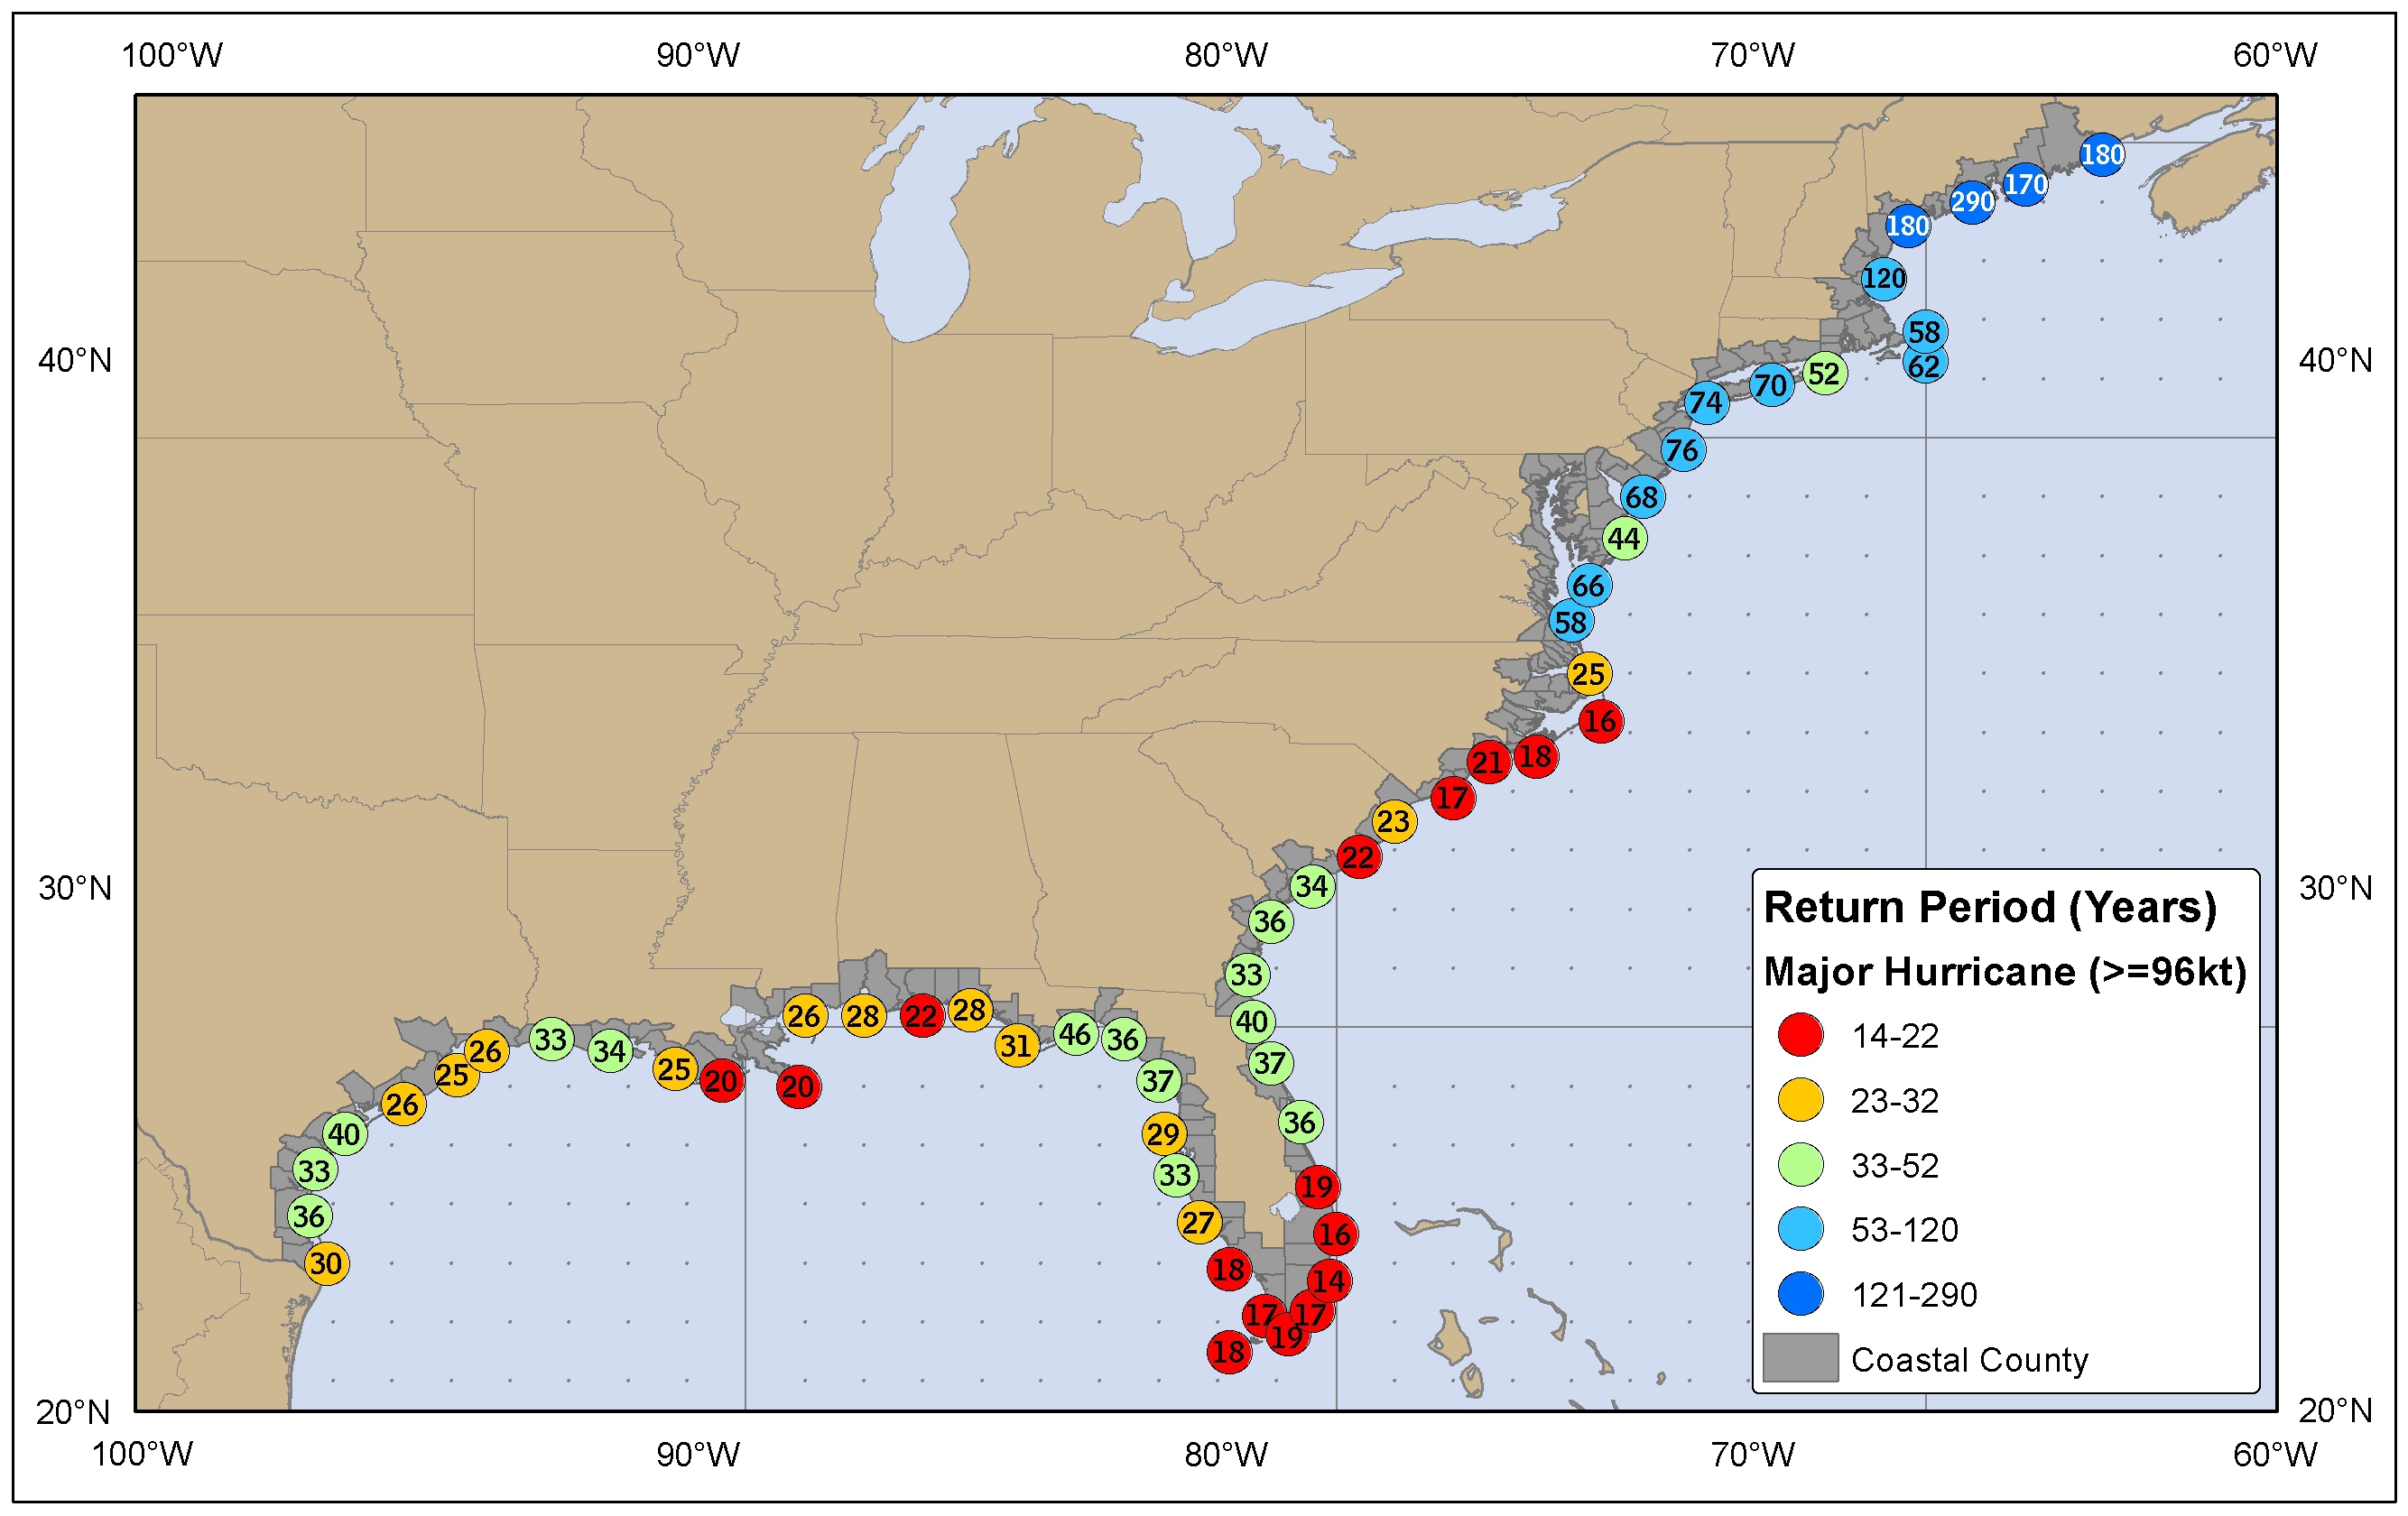
Annual precipitation is fairly even throughout the year across New York state. The Great Lakes region of New York sees the highest annual rain and snow amounts in New York state, and heavy Lake effect snow is common in western New York in winter. In the hotter months, large, long-lived complexes of thunderstorms can invade the state from Canada and the Great Lakes, while tropical cyclones can bring rains and winds from the southwest during the summer and fall. Hurricane impacts on the state occur once every 18–19 years, with major hurricane impacts every 70–74 years. An average of ten tornadoes touch down in New York annually.
Temperatures

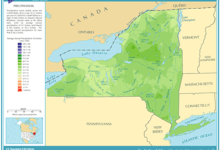
The annual average temperature across the state ranges from around 39 °F (4 °C) over the Adirondack Mountains to near 53 °F (12 °C) across Long Island.[1] Weather in New York is heavily influenced by two air masses: a warm, humid one from the southwest and a cold, dry one from the northwest.[2] A cool, humid northeast airflow from the North Atlantic is much less common, and results in a persistent cloud deck with associated precipitation which linger across the region for prolonged periods of time. Temperature differences between the warmer coast and far northern inland sections can exceed 36 degrees Fahrenheit (20 degrees Celsius), with rain near the coast and frozen precipitation, such as sleet and freezing rain, falling inland. Two-thirds of such events occur between November and April. [3] which moves from northeast to southwest.
Unlike the vast majority of the state, New York City features a humid subtropical climate (Koppen Cfa). New York City is an urban heat island, with temperatures 5-7 degrees Fahrenheit (3-4 degrees Celsius) warmer overnight than surrounding areas. In an effort to fight this warming, roofs of buildings are being painted white across the city in an effort to increase the reflection of solar energy, or albedo.[4]
Summer
In Huntington the average high July temperature is 23 °C,[5] while in Ticonderoga the average high in July is 81 °F (27 °C),[6] the latter much further north, but in the former on Long Island, summer air is cooled by the surrounding ocean. The summer climate is cooler in the Adirondacks, Catskills and higher elevations of the Southern Plateau due to the elevated terrain. The New York City area and lower portions of the Hudson Valley in contrast have much more sultry and tropical summers with frequent bouts of hot temperatures and high dew points. The remainder of New York State enjoys modestly warm summers. Summer temperatures usually range from the upper 70s to mid 80s °F (25 to 30 °C), over much of the state. The record high for New York state is 108 °F (42 °C), set at Troy on July 22, 1926.[2]
Winter

Winters are often cold and snowy above the New York City and Long Island areas of New York. In the majority of winter seasons, a temperature of −13 °F (−25 °C) or lower can be expected in the northern highlands (Northern Plateau) and 0 °F (−18 °C) or colder in the southwestern and east-central highlands (Southern Plateau). The Adirondack region records from 35 to 45 days with below zero temperatures, in normal to severe winters. Winters are also long and cold in both Western and Central New York, though not as cold as the Adirondack region due to the warming influence of the Great Lakes. The New York City metro area, in comparison to the rest of the state, is milder in the winter (especially in the city itself, which averages several degrees above freezing). The record low for New York state is −52 °F (−47 °C), set at Stillwater Reservoir on February 9, 1934 and at Old Forge on February 18, 1979.[2] In February 2015, Rochester experienced its coldest month ever, with an average temperature of 12.2 °F (−11 °C);[7] while later that year had a near-record warm November and a record-breaking December. The latter month was about 12 degrees F warmer than average, and several degrees over the previous record.[8]
| City | Jan | Feb | Mar | Apr | May | Jun | Jul | Aug | Sep | Oct | Nov | Dec | |
|---|---|---|---|---|---|---|---|---|---|---|---|---|---|
| Albany | max min |
31 (−1) 13 (−11) |
34 (1) 16 (−9) |
44 (7) 25 (−4) |
57 (14) 36 (2) |
70 (21) 46 (8) |
78 (26) 55 (13) |
82 (28) 60 (16) |
80 (27) 58 (14) |
71 (22) 50 (10) |
60 (16) 39 (4) |
48 (9) 31 (−1) |
36 (2) 20 (−7) |
| Binghamton | max min |
28 (−2) 15 (−9) |
31 (−1) 17 (−8) |
41 (5) 25 (−4) |
53 (12) 35 (2) |
66 (19) 46 (8) |
73 (23) 54 (12) |
78 (26) 59 (15) |
76 (24) 57 (14) |
68 (20) 50 (10) |
57 (14) 40 (4) |
44 (7) 31 (−1) |
33 (1) 21 (−6) |
| Buffalo | max min |
31 (−1) 18 (−8) |
33 (1) 19 (−7) |
42 (6) 26 (−3) |
54 (12) 36 (2) |
66 (19) 48 (9) |
75 (24) 57 (14) |
80 (27) 62 (17) |
78 (26) 60 (16) |
70 (21) 53 (12) |
59 (15) 43 (6) |
47 (8) 34 (1) |
36 (2) 24 (−4) |
| Lake Placid | max min |
27 (−3) 5 (−15) |
32 (0) 8 (−13) |
40 (4) 16 (−9) |
54 (12) 29 (−2) |
66 (19) 39 (4) |
74 (23) 48 (9) |
78 (26) 53 (12) |
76 (24) 51 (11) |
69 (21) 44 (7) |
56 (13) 34 (1) |
44 (7) 25 (−4) |
32 (0) 12 (−11) |
| Long Beach | max min |
39 (4) 23 (−5) |
40 (4) 24 (−4) |
48 (9) 31 (−1) |
58 (14) 40 (4) |
69 (21) 49 (9) |
77 (25) 60 (16) |
83 (28) 66 (19) |
82 (28) 64 (18) |
75 (24) 57 (14) |
64 (18) 45 (7) |
54 (12) 36 (2) |
44 (7) 28 (−2) |
| New York City | max min |
38 (3) 26 (−3) |
41 (5) 28 (−2) |
50 (10) 35 (2) |
61 (16) 44 (7) |
71 (22) 54 (12) |
79 (26) 63 (17) |
84 (29) 69 (21) |
82 (28) 68 (20) |
75 (24) 60 (16) |
64 (18) 50 (10) |
53 (12) 41 (5) |
43 (6) 32 (0) |
| Rochester | max min |
31 (−1) 17 (−8) |
33 (1) 17 (−8) |
43 (6) 25 (−4) |
55 (13) 35 (2) |
68 (20) 46 (8) |
77 (25) 55 (13) |
81 (27) 60 (16) |
79 (26) 59 (15) |
71 (22) 51 (11) |
60 (16) 41 (5) |
47 (8) 33 (1) |
36 (2) 23 (−5) |
| Syracuse | max min |
31 (−1) 14 (−10) |
34 (1) 16 (−9) |
43 (6) 24 (−4) |
56 (13) 35 (2) |
68 (20) 46 (8) |
77 (25) 55 (13) |
82 (28) 60 (16) |
80 (27) 59 (15) |
71 (22) 51 (11) |
60 (16) 40 (4) |
47 (8) 32 (0) |
36 (2) 21 (−6) |
Cloudiness
Southeast sections of the state have an average annual cloud cover of 59-62%, while areas of western New York around Buffalo average 71-75% cloud cover annually.[9]
Precipitation
Average precipitation across the region show maxima within the mountains of the Appalachians. Between 28 inches (710 mm) and 62 inches (1,600 mm) of precipitation falls annually across the Northeastern United States,[10] and New York's averages are similar, with maxima of over 60 inches (1,500 mm) falling across southwestern Lewis county, northern Oneida county, central and southern Hamilton county, as well as northwestern Ulster county. The lowest amounts occur near the northern borders with Vermont and Ontario, as well as much of southwestern sections of the state.[11] Temporally, a maximum in precipitation is seen around three peak times: 3 a.m., 10 a.m., and 6 p.m. During the summer, the 6 p.m. peak is most pronounced.[12]

Coastal extratropical cyclones, known as nor'easters, bring a bulk of the wintry precipitation to the region during the cold season as they track parallel to the coastline, forming along the natural temperature gradient of the Gulf stream before moving up the coastline.[13] The Appalachian Mountains largely shield New York City from picking up any lake-effect snow,[14] which develops in the wake of extratropical cyclones downwind of the Great Lakes. The Finger Lakes of New York are long enough for lake-effect precipitation. Lake-effect snow from the Finger Lakes (like elsewhere) occurs in upstate New York until those lakes freeze over.[15] Annual average lake-effect snows exceed 150 inches (380 cm) downwind of Lake Erie and 200 inches (510 cm) downwind of Lake Ontario.[16]
During the summer and early fall, mesoscale convective systems can move into the area from Canada and the Great Lakes. Tropical cyclones and their remains occasionally move into the region from the south and southwest.[17] The region has experienced a couple heavy rainfall events that exceeded the 50-year return period, during October 1996 and October 1998, which suggest an increase in heavy rainfall along the coast.[18]
Air pollution
In terms of emissions, New York ranks 46th among the 50 states in the amount of greenhouse gases generated per person. This efficiency is primarily due to the state's higher rate of mass transit use in and around New York City.[19]
However, New York City (particularly Manhattan) has extremely high rates of air pollution, with high particle pollution[20] and high cancer rates,[21] which can be explained by extreme population density, despite low per capita emissions rates.
Severe weather
New York experiences an average of ten tornadoes per year,[22] with one tornado every five years considered strong or violent (EF2-EF5).[23] The return period for hurricane impacts on the state is 18–19 years,[24] with major hurricane return periods between 70–74 years.[25] In 2016, much of New York experienced a severe drought, including the Finger Lakes region, where the drought was preceded by a very mild winter with minimal snow pack.
See also
References
- ↑ Northeast Regional Climate Center (2012). "Normal Average Temperatures (Deg F): Annual (1971-2000)". Cornell University. Retrieved 2012-03-14.
- 1 2 3 "Climate of New York". New York State Climate Office - Cornell University. Archived from the original on April 12, 2008. Retrieved April 10, 2008.
- ↑ Gerald D. Bell; Lance F. Bosart (January 1988). "Appalachian Cold Air Damming". Monthly Weather Review. American Meteorological Society. 116: 137. Bibcode:1988MWRv..116..137B. doi:10.1175/1520-0493(1988)116<0137:ACAD>2.0.CO;2. Retrieved 2012-03-14.
- ↑ National Aeronautics and Space Administration Goddard Space Flight Center (2012-03-07). "Reducing the Urban Heat Island Effect: Bright Is the New Black as New York Roofs Go Cool". ScienceDaily. Retrieved 2012-03-14.
- ↑ Average Weather for Huntington, NY - Temperature and Precipitation
- ↑ Average Weather for Ticonderoga, NY - Temperature and Precipitation
- ↑ Orr, Steve (February 26, 2015). "Rochester's coldest month. Ever.". Democrat & Chronicle. Retrieved December 24, 2015.
- ↑ Lahman, Sean (December 24, 2015). "Record warmth, but snow is coming". Democrat & Chronicle. Retrieved December 24, 2015.
- ↑ National Climatic Data Center (2005-06-24). "Mean Sky Cover (Percent)" (PDF). National Oceanic or Atmospheric Administration. Retrieved 2012-03-14.
- ↑ Allan D. Randall (1996). Mean Annual Runoff, Precipitation, and Evapotranspiration in the Glaciated Northeast United States, 1951-1980. United States Geological Survey. Retrieved on 2008-03-01.
- ↑ Christopher Daily; Jenny Weisburg (2008-12-19). "Annual Average Precipitation: New York". Western Region Climate Center. Retrieved 2012-03-14.
- ↑ Michael G. Landin; Lance F. Bosart (June 1985). "Diurnal Variability of Precipitation in the Northeastern United States". Monthly Weather Review. American Meteorological Society. 113 (6): 989–1014. Bibcode:1985MWRv..113..989L. doi:10.1175/1520-0493(1985)113<0989:DVOPIT>2.0.CO;2. Retrieved 2008-03-01.
- ↑ George J. Maglaras; Jeff S. Waldstreicher; Paul J. Kocin; Anthony F. Gigi; Robert A. Marine (March 1995). "Winter Weather Forecasting throughout the Eastern United States. Part 1: An Overview". Weather and Forecasting. American Meteorological Society. 10: 6. Bibcode:1995WtFor..10....5M. doi:10.1175/1520-0434(1995)010<0005:wwftte>2.0.co;2.
- ↑ Frank P. Colby, Jr. (2003). Mesoscale Snow Bands in an Ocean-Effect Snowstorm. University of Massachusetts Lowell. Retrieved on 2008-03-01.
- ↑ Neil F. Laird (2004). Understanding Lake-Effect Snow Storms in the Finger Lakes & Great Lakes Regions. Finger Lakes Institute. Retrieved on 2008-03-01.
- ↑ National Weather Service Forecast Office, Buffalo, New York (2003-09-23). "Average Seasonal Snowfall Over the Eastern Great Lakes Region". National Weather Service Eastern Region Headquarters. Archived from the original on 2013-12-10. Retrieved 2012-03-14.
- ↑ David R. Vallee (Summer 2002). A Centennial Review of Major Land-Falling Tropical Cyclones in Southern New England. Government of Massachusetts. Retrieved on 2008-03-01.
- ↑ Barry Keim (June 1999). Current Climate of the New England Region: New England Regional Assessment. University of New Hampshire. Retrieved on 2008-03-19.
- ↑ The New York Post (2007-06-03). "A Breath of Fresh New York Air". Retrieved 2007-06-06.
- ↑ http://www.lungusa2.org/sota/2009/SOTA-2009-Full-Print.pdf
- ↑ http://www.epa.gov/nata2002/tables.html
- ↑ National Climatic Data Center (2012-03-07). "U.S. Tornado Climatology". National Oceanic and Atmospheric Administration. Retrieved 2012-03-14.
- ↑ National Climatic Data Center (2012-03-07). "Average Annual Number of EF3-EF5 Tornadoes". National Oceanic and Atmospheric Administration. Retrieved 2012-03-14.
- ↑ National Hurricane Center (2012-03-01). "Return Period (Years) Hurricane". National Oceanic and Atmospheric Administration. Retrieved 2012-03-14.
- ↑ National Hurricane Center (2012-03-01). "Return Period (Years) Major Hurricane". National Oceanic and Atmospheric Administration. Retrieved 2012-03-14.
