2009 Pacific hurricane season
 | |
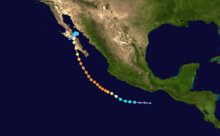
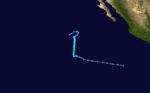
| Season summary map | |
| First system formed | June 18, 2009 |
|---|---|
| Last system dissipated | October 27, 2009 |
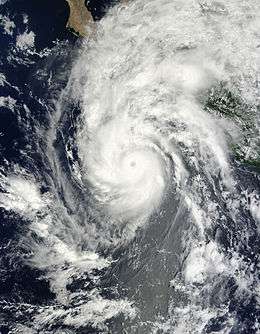
| Strongest storm1 | Rick (Third most intense hurricane in the Pacific basin) – 906 mbar (hPa) (26.75 inHg), 180 mph (285 km/h) (1-minute sustained) |
| Total depressions | 23 |
| Total storms | 20 |
| Hurricanes | 8 |
| Major hurricanes (Cat. 3+) | 5 |
| Total fatalities | 10 direct, 5 indirect |
| Total damage | $188.7 million (2009 USD) |
| 1Strongest storm is determined by lowest pressure | |
2007, 2008, 2009, 2010, 2011 | |
| Related article | |
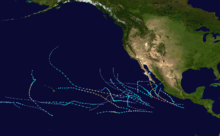
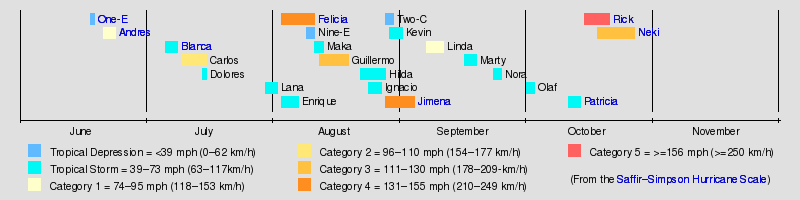
The 2009 Pacific hurricane season was the most active Pacific hurricane season since 1994. The season officially started on May 15 in the East Pacific Ocean, and on June 1 in the Central Pacific; they both ended on November 30. These dates conventionally delimit the period of each year when most tropical cyclones form in the Pacific basin. However, the formation of tropical cyclones is possible at any time of the year.
For the first time in ten years, no tropical depressions formed during the month of May. This inactivity continued into the early part of June and was the least active since 1994.[1] The first named storm of the season did not develop until June 21, marking the latest start to a Pacific hurricane season in 40 years. However, according to the NHC's tropical weather summary, August 2009, with seven named storms in their region, was one of the most active Augusts on record for the basin. This level of activity had rarely occurred, if at all, in the past 41 years, since 1968, when the most active August on record for the region with eight named storms occurred.[2] When Hurricane Rick reached Category 5 strength on October 17, 2009, it became the first Category 5 Eastern Pacific hurricane since Ioke in 2006, and the third-strongest Pacific hurricane on record, behind 2015's Patricia and 1997's Linda. The first Central Pacific name to be used was Lana, when it crossed into the region from the Eastern Pacific. With the naming of Tropical Storm Maka on August 11, this season became the first in seven years to use multiple Central Pacific names.
Seasonal forecasts
| Source | Date | Named storms |
Hurricanes | Major hurricanes |
| NOAA | Average[3][4] | 15.3 (3 – 5) |
8.8 ( – ) |
4.2 ( – ) |
| NOAA | 1995-2008 average[3] | 14 | 7 | 3 |
| NOAA | May 21, 2009[3][5] | 13 – 18 (3 – 5) |
6 – 10 ( – ) |
2 – 5 ( – ) |
| Record high activity | 27 | 16 (Tie) | 11 | |
| Record low activity | 8 (Tie) | 3 | 0 (Tie) | |
| –––––––––––––––––––––––––––––––––––––– | ||||
| Actual activity | 17 (6) |
7 (2) |
4 (1) | |
On May 21, 2009, NOAA released their forecast for the 2009 Eastern Pacific and Central Pacific hurricane seasons. They predicted a below-normal level of activity in the Eastern Pacific, with 13 to 18 named storms, of which 6 to 10 were expected to become hurricanes, and 2 to 5 expected to become major hurricanes. The forecast was based on the dissipation of a La Niña in April 2009. Sea surface temperatures were near normal around the equator makes the season an ENSO-neutral. Additionally, an El Niño was forecast to develop during the latter part of the season. Depending on the intensity of the El Niño, forecasters were unsure of whether or not it would have an effect on the overall activity in the basin. However, due to the low-activity cycle that began in 1995, the El Niño only brought the activity to a slightly above normal season.[3]
The Central Pacific basin was also expected to be slightly below average, with three to five tropical cyclones expected to form or cross into the area. However, it was slightly more active than expected, the number of three to five was exceeded, as seven tropical cyclones moved into or formed in the Central Pacific.[5]
Season summary
The 2009 eastern Pacific season was characterized as "near-normal",[6] featuring 17 named storms, 7 hurricanes and 4 major hurricanes. The central Pacific experienced above-average activity with three additional storms forming west of 140°W and three more crossing over from the eastern Pacific.[4][7] The overall number of storms contrasted to a relative lull in activity experienced over the previous decade. During the course of the year, large-scale factors such as an El Niño and two Madden–Julian oscillations greatly contributed to the changed pattern.[8] The season's activity, east of 140°W, was reflected with a near-average cumulative accumulated cyclone energy (ACE) rating of 100, roughly 94% of the 30-year median.[7][9] ACE is, broadly speaking, a measure of the power of the hurricane multiplied by the length of time it existed, so storms that last a long time, as well as particularly strong hurricanes, have high ACEs. ACE is only calculated for full advisories on tropical systems at or exceeding 34 knots (39 mph, 63 km/h) or tropical storm strength.[9]
The 2009 season started at a below-average pace, with only one named storm forming by the end of June. This marked the first time since 2000 that no tropical storms formed during the month of May; however, on average only one storm develops in the month every other year. The ten-year span of May named storms marked the longest occurrence of this event.[1] The first hurricane of the year, Hurricane Andres, also became the first June hurricane since Hurricane Carlotta in 2000.[7][10] Below-average activity continued into July with four named storms forming. By the end of the month, season to date ACE values were roughly 37% of the long-term mean, the sixth lowest since reliable records began in 1971.[10]
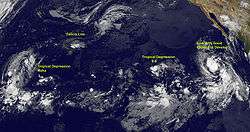
An abrupt shift in activity took place during August as seven named storms formed, three of which became major hurricanes. This marked the most storms to form in a single month since 1985 and the most in August since 1968.[11] Of these storms, Hurricane Jimena became the first cyclone of the season to make landfall, as well as the strongest storm to strike the west coast Baja California Sur, alongside Hurricane Norbert in 2008.[12] Following the well-above average August, September experienced below-average activity with ACE reaching 70% of the long-term mean.[13] The final month of activity featured the third-strongest storm on record in the eastern Pacific: Hurricane Rick. A Category 5 storm, Rick attained winds of 180 mph (285 km/h) off the coast of Mexico on October 18 before succumbing to increased wind shear and dry air. ACE for the month was 59% above average, mostly attributed to Rick.[14]
Storms
Tropical Depression One-E
| Tropical depression (SSHWS) | |||
|---|---|---|---|
| |||
| Duration | June 18 – June 19 | ||
| Peak intensity | 35 mph (55 km/h) (1-min) 1003 mbar (hPa) | ||
The first system of the season, One-E formed out of a tropical wave on June 18 roughly 405 mi (650 km) south-southwest of Mazatlán and initially tracked slowly northwards. Throughout the day, convection developed around the center of circulation and the system was anticipated to become a tropical storm.[15] Late on June 18, the National Hurricane Center noted that the system was on the verge of becoming a tropical storm.[16] However, the following day, strong wind shear caused the depression to rapidly degenerate into a trough of low pressure before dissipating off the coast of Sinaloa.[15]
Although no longer a tropical cyclone, the remnants of the depression brought moderate rainfall to parts of Sinaloa, Nayarit and Jalisco. High winds accompanied the rainfall and left about 50,000 residences without power. Several trees were downed and some structures sustained damage from fresh water flooding. Landslides occurred along major highways and significant structural damage was reported around Mazatlán.[17][18] However, there was no loss of life or reports of injuries.[15]
Hurricane Andres
| Category 1 hurricane (SSHWS) | |||
|---|---|---|---|
| |||
| Duration | June 21 – June 24 | ||
| Peak intensity | 80 mph (130 km/h) (1-min) 984 mbar (hPa) | ||
Hurricane Andres formed on June 21 out of an area of disturbed weather associated with a shower and thunder storm that crossed Central America a few days earlier. Andres gradually intensified as it tracked along the Mexican coastline. Deep convection developed around the center of circulation and by June 23, the storm attained hurricane-status, peaking with winds of 80 mph (130 km/h). Upon attaining this intensity, the storm featured a developing eyewall within a central dense overcast. Within 36 hours, the storm rapidly degenerated, having most of the convection being displaced by high wind shear, becoming a non-tropical trough during the afternoon of June 24.[19]
Prior to becoming a tropical depression, Andres produced heavy rainfall Oaxaca and Honduras, resulting in two deaths.[20] Rough seas off the coast of Guerrero resulted in one fatality.[19] Inland, flooding caused by heavy rains killed two people and injured twenty.[21] Several dozen structures were damaged and a few were destroyed.[22] Following the storm, roughly 350 people were left homeless.[23]
Tropical Storm Blanca
| Tropical storm (SSHWS) | |||
|---|---|---|---|
| |||
| Duration | July 6 – July 9 | ||
| Peak intensity | 50 mph (85 km/h) (1-min) 998 mbar (hPa) | ||


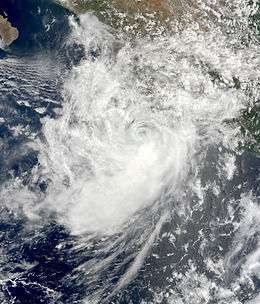
On June 29, a tropical wave originating off the coast of Africa entered the eastern Pacific. Convection associated with the wave gradually consolidated around a low pressure system by July 4. Further organization took place over the next two days before the low was declared a tropical depression on July 6; upon classification, the depression was situated roughly 435 mi (700 km) south of Cabo San Lucas, Mexico. Tracking west-northwest in response to a mid-level ridge, the depression quickly intensified into a tropical storm, at which time it was named Blanca.[24] During the day, satellite imagery depicted an eye-like feature;[25] however, this did not develop further and was no longer present a few hours later.[26] Early on July 7, Blanca attained peak winds of 50 mph (85 km/h) before succumbing to decreasing sea surface temperatures. Convection gradually diminished over the following days and the system degenerated into a remnant low by July 9. Remaining a well-defined system, the remnants continued northwestward before turning due north and dissipating on July 12 over the open waters of the Pacific.[24]
Hurricane Carlos
| Category 2 hurricane (SSHWS) | |||
|---|---|---|---|
| |||
| Duration | July 10 – July 16 | ||
| Peak intensity | 105 mph (165 km/h) (1-min) 971 mbar (hPa) | ||

On July 9, showers and thunderstorms associated with an area of disturbed weather located about 900 mi (1,400 km) south of the southern tip of Baja California became more concentrated around a developing low level centre. In the early hours of July 10, the system was designated as Tropical Depression Four-E, and the NHC commenced advisories. Around 2:00 p.m. PDT, the system strengthened into Tropical Storm Carlos. On July 11, Tropical Storm Carlos strengthened into a minimal Category 1 hurricane. It also developed a small eye feature, based on satellite presentation. However, by morning of July 12, the National Hurricane Center noted that the small eye-like feature had disappeared. Overnight on July 11 through the morning of July 12, the structure of Carlos became disorganized for unknown reasons. Deep convection contracted to a small region around the center of circulation and the overall size of the storm diminished. In the early afternoon hours, the continued degeneration of the system led to its downgrade to tropical storm status. Throughout the rest of the 12th and until mid-day on July 13, Carlos continued to weaken, but the weakening trend slightly abated, enough for Carlos to reintensify slightly, from 50 mph to 65 mph. The NHC that day predicted Carlos to either stay at 65 mph for the next three days or so, or to constantly fluctuate in intensity.
However, by July 14, a new eye wall developed and Carlos was given hurricane status again. It rapidly intensified to a peak of 105 mph (165 km/h). By the end of July 14, the eye had started to get less defined, and on July 15, the system began a weakening trend. On July 16, Carlos degenerated into a remnant low, and the final advisory was issued.[27]
Tropical Storm Dolores
| Tropical storm (SSHWS) | |||
|---|---|---|---|
| |||
| Duration | July 15 – July 16 | ||
| Peak intensity | 60 mph (95 km/h) (1-min) 997 mbar (hPa) | ||

On July 11, a broad area of low pressure developed within a tropical wave several hundred miles south of Acapulco, Mexico. Shower and thunderstorm activity associated with the system gradually increased over the next several days as it tracked west-northwestward. By July 15, the low became sufficiently organized and was declared a tropical depression roughly 695 mi (1,120 km) of Manzanillo, Colima. Turning towards the northwest in response to a ridge over Mexico, the depression intensified into Tropical Storm Dolores later that day.[28] Despite southwesterly wind shear displacing the center of Dolores from the deepest convection,[29] the system continued to strengthen, attaining peak winds of 60 mph (95 km/h) on July 16. Shortly thereafter, convection associated with the storm dissipated, possibly due to entrainment of dry air. Later that day the system degenerated into a remnant low and gradually weakened. The remnants of Dolores eventually dissipated on July 19, roughly 995 mi (1,600 km) west-southwest of Los Angeles, California.[28]
Tropical Storm Lana
| Tropical storm (SSHWS) | |||
|---|---|---|---|
| |||
| Duration | July 30 – August 2 | ||
| Peak intensity | 65 mph (100 km/h) (1-min) 995 mbar (hPa) | ||


On July 30, the NHC began issuing advisories on Tropical Depression Six-E near the Central Pacific Hurricane Center's area of responsibility. Later that day, it moved into the Central Pacific as a tropical depression, quickly strengthening into Tropical Storm Lana, the first Central Pacific storm since 2008's Kika. Lana is one of six central Pacific tropical cyclones to form as a depression in the eastern Pacific but be named in the Central; the others were Lala, Iniki, Li, Ela and Ulika. Lana was also the first tropical cyclone to cross from the eastern north to central north Pacific since 2007's Flossie.[7] It also started to develop an eye feature, based on satellite imagery. But, southerly shear, introduced by a large upper-level trough, caused Lana to become slightly disorganized on July 31. Despite this, Lana reached its peak intensity of 65 mph early on August 1, and slowly weakened to become a very disorganized, yet still fairly strong tropical storm, maintaining maximum winds of 50 mph for the next couple of days. However, Lana weakened to a tropical depression late on August 2, while continuing to quickly become disorganized. Lana degenerated to a remnant low on August 3, roughly 580 miles southwest of Honolulu, and 410 miles east of Johnston Island, with the CPHC issuing their last advisory at the same time. Lana's remnants lingered for the next day or so, until dissipating on August 4.
Tropical Storm Enrique
| Tropical storm (SSHWS) | |||
|---|---|---|---|
| |||
| Duration | August 3 – August 7 | ||
| Peak intensity | 65 mph (100 km/h) (1-min) 994 mbar (hPa) | ||
Tropical Storm Enrique developed out of a broad area of low pressure several hundred miles south-southwest of Baja California Sur. The center of circulation was embedded within a central dense overcast and located within an area favoring further development. The depression tracked just north of due west in response to a mid-tropospheric ridge north of the system. Upon becoming a tropical cyclone, a second area of low pressure, that would later become Hurricane Felicia located nine degrees of longitude to the west, had the possibility to develop into a tropical depression and possibly influence the system.[30] Late on August 3, the depression intensified to a tropical storm and was given the name Enrique. Enrique strengthened to reach a peak intensity of 65 mph on August 4. However, interaction with Hurricane Felicia weakened the system late that evening, with maximum winds decreasing to 50 mph. Enrique maintained winds of 50 mph for the next day or so, until early on August 6, when the NHC downgraded Enrique to depression status. On August 7, the NHC issued their final advisory on Enrique as the system degenerated into a remnant low.
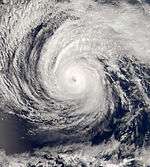
Hurricane Felicia
| Category 4 hurricane (SSHWS) | |||
|---|---|---|---|
| |||
| Duration | August 3 – August 11 | ||
| Peak intensity | 145 mph (230 km/h) (1-min) 935 mbar (hPa) | ||


Hurricane Felicia developed out of a broad area of low pressure that formed several hundred miles southwest of Baja California Sur on August 3, developing into Tropical Depression Eight-E the next day, shortly after Tropical Depression Seven-E formed directly to the east. It strengthened into a tropical storm and was named Felicia early on August 4. It rapidly strengthened that morning as an eyewall quickly developed, the rapid intensification being attributed to warm water along the forecast track, which allowed for more rapid intensification. Felicia continued to intensify and became a hurricane that afternoon. Rapid intensification continued into that evening, and the NHC upgraded Felicia to a Category 2 hurricane. It continued to rapidly strengthen, becoming the first major hurricane of the season on the morning of August 5, when the NHC upgraded it to a Category 3 hurricane. Later that day, Felicia rapidly intensified to a Category 4 hurricane, with maximum winds increasing to 145 mph (230 km/h), making it the strongest storm in the Eastern Pacific since Daniel in 2006. The NHC predicted that Felicia would rapidly weaken during the next couple of days starting on August 6, but it was also noted by the NHC that Felicia was displaying annular hurricane characteristics, which would allow for it to maintain intensity for longer than expected over marginal SSTS.
On August 8 it crossed into the Central Pacific basin, gradually weakening to a tropical storm and then a tropical depression as it approached the Hawaiian Islands. Tropical storm and flash flood watches were issued on August 7 for the Big Island of Hawaii and Maui County, and were extended to include Oahu on August 9. The watches for the Big Island were later canceled as the track for Felicia appeared to turn toward the north. All watches were canceled at 11 a.m. HST August 11 as Felicia dissipated to a remnant low.[31]
Tropical Depression Nine-E
| Tropical depression (SSHWS) | |||
|---|---|---|---|
| |||
| Duration | August 9 – August 11 | ||
| Peak intensity | 35 mph (55 km/h) (1-min) 1006 mbar (hPa) | ||
Tropical Depression Nine-E developed out of a small area of low pressure west-southwest of Baja California on August 9. Nine-E initially formed as a tropical wave that had entered the eastern Pacific on August 1, but was ill-defined, and difficult to trace. The NHC had initially forecast Nine-E to strengthen to a tropical storm by August 10, but moderate shear inhibited development, and the depression was no longer forecast to strengthen to a tropical storm, as the shear inhibited deep convection within the depression's circulation. Shear continually inhibited development until the end, when Nine-E degenerated to a remnant low on August 12. The next day, the NHC noted the possibility for regeneration of the system, although, by late on the 14th, the disturbance had weakened, and was becoming embedded in the ITCZ, as a result, the probability for regeneration was low. Nine-E's remnants dissipated on August 15, while located just within the central Pacific.
Tropical Storm Maka
| Tropical storm (SSHWS) | |||
|---|---|---|---|
| |||
| Duration | August 11 – August 13 (Exited basin) | ||
| Peak intensity | 40 mph (65 km/h) (1-min) 1008 mbar (hPa) | ||
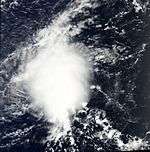

Tropical Storm Maka was first identified on August 8, 2010 by the Central Pacific Hurricane Center (CPHC) as an area of disturbed weather roughly 835 mi (1,345 km) south of Lihue, Hawaii. Situated over warm waters, estimated at 28 °C (82 °F) and within an area of low wind shear, the system gradually intensified as it tracked northwestward in response to a subtropical ridge to the north.[32] By August 11, convection had consolidated around an area of low pressure that formed within the system. Since further development was expected, a Tropical Cyclone Formation Alert was issued.[33] Shortly thereafter, the CPHC upgraded the low to a tropical depression, assigning it with the identifier One-C.[32] Over the following 12 hours, further development took place, and the depression intensified into a tropical storm. Upon attaining this intensity, the storm was given the name Maka from the list of names for the Central Pacific basin.[32] The next afternoon, the final advisory on Maka was issued as it weakened, degenerating into a remnant low, likely caused by unexpected shear. The remnants of Tropical Storm Maka crossed the international dateline and moved into the Western Pacific, regenerating into a tropical depression.
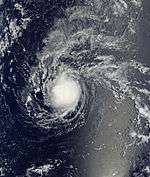
Hurricane Guillermo
| Category 3 hurricane (SSHWS) | |||
|---|---|---|---|
| |||
| Duration | August 12 – August 19 | ||
| Peak intensity | 125 mph (205 km/h) (1-min) 954 mbar (hPa) | ||
Hurricane Guillermo formed on August 12 from a broad area of low pressure nearly 700 miles SW of Baja California. The system developed a good series of banding features and convection, and as a result, in the afternoon later that day, it strengthened into a tropical storm, the seventh in the eastern Pacific that year. On August 14, it strengthened to become the fourth hurricane of the season, concurrent to the development of a good, banding type eye. That afternoon, Guillermo strengthened to a Category 2 hurricane with maximum winds increasing to 100 mph (155 km/h). Early on August 15, Guillermo intensified to become the second major hurricane of the season, as it was upgraded by the NHC to a Category 3 hurricane, with maximum winds increasing to 125 mph (205 km/h). On August 16 it crossed into the Central Pacific basin as a Category 1 hurricane, and then quickly weakened to a tropical storm thereafter due to very high wind shear. Despite over very strong as high as 45 mph of shear, Guillermo survived as a weak tropical storm for a further 3 days before weakening to a depression and degenerating to a remnant low on August 19, near the West Coast. However, the remnants continued to curve towards the northeast for the next several days, before finally dissipating on August 23.[34]
Although Guillermo remained well away from land, large swells produced by the system resulted in 6 to 8 feet (1.8 to 2.4 m) surf along the eastern coasts of the Hawaiian Islands between August 18 and 19.[35]
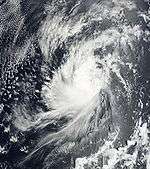
Tropical Storm Hilda
| Tropical storm (SSHWS) | |||
|---|---|---|---|
| |||
| Duration | August 22 – August 28 | ||
| Peak intensity | 65 mph (100 km/h) (1-min) 995 mbar (hPa) | ||


Tropical Depression Eleven-E formed toward the western edge of the eastern Pacific basin on August 22, and soon strengthened to become Tropical Storm Hilda. The next day it crossed the 140°W meridian and passed into the CPHC's area of responsibility. On August 26, Hilda quickly weakened to a depression after several small pulses of brief convection in the disorganized center, but these waned quickly when it weakened to depression status. Hilda also attempted, but failed, to reorganize its overall structure throughout the late 25th and most of the 26th. The system's structure continued to degrade, and finally, on August 28, the CPHC issued their final advisory on Hilda, as it had degenerated into a remnant low. The remnants of Hilda lingered for several days, until finally dissipating on the 31st.
Tropical Storm Ignacio
| Tropical storm (SSHWS) | |||
|---|---|---|---|
| |||
| Duration | August 24 – August 27 | ||
| Peak intensity | 50 mph (85 km/h) (1-min) 999 mbar (hPa) | ||


Ignacio formed as a portion of the same tropical wave that caused the formation of Tropical Storm Ana in the Atlantic. The portion of the wave that would become Ignacio crossed Central America for three days, from August 16 to the 19th, and the next day, while the wave axis was located over the eastern Pacific, shower and thunderstorm activity began to increase, but associated convection remained minimal. Two days later, on the 22nd, the wave transformed into a broad area of low pressure, with convective activity organizing enough over the next couple of days to be classified as Tropical Depression Twelve-E on August 24 about 660 mi (1060 km) SW of the southern tip of the Baja California peninsula. Though convection within the rainband located along the western semicircle of the system diminished somewhat, the system continued to become better organized, and became a tropical storm that evening, receiving the name Ignacio. Despite the upgrade, the storm was not well organized, with several smaller circulations rotating around the center of circulation. Ignacio weakened to a tropical depression on the morning of August 27, as it moved over sub-26 °C SSTs, the lowest temperature needed to support a tropical cyclone, and entered an environment of stable air. The system continued to weaken, and Ignacio degenerated into an area of low pressure later on that day.
Hurricane Jimena
| Category 4 hurricane (SSHWS) | |||
|---|---|---|---|
| |||
| Duration | August 28 – September 4 | ||
| Peak intensity | 155 mph (250 km/h) (1-min) 931 mbar (hPa) | ||
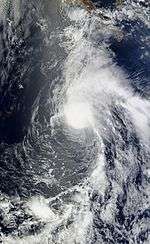
Tropical Depression Thirteen-E formed out of an area of disturbed weather associated with a tropical wave that had formed in the western Caribbean, moving across Central America earlier in the week, and slowly developed off the west coast of Mexico, about 200 miles south of Acapulco, until it organized into a tropical depression early in the morning of August 29. It soon strengthened to become Tropical Storm Jimena, and intensified rapidly to become a Category 2 hurricane later the same day as a pinhole eye developed. The next day it strengthened into a Category 3 hurricane, becoming the third major hurricane of season. Later that day, it continued to intensify and became a Category 4 hurricane. However, by the morning of August 31, the eye had become less defined, likely because of an eyewall replacement cycle. The NHC noted in their tropical weather discussion released at 8 p.m. PDT on the 31st that Jimena may have been a Category 5 earlier in the day; however, the intensity was not upgraded in the post-season analysis. As Jimena moved over cooler waters, and shear began to increase, it began to weaken starting on September 1, weakening below major hurricane status later that day. The storm soon made first landfall of the season as a weak Category 2 early the next day near Cabo San Lazaro, Mexico. Jimena then made second and final landfall as a weakening Category 1 later that day, near San Buenaventura, Mexico, also causing an unknown amount of damage there. Finally, around 0300 UTC on the 3rd, Jimena weakened to a tropical storm, but despite reemerging in the Gulf of California, Jimena continued to weaken. Early on September 4, the storm weakened to a tropical depression, while moving extremely slowly over the Gulf of California, and it degenerated into a remnant low later that day.
Owing to the storm's slow movement, torrential rains fell over much of Baja California Sur and Sinaloa, resulting in widespread flooding.[36] In Guaymas, a record 26.54 in (671.9 mm) of rain fell in association with Jimena. According to a report by Mexico's Centro Nacional de Prevención de Desastres, the magnitude of the event was analyzed to be a once in 2000 year occurrence.[37] Thousands of homes were damaged or destroyed across Baja California and much of Puerto Lopez Mateos was leveled. Significant damage to infrastructure not only left people without water and power, it hampered relief efforts as many towns were isolated from surrounding areas.[36] At least six people were killed and an estimated 72,000 were affected across the region.[38][39] Total losses related to Hurricane Jimena reached 2.3 billion pesos ($173.9 million).[40]
Tropical Depression Two-C
| Tropical depression (SSHWS) | |||
|---|---|---|---|
| |||
| Duration | August 28 – August 30 (Exited basin) | ||
| Peak intensity | 35 mph (55 km/h) (1-min) 1007 mbar (hPa) | ||

A small area of disturbed weather developed into Tropical Depression Two-C to the southwest of Kauai at 1200 UTC on August 28. Despite favorable conditions, sustained winds did not exceed 35 mph (55 km/h). Early the next day, the depression crossed the International Date Line and warning responsibility of the system was passed on to the Japan Meteorological Agency. By August 30, the depression began weakening and degenerated back into an area of disturbed weather. The remnants tracked further west-northwestward into the West Pacific for the next few days, before dissipating early on September 2.
Tropical Storm Kevin
| Tropical storm (SSHWS) | |||
|---|---|---|---|
| |||
| Duration | August 29 – September 1 | ||
| Peak intensity | 50 mph (85 km/h) (1-min) 1000 mbar (hPa) | ||
Kevin formed from Tropical Depression Fourteen-E on August 29 from an area of disturbed weather 1000 miles southwest of Baja California. The system strengthened to Tropical Storm Kevin later that day, the seventh named storm in August, and the tenth tropical cyclone of the month overall. Kevin began to weaken early on August 30, and this trend continued for the next day or so, until early on the 31st, when Kevin weakened to a tropical depression. Kevin continued to degrade, and the NHC declared it dissipated on September 1, as it had weakened to a remnant low. It finally was absorbed into the ITCZ in the area of Central Pacific on September 8, seven days after it had weakened into a remnant low.
Hurricane Linda
| Category 1 hurricane (SSHWS) | |||
|---|---|---|---|
| |||
| Duration | September 7 – September 11 | ||
| Peak intensity | 80 mph (130 km/h) (1-min) 985 mbar (hPa) | ||
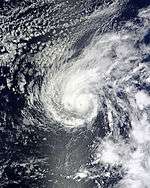
A tropical wave exited Africa into the Atlantic Ocean on August 18, and the northern portion split to become Tropical Storm Danny. The wave continued westward without development, crossing Central America into the Pacific Ocean on August 28. Convection remained minimal until September 3, when the system became better organized. A Low-pressure area developed on September 6, and deep convection consolidated around the circulation. Early on September 7, the National Hurricane Center (NHC) designated the low as Tropical Depression Fifteen-E about 1,130 miles (1,820 kilometres) west-southwest of the southern tip of the Baja California Peninsula.[41] Moving over warm water temperatures and modest wind shear, gradual intensification was anticipated.[42] The depression moved slowly to the west due to a weakening subtropical ridge to its north. Shortly after developing, the depression intensified into Tropical Storm Linda. By September 9, a new ridge developed east of Linda, causing the storm to turn northwestward.[41] Despite intensifying into a strong tropical storm, Linda's low-level circulation was misaligned from its upper circulations, although the system developed expansive outflow to the south and east.[43]
Late on September 9, Linda attained hurricane status, and although an eye developed, it was not over the center due to increasing wind shear. Early on September 10, Linda attained peak winds of 80 mph (130 km/h) and a pressure of 985 mbar (hPa; 29.09 inHg).[41] Operationally, the NHC assessed Linda to have been slightly stronger with peak winds of 85 mph (140 km/h).[44] Persistent wind shear eroded the eyewall and led to weakening.[45] Compounded with decreasing water temperatures, Linda deteriorated to tropical storm status early on September 11.[41] At that time, the center became exposed and lacked deep convection.[46] After the intrusion of dry air, the convection dissipated,[47] and late on September 11, the NHC issued their final advisory on Linda after it degenerated into a remnant low.[48] At this time, the system weakened below tropical storm intensity. The remnants of Linda persisted for several more days, initially tracking southwest before turning due west. The system eventually dissipated on September 15 roughly 1,195 mi (1,925 km) east of the Hawaiian Islands.[41]
Tropical Storm Marty
| Tropical storm (SSHWS) | |||
|---|---|---|---|
| |||
| Duration | September 16 – September 19 | ||
| Peak intensity | 45 mph (75 km/h) (1-min) 1002 mbar (hPa) | ||
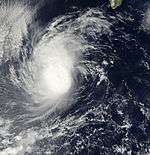

Marty's origins can be found in a tropical wave that crossed the African coastline on August 28, with minimal convection during its entire journey across the Atlantic. The wave passed though the Lesser Antilles on September 5, entering the Caribbean that same day, and eventually crossed Central America and entered the eastern Pacific on the 10th. Convection was scattered and disorganized, but slowly organized until a broad area of low pressure formed along the wave axis, and soon formed into Tropical Depression Sixteen-E on September 16 from the low pressure area, while about 340 mi SSW of Cabo San Lucas. Within a few hours it strengthened to become a tropical storm and receive the name Marty. Marty strengthened to reach peak intensity of 45 mph on September 17, but southwesterly shear caused by a mid-upper level trough and the entrainment of dry, stable air into the storm's circulation caused the system to begin weakening. Despite this, and reaching sub-26.5 °C water temperatures, Marty managed to remain at tropical storm strength until 1800 UTC on the 18th, when it finally weakened back to depression strength. With all environmental factors against it, and almost completely devoid of any convection, on September 19, the NHC issued their last advisory on Marty as it had weakened into a remnant low. The remnants lingered until eventual complete dissipation on September 23.
Tropical Storm Nora
| Tropical storm (SSHWS) | |||
|---|---|---|---|
| |||
| Duration | September 23 – September 25 | ||
| Peak intensity | 60 mph (95 km/h) (1-min) 997 mbar (hPa) | ||
On September 21, a broad area of low pressure formed about 900 mi west-southwest of the southern tip of Baja California. The disturbance slowly started to organize, strengthening into a tropical depression late on September 22 (September 23 in UTC time). On the early morning of September 23, the depression strengthened into a tropical storm and received the name Nora. On September 23, Tropical Storm Nora reached a peak intensity of 60 mph before starting to weaken back into a depression on September 24. Early on September 25, the NHC issued their last advisory on Nora, as it weakened into a remnant low. However, the remnant low of Nora continued to drift westward for the next 4 days, before dissipating on September 29.[49]
Tropical Storm Olaf
| Tropical storm (SSHWS) | |||
|---|---|---|---|
| |||
| Duration | October 1 – October 3 | ||
| Peak intensity | 45 mph (75 km/h) (1-min) 996 mbar (hPa) | ||
Tropical Depression Eighteen-E formed from a broad area of low pressure on October 1, and quickly strengthened to become Tropical Storm Olaf. However, as it moved north or northeast towards the Baja California peninsula, cooler waters and shearing winds caused it to weaken to a tropical depression on October 3. Later that day, the NHC issued their last advisory on Olaf, as it weakened into a remnant low. The remnant low of Olaf continued to drift eastward for the next day, before dissipating over Baja California Sur on October 4.[50]
In Baja California Sur, heavy rains from the remnants of Olaf resulted in flooding of low-lying areas in several municipalities, notably near the city of La Paz. Officials in the affected regions also opened shelters if residents wanted to seek refuge away from their home.[51] Heavy rains, amounting to 1.7 in (43 mm), fell across portions of Sonora hit hard by Hurricane Jimena a month earlier; however, no damage resulted from Olaf.[52]
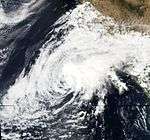
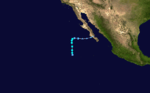
Tropical Storm Patricia
| Tropical storm (SSHWS) | |||
|---|---|---|---|
| |||
| Duration | October 11 – October 14 | ||
| Peak intensity | 60 mph (95 km/h) (1-min) 996 mbar (hPa) | ||


Patricia developed from a tropical wave that traversed the Atlantic Ocean during September and was first classified as a tropical depression on October 11 several hundred miles south of the Baja California Peninsula. The system quickly intensified into a tropical storm as it tracked in a general northward direction. By October 12, Patricia attained its peak intensity with winds of 60 mph (95 km/h) and a minimum barometric pressure of 996 mbar (hPa; 29.41 inHg). The following day, increasing wind shear and unfavorable conditions caused the storm to rapidly weaken. By the morning of October 14, Patricia had degenerated into a remnant low near the southern coastline of Baja California Sur. The remnants of the storm persisted until October 15, at which time they dissipated over open waters.[53]
Although the center of Patricia did not impact land,[53] the outer bands caused significant rainfall in portions of western Mexico. In Sonora, up to 240 mm (9.4 in) of rain fell,[54] leading to significant flooding that left 600 people homeless.[55][56]
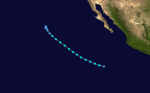
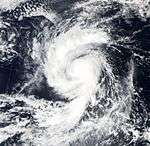
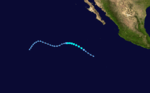
Hurricane Rick
| Category 5 hurricane (SSHWS) | |||
|---|---|---|---|
| |||
| Duration | October 15 – October 21 | ||
| Peak intensity | 180 mph (285 km/h) (1-min) 906 mbar (hPa) | ||
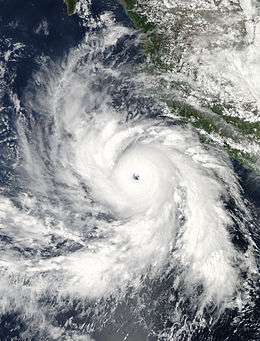
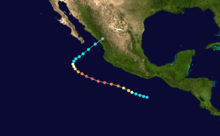
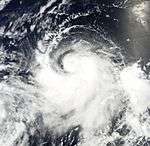
The third-strongest eastern Pacific hurricane on record, Hurricane Rick originated from a very strong tropical disturbance wave that developed into a tropical depression on October 15. Situated off the southern coast of Mexico, the depression tracked west-northwest in a region favoring explosive development. Shortly after being classified as Tropical Depression Twenty-E, the system intensified into Tropical Storm Rick. Roughly 18 hours later, Rick had become a Category 1 hurricane as it underwent rapid intensification. After a brief pause in this phase, the storm went through another period of intensification, reaching Category 5 status on October 17, becoming the first storm of this intensity since Hurricane Kenna in 2002 east of 140°W.[57]
Early on October 18, the storm attained its peak intensity with winds of 180 mph (285 km/h) and a barometric pressure of 906 mbar (hPa; 26.75 inHg).[57] Not long after attaining this intensity, the combination of increasing wind shear and dry air caused the storm to rapidly weaken. By October 19, Rick weakened below Category 3 status and began to turn north, towards the Baja California Peninsula. Continued degradation of the structure led to the hurricane being downgraded to a tropical storm on October 20. By this time, the storm had become highly asymmetric, with most deep convection being displaced to the northeast. The following day, Rick made landfall near Mazatlán with winds of 60 mph (95 km/h). The storm rapidly degenerated as it moved over land, dissipating within 12 hours of landfall.[57]
Prior to making landfall, the NHC initially forecasted Rick to make landfall in southern Baja California as a high-end Category 2 hurricane, prompting hurricane watches.[57] Officials ordered several hundred residents to evacuate from low-lying areas,[58] although tropical storm warnings replaced the hurricane watches after the storm had weakened.[57] Overall, the damage from Rick was significantly less than what was initially anticipated. Throughout Mexico, three people were killed by the storm, one in Oaxaca and two in Baja California Sur.[59][60][61] Total losses from the storm reached 192 million pesos ($14.6 million USD).[62]
Hurricane Neki
| Category 3 hurricane (SSHWS) | |||
|---|---|---|---|
| |||
| Duration | October 18 – October 27 | ||
| Peak intensity | 125 mph (205 km/h) (1-min) 950 mbar (hPa) | ||
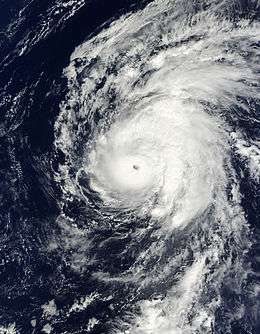
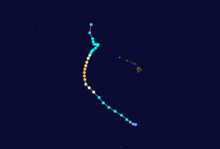
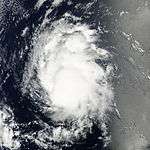
The final tropical cyclone of the season developed on October 18 as an unusually large disturbance from a trough south of Hawaii. Moving northwestward, it slowly organized at first due to its large size. After reaching hurricane status on October 21, Neki intensified at a much faster rate and peaked with winds of 125 mph (205 km/h). It later turned to the north and north-northeast and weakened due to hostile conditions. While passing through the Papahānaumokuākea Marine National Monument, Neki was downgraded to a tropical storm after the center became exposed from the deepest convection.[63] It caused little impact in the island chain.[64] After stalling and executing a small loop, Neki resumed its northward track and dissipated on October 27.[63]
Storm names
The names on the following list were used to name storms that formed in Northeastern Pacific Ocean during 2009. This is the same list used in the 2003 season and was reused during the 2015 season due to the lack of any name retirements. [7]
|
For storms that form in the Central Pacific Hurricane Center's area of responsibility, encompassing the area between 140 degrees west and the International Date Line, all names are used in a series of four rotating lists. The next four names that were slated for use in 2009 are shown below. Three of them, Lana, Maka, and Neki, were used throughout the course of the year.
|
|
|
Season effects
This is a table of all of the storms in the 2009 Pacific hurricane season. It includes their durations, peak intensities, names, landfall(s) – denoted by bold location names – damages, and death totals. Deaths in parentheses are additional and indirect (an example of an indirect death would be a traffic accident), but are still storm-related. Damage and deaths include totals while the storm was extratropical or a wave or a low. All of the damage figures are in 2009 USD.
| Saffir–Simpson hurricane wind scale | ||||||
| TD | TS | C1 | C2 | C3 | C4 | C5 |
| Storm name |
Dates active | Storm category
at peak intensity |
Max 1-min wind mph (km/h) |
Min. press. (mbar) |
Areas affected | Damage (millions USD) |
Deaths | |||
|---|---|---|---|---|---|---|---|---|---|---|
| One-E | June 18 – 19 | Tropical depression | 35 (55) | 1003 | Western Mexico, Northwest Mexico | Unknown | 0 | |||
| Andres | June 21 – 24 | Category 1 hurricane | 80 (130) | 984 | Southwestern Mexico, Western Mexico, Honduras | 0.231 | 3 (2) | |||
| Blanca | July 6 – 9 | Tropical storm | 50 (85) | 998 | Western Mexico, California | Unknown | 0 | |||
| Carlos | July 10 – 16 | Category 2 hurricane | 105 (165) | 971 | None | None | 0 | |||
| Dolores | July 15 – 16 | Tropical storm | 60 (95) | 997 | None | None | 0 | |||
| Lana | July 30 – August 2 | Tropical storm | 65 (100) | 995 | None | None | 0 | |||
| Enrique | August 3 – 7 | Tropical storm | 65 (100) | 994 | None | None | 0 | |||
| Felicia | August 3 – 11 | Category 4 hurricane | 145 (230) | 935 | Hawaii | Unknown | 0 | |||
| Nine-E | August 9 – 11 | Tropical depression | 35 (55) | 1006 | None | None | 0 | |||
| Maka | August 11 – 13 | Tropical storm | 40 (65) | 1008 | None | None | 0 | |||
| Guillermo | August 12 – 19 | Category 3 hurricane | 125 (205) | 954 | Hawaii | None | 0 | |||
| Hilda | August 22 – 28 | Tropical storm | 65 (100) | 995 | None | None | 0 | |||
| Ignacio | August 24 – 27 | Tropical storm | 50 (85) | 999 | None | None | 0 | |||
| Jimena | August 28 – September 4 | Category 4 hurricane | 155 (250) | 931 | Western Mexico, Northwest Mexico (Baja California Sur), Southwestern United States | 173.9 | 4 (2) | |||
| Two-C | August 28 – August 30 | Tropical depression | 35 (55) | 1007 | None | None | 0 | |||
| Kevin | August 29 – September 1 | Tropical storm | 50 (85) | 1000 | None | None | 0 | |||
| Linda | September 7 – 11 | Category 1 hurricane | 80 (130) | 985 | None | None | 0 | |||
| Marty | September 16 – 19 | Tropical storm | 45 (75) | 1002 | None | None | 0 | |||
| Nora | September 23 – 25 | Tropical storm | 60 (95) | 997 | None | None | 0 | |||
| Olaf | October 1 – 3 | Tropical storm | 45 (75) | 996 | Baja California Peninsula | None | 0 | |||
| Patricia | October 11 – 14 | Tropical storm | 60 (95) | 996 | Baja California Peninsula, Northwest Mexico | None | 0 | |||
| Rick | October 15 – 21 | Category 5 hurricane | 180 (285) | 906 | Western Mexico (Sinaloa), Northwest Mexico, Southern United States | 14.6 | 3 (1) | |||
| Neki | October 18 – 27 | Category 3 hurricane | 125 (205) | 950 | Hawaii | None | 0 | |||
| Season Aggregates | ||||||||||
| 23 cyclones | June 18 – October 27 | 180 (285) | 906 | 188.731 | 10 (5) | |||||
See also
- List of Pacific hurricanes
- List of Pacific hurricane seasons
- 2009 Atlantic hurricane season
- 2009 Pacific typhoon season
- 2009 North Indian Ocean cyclone season
- South-West Indian Ocean cyclone seasons: 2008–09, 2009–10
- Australian region cyclone seasons: 2008–09, 2009–10
- South Pacific cyclone seasons: 2008–09, 2009–10
References
- 1 2 Eric S. Blake (June 1, 2009). "Eastern Pacific Tropical Weather Summary for May 2009". National Hurricane Center. National Oceanic and Atmospheric Administration. Retrieved August 21, 2011.
- ↑ "Tropical Weather Summary". National Hurricane Center. 2009-09-01. Archived from the original on 8 May 2010. Retrieved 2010-05-12.
- 1 2 3 4 Climate Prediction Center, NOAA (May 21, 2009). "NOAA: 2008 Tropical Eastern North Pacific Hurricane Outlook". National Oceanic and Atmospheric Administration. Archived from the original on June 11, 2009. Retrieved June 11, 2009.
- 1 2 "Climatology of Tropical Cyclones in the Central Pacific Basin". Central Pacific Hurricane Center. National Oceanic and Atmospheric Administration. August 22, 2009. Archived from the original on 16 July 2011. Retrieved August 21, 2011.
- 1 2 Central Pacific Hurricane Center, NOAA (May 20, 2009). "NOAA Predicts Near to Below Normal Central Pacific Hurricane Season" (PDF). National Oceanic and Atmospheric Administration. Retrieved June 11, 2009.
- ↑ Todd B. Kimberlain and Michael J. Brennan (June 2011). "Eastern North Pacific Hurricane Season of 2009". Monthly Weather Review. American Meteorological Society. 139 (6): 1657–72. Bibcode:2011MWRv..139.1657K. doi:10.1175/2010MWR3497.1.
- 1 2 3 4 5 National Hurricane Center; Hurricane Research Division; Central Pacific Hurricane Center. "The Northeast and North Central Pacific hurricane database 1949–2015". United States National Oceanic and Atmospheric Administration's National Weather Service. A guide on how to read the database is available here.
- ↑ Jennifer M. Collins and David R. Roache (June 2011). "The 2009 Hurricane Season in the Eastern North Pacific Basin: An Analysis of Environmental Conditions". Monthly Weather Review. American Meteorological Society. 139 (6): 1673–82. Bibcode:2011MWRv..139.1673C. doi:10.1175/2010MWR3538.1.
- 1 2 "Background Information: East Pacific Hurricane Season". Climate Prediction Center. National Oceanic and Atmospheric Administration. May 19, 2011. Archived from the original on 21 July 2011. Retrieved August 21, 2011.
- 1 2 Eric S. Blake (July 1, 2009). "Eastern Pacific Tropical Weather Summary for June 2009". National Hurricane Center. National Oceanic and Atmospheric Administration. Retrieved August 21, 2011.
- ↑ Hurricane Specialists Unit (September 3, 2009). "Eastern Pacific Tropical Weather Summary for August 2009". National Hurricane Center. National Oceanic and Atmospheric Administration. Retrieved August 21, 2011.
- ↑ John L. Beven (January 29, 2010). "Tropical Cyclone Report: Hurricane Jimena" (PDF). National Hurricane Center. National Oceanic and Atmospheric Administration. Retrieved August 21, 2011.
- ↑ Hurricane Specialists Unit (October 1, 2009). "Eastern Pacific Tropical Weather Summary for September 2009". National Hurricane Center. National Oceanic and Atmospheric Administration. Retrieved August 21, 2011.
- ↑ Hurricane Specialists Unit (November 1, 2009). "Eastern Pacific Tropical Weather Summary for October 2009". National Hurricane Center. National Oceanic and Atmospheric Administration. Retrieved August 21, 2011.
- 1 2 3 Eric S. Blake (July 31, 2009). "Tropical Cyclone Report: Tropical Depression One-E" (PDF). National Hurricane Center. National Oceanic and Atmospheric Administration. Retrieved August 21, 2011.
- ↑ Christopher W. Landsea and Jack L. Beven (June 18, 2009). "Tropical Depression One-E Discussion Three". National Hurricane Center. National Oceanic and Atmospheric Administration. Retrieved August 21, 2011.
- ↑ Staff Writer (June 19, 2009). "Vigilan autoridades de Sinaloa comportamiento de depresión tropical" (in Spanish). SDP Noticias. Archived from the original on 22 June 2009. Retrieved June 19, 2009.
- ↑ Staff Writer (June 19, 2009). "Causa estragos la depresión tropical en Mazatlán" (in Spanish). Noroeste. Archived from the original on 24 June 2009. Retrieved June 19, 2009.
- 1 2 Daniel P. Brown (July 21, 2009). "Hurricane Andres Tropical Cyclone Report" (PDF). National Hurricane Center. Retrieved July 31, 2009.
- ↑ Wilder Pérez R. (June 23, 2009). ""Andrés" no afectará a Nicaragua" (in Spanish). La Prensa. Archived from the original on 26 June 2009. Retrieved July 30, 2009.
- ↑ Staff Writer (June 24, 2009). "Roza primer huracán del año y mueren tres" (in Spanish). Excelsior.
- ↑ Staff Writer (June 24, 2009). "Hurricane Andres weakens, pulls away from Mexican coast". Deutsche Presse-Agentur. Archived from the original on 29 June 2009. Retrieved July 30, 2009.
- ↑ VALADEZ LUVIANO, Rodolfo (June 25, 2009). "Deja la tormenta tropical Andrés unos 350 damnificados en Atoyac" (in Spanish). La Jornada, Guerrero. Archived from the original on 29 June 2009. Retrieved July 31, 2009.
- 1 2 Richard J. Pasch (November 23, 2009). "Tropical Cyclone Report: Tropical Storm Blanca" (PDF). National Hurricane Center. National Oceanic and Atmospheric Administration. Retrieved August 24, 2011.
- ↑ Todd L. Kimberlain and Daniel Brown (July 6, 2009). "Tropical Storm Blanca Discussion One". National Hurricane Center. National Oceanic and Atmospheric Administration. Retrieved August 24, 2011.
- ↑ Todd L. Kimberlain and Daniel Brown (July 6, 2009). "Tropical Storm Blanca Discussion Two". National Hurricane Center. National Oceanic and Atmospheric Administration. Retrieved August 24, 2011.
- ↑ Forecaster Pasch. "Tropical Depression Carlos, Public Advisory #28". National Hurricane Center. Retrieved July 16, 2009.
- 1 2 John L. Beven II (January 15, 2010). "Tropical Cyclone Report: Tropical Storm Dolores" (PDF). National Hurricane Center. National Oceanic and Atmospheric Administration. Retrieved August 24, 2011.
- ↑ Dave Roberts and Michael Brennan (July 15, 2009). "Tropical Storm Dolores Discussion Four". National Hurricane Center. National Oceanic and Atmospheric Administration. Retrieved August 24, 2011.
- ↑ Pasch and Roberts (August 3, 2009). "Tropical Depression Seven-E Discussion One". National Hurricane Center. Retrieved August 3, 2009.
- ↑ Knabb (August 11, 2009). "Tropical Depression Felicia Public Advisory 33". Central Pacific Hurricane Center. Retrieved August 11, 2009.
- 1 2 3 Timothy A. Craig (November 15, 2009). "Tropical Storm Maka Tropical Cyclone Report". Central Pacific Hurricane Center. Retrieved October 20, 2010.
- ↑ "Tropical Cyclone Formation Alert". Joint Typhoon Warning Center. August 11, 2009. Archived from the original on August 11, 2009. Retrieved October 20, 2010.
- ↑ http://www.nhc.noaa.gov/data/tcr/EP102009_Guillermo.pdf
- ↑ "Hawaii Event Report: High Surf". National Climatic Data Center. 2009. Retrieved August 24, 2011.
- 1 2 Patricia Rains (September 7, 2009). "Disaster Relief Begins in US after Hurricane Jimena beats Baja California Sur". MexiData. Retrieved August 22, 2011.
- ↑ "Características e Impacto Socioeconòmico de los Principales Desastres Ocurridos en la República Mexicana en el Año 2009" (PDF) (in Spanish). Centro Nacional de Prevención de Desastres. October 2010. p. 99. Retrieved August 22, 2011.
- ↑ "Mexico: Hurricane Jimena" (PDF). International Federation of the Red Cross and Red Crescent Societies. March 19, 2010. Retrieved August 22, 2011.
- ↑ Yesika Ojeda (September 5, 2009). "'Jimena' cobra dos vidas" (in Spanish). El Imparcial. Archived from the original on 23 July 2011. Retrieved August 22, 2011.
- ↑ "Características e Impacto Socioeconòmico de los Principales Desastres Ocurridos en la República Mexicana en el Año 2009" (PDF) (in Spanish). Centro Nacional de Prevención de Desastres. October 2010. p. 12. Retrieved August 22, 2011.
- 1 2 3 4 5 Robbie Berg (October 26, 2009). "Hurricane Linda Tropical Cyclone Report" (PDF). National Hurricane Center. Retrieved November 22, 2009.
- ↑ Richard Pasch (September 7, 2009). "Tropical Depression Fifteen-E Discussion One". National Hurricane Center. Retrieved November 22, 2009.
- ↑ Daniel Brown (September 9, 2009). "Tropical Storm Linda Discussion Nine". National Hurricane Center. Retrieved November 22, 2009.
- ↑ David Roberts and Lixion A. Avila (September 10, 2009). "Hurricane Linda Discussion Fourteen". National Hurricane Center. Retrieved November 23, 2009.
- ↑ David Roberts and Lixion A. Avila (September 10, 2009). "Hurricane Linda Discussion Fifteen". National Hurricane Center. Retrieved November 23, 2009.
- ↑ Jack Beven (September 11, 2009). "Tropical Storm Linda Discussion Seventeen". National Hurricane Center. Retrieved November 23, 2009.
- ↑ James Franklin (September 11, 2009). "Tropical Storm Linda Discussion Eighteen". National Hurricane Center. Retrieved November 23, 2009.
- ↑ David Roberts and Michael Brennan (September 11, 2009). "Tropical Depression Linda Public Advisory Twenty (Final)". National Hurricane Center. Retrieved November 23, 2009.
- ↑ http://www.nhc.noaa.gov/data/tcr/EP172009_Nora.pdf
- ↑ http://www.nhc.noaa.gov/data/tcr/EP182009_Olaf.pdf
- ↑ EFE (October 4, 2009). "La depresión tropical 'Olaf' deja fuertes lluvias a su paso por el noroeste México" (in Spanish). CM& Televisión.
- ↑ "Primeros efectos de 'Olaf' afectan a Sonora". El Universal (in Spanish). Informador. October 3, 2009. Retrieved August 24, 2011.
- 1 2 Christopher W. Landsea and Richard J. Pasch (November 10, 2009). "Tropical Cyclone Report: Tropical Storm Patricia" (PDF). National Hurricane Center. National Oceanic and Atmospheric Administration. Retrieved January 4, 2010.
- ↑ Staff Writer (2009). "Sintesis Agropecuaria De Sonora" (in Spanish). Sonora de la Secretaría de Agricultura. Archived from the original (PDF) on July 22, 2011. Retrieved January 4, 2010.
- ↑ Staff Writer (October 15, 2009). "Destruye 'Patricia' 815 has. en agro" (in Spanish). Noroeste. Retrieved January 5, 2010.
- ↑ Staff Writer (October 15, 2009). "Patricia deja sin vivienda a 600 familias" (in Spanish). La Jordana. Retrieved January 4, 2010.
- 1 2 3 4 5 John P. Cangialosi and Lixion A. Avila (December 3, 2009). "Hurricane Rick Tropical Cyclone Report" (PDF). National Hurricane Center. Retrieved January 7, 2010.
- ↑ Associated Press (October 19, 2009). "Weakening Rick threatens Baja California resorts". The Denver Post. Retrieved October 19, 2009.
- ↑ Staff Writer (October 21, 2009). "Alerta en Los Cabos por la tormenta Rick" (in Spanish). La Jordana. Retrieved October 21, 2009.
- ↑ Susy Buchanan (October 19, 2009). "Hurricane Rick kills man, nears Mexico coast". Reuters. Archived from the original on 23 October 2009. Retrieved October 20, 2009.
- ↑ Pete Thomas (October 21, 2009). "Cabo San Lucas bids farewell to Tropical Storm Rick, which caused minimal damage". Los Angeles Times. Archived from the original on 24 October 2009. Retrieved October 21, 2009.
- ↑ "Características e Impacto Socioeconòmico de los Principales Desastres Ocurridos en la República Mexicana en el Año 2009" (PDF) (in Spanish). Centro Nacional de Prevención de Desastres. October 2010. p. 6. Retrieved August 22, 2011.
- 1 2 Derek Wroe (February 5, 2010). "Hurricane Neki Tropical Cyclone Report". Central Pacific Hurricane Center. Retrieved August 19, 2011.
- ↑ Unattributed (October 17, 2009). "Overflight indicates Neki did minimal damage in Papahanaumokuakea". The Honolulu Advertiser. Archived from the original on October 31, 2009. Retrieved August 19, 2011.
Notes
- ↑ Values for the Central Pacific are shown in parenthesis.
Tropical cyclones of the 2009 Pacific hurricane season | ||
|---|---|---|
| ||
| ||