West Lothian Council election, 2012
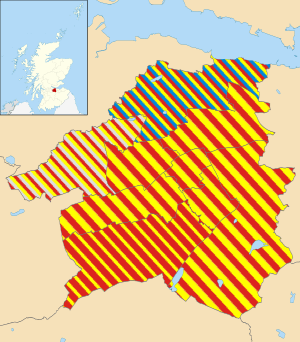
The 2012 West Lothian Council election took place on 3 May 2012 to elect members of West Lothian Council. The election will use the 9 wards created as a result of the Local Governance (Scotland) Act 2004, with each ward electing three or four Councillors using the single transferable vote system a form of proportional representation, with 33 Councillors being elected. The Bathgate Ward gained an additional seat for the 2012 elections.
The election saw Labour remain the largest party on the Council as they gained 2 seats. The Scottish National Party also made 2 net gains and significantly increased their vote share, outpolling Labour in terms of votes cast. The Scottish Conservative and Unionist Party retained their single seat on the Council and so to did the Independents. The Action to Save St. John's Hospital group were completely wiped out from the authority losing all of their 3 seats.
Following the election the Labour formed a minority administration with the support of the Conservative and Independent Councillors. This replaced the SNP minority administration which had been supported by the Conservative and Action to Save St. John's Hospital group Councillors from 2007-2012.
Election result
| West Lothian Local Election Result 2012 |
| Party |
Seats |
Gains |
Losses |
Net gain/loss |
Seats % |
Votes % |
Votes |
+/− |
| |
Labour |
16 |
2 |
0 |
+2 |
48.48 |
38.1 |
19,909 |
+1.5 |
| |
SNP |
15 |
2 |
0 |
+2 |
45.45 |
40.4 |
21,083 |
+4.1 |
| |
Conservative |
1 |
0 |
0 |
- |
3.03 |
8.8 |
4,591 |
-0.6 |
| |
Independent |
1 |
0 |
0 |
- |
3.03 |
5.3 |
2,752 |
+0.7 |
| |
Action to Save St John's Hospital |
0 |
0 |
3 |
-3 |
- |
6.7 |
3,474 |
+0.6 |
| |
Liberal Democrats |
0 |
- |
- |
- |
- |
0.4 |
200 |
-4.7 |
| |
UKIP |
0 |
- |
- |
- |
- |
0.1 |
78 |
+0.1 |
| |
National Front |
0 |
- |
- |
- |
- |
0.2 |
120 |
+0.2 |
Note: Bathgate ward is represented by four councillors, rather than three from 2012. "Votes" are the first preference votes. The net gain/loss and percentage changes relate to the result of the previous Scottish local elections on 3 May 2007. This may differ from other published sources showing gain/loss relative to seats held at dissolution of Scotland's councils.
Ward results
Linlithgow
- 2007: 1xCon; 1xSNP; 1xLab
- 2012: 1xCon; 1xSNP; 1xLab
- 2007-2012 Change: No change
| Linlithgow - 3 seats |
| Party | Candidate | % 1st Pref | Count 1 | Count 2 | Count 3 | Count 4 | Count 5 |
|
Conservative |
Tom Kerr (incumbent) |
33.18 |
2,112 |
|
|
|
|
|
SNP |
Martyn Day (incumbent)†† |
28.70 |
1,827 |
|
|
|
|
|
Labour |
Tom Conn (incumbent) |
20.30 |
1,292 |
1,453 |
1,478.7 |
1,483.2 |
1,627.9 |
|
SNP |
David Tait |
13.02 |
829 |
920.3 |
1,101.4 |
1,106.9 |
1,186.9 |
|
Action to Save St John's Hospital |
Cherie Finlay |
4.40 |
280 |
396.7 |
413.6 |
423.8 |
|
|
National Front |
Ernest Wilson |
0.39 |
25 |
30.2 |
30.6 |
|
|
| Electorate: 11,944 Valid: 6,365 Spoilt: 44 Quota: 1,592 Turnout: 6,409 (53.29%) |
Broxburn, Uphall and Winchburgh
- 2007: 2xLab; 1xSNP; 1xASSH
- 2012: 2xLab; 2xSNP
- 2007-2012 Change: SNP gain one seat from ASSH
| Broxburn, Uphall and Winchburgh - 4 seats |
| Party | Candidate | % 1st Pref | Count 1 | Count 2 | Count 3 | Count 4 | Count 5 | Count 6 |
|
SNP |
Diane Calder |
28.21 |
1,551 |
|
|
|
|
|
|
Labour |
Tony Boyle |
21.11 |
1,161 |
|
|
|
|
|
|
Labour |
Alex Davidson |
19.79 |
1,088 |
1,107.2 |
|
|
|
|
|
Action to Save St John's Hospital |
Ellen Glass (incumbent) |
13.93 |
766 |
791.6 |
816.1 |
818.7 |
996.9 |
|
|
SNP |
Janet Campbell (incumbent) |
11.22 |
617 |
1,006.4 |
1,013.2 |
1,014.1 |
1,054.3 |
1,411.2 |
|
Conservative |
George Thompson |
5.75 |
316 |
320.7 |
324.1 |
324.6 |
|
|
| Electorate: 13,558 Valid: 5,499 Spoilt: 99 Quota: 1,100 Turnout: 5,598 (40.56%) |
Livingston North
- 2007: 2xSNP; 1xLab; 1xASSH
- 2012: 2xSNP; 2xLab
- 2007-2012 Change: Lab gain one seat from ASSH
| Livingston North - 4 seats |
| Party | Candidate | % 1st Pref | Count 1 | Count 2 | Count 3 | Count 4 | Count 5 | Count 6 | Count 7 | Count 8 |
|
SNP |
Robert De Bold (incumbent) |
25.30 |
1,551 |
|
|
|
|
|
|
|
|
Labour |
Anne McMillan |
21.95 |
1,346 |
|
|
|
|
|
|
|
|
SNP |
Andrew Miller (incumbent) |
18.14 |
1,112 |
1,353.5 |
|
|
|
|
|
|
|
Labour |
Angela Moohan |
11.27 |
691 |
700.2 |
710.2 |
813.9 |
839.3 |
944.7 |
1,101.9 |
1,222.6 |
|
Conservative |
Alison Adamson |
7.81 |
479 |
486.9 |
490.4 |
493.9 |
523.6 |
607.5 |
|
|
|
SNP |
Annmargaret Watson |
7.01 |
430 |
457.8 |
550.9 |
552 |
562 |
642.7 |
678.9 |
|
|
Action to Save St John's Hospital |
Claire Lynch |
6.36 |
390 |
405.2 |
412.9 |
415.9 |
453.5 |
|
|
|
|
Liberal Democrats |
Caron Marianne Howden |
2.15 |
132 |
139.1 |
141.5 |
143.1 |
|
|
|
|
| Electorate: 16,271 Valid: 6,131 Spoilt: 90 Quota: 1,227 Turnout: 6,221 (37.68%) |
Livingston South
- 2007: 2xLab; 2xSNP
- 2012: 2xLab; 2xSNP
- 2007-2012 Change: No change
| Livingston South - 4 seats |
| Party | Candidate | % 1st Pref | Count 1 | Count 2 | Count 3 | Count 4 | Count 5 | Count 6 |
|
Labour |
Lawrence Fitzpatrick (incumbent) |
34.89 |
2,395 |
|
|
|
|
|
|
SNP |
Peter Johnston (incumbent) |
24.34 |
1,671 |
|
|
|
|
|
|
Labour |
Danny Logue (incumbent) |
13.01 |
893 |
1,631.7 |
|
|
|
|
|
SNP |
John Muir (incumbent) |
11.92 |
818 |
867.1 |
966.2 |
986 |
1,015.6 |
1,534.4 |
|
SNP |
John Lindsay |
5.84 |
401 |
444.9 |
603.8 |
622.1 |
648.5 |
|
|
Conservative |
Nick Davis |
5.45 |
374 |
425.2 |
428.8 |
448.9 |
|
|
|
Action to Save St John's Hospital |
Derreck Allen McCullough |
4.55 |
312 |
376.9 |
392.4 |
458.9 |
679.3 |
731.3 |
| Electorate: 16,441 Valid: 6,864 Spoilt: 73 Quota: 1,373 Turnout: 6,937 (41.75%) |
East Livingston and East Calder
- 2007: 2xLab; 2xSNP
- 2012: 2xLab; 2xSNP
- 2007-2012 Change: No change
| East Livingston and East Calder - 4 seats |
| Party | Candidate | % 1st Pref | Count 1 | Count 2 | Count 3 | Count 4 | Count 5 |
|
Labour |
Dave King (incumbent) |
32.14 |
1,914 |
|
|
|
|
|
SNP |
Frank Anderson (incumbent) |
19.26 |
1,147 |
1,161.7 |
1,164.8 |
1,180.9 |
1,398.6 |
|
SNP |
Carl John (incumbent) |
16.89 |
1,006 |
1,058.4 |
1,061.2 |
1,094.1 |
1,304.3 |
|
Labour |
Frank Toner |
11.45 |
682 |
1,237.6 |
|
|
|
|
SNP |
Lis Bardell |
7.62 |
454 |
462.3 |
464.5 |
485.9 |
|
|
Action to Save St John's Hospital |
Jean Ann Finch |
6.38 |
380 |
407.9 |
419.3 |
607.3 |
637.3 |
|
Conservative |
Evelyn Stirling |
6.25 |
372 |
386.7 |
389.9 |
|
|
| Electorate: 14,346 Valid: 5,955 Spoilt: 92 Quota: 1,192 Turnout: 6,047 (41.51%) |
Fauldhouse and the Briech Valley
- 2007: 2xLab; 1xSNP
- 2012: 2xLab; 1xSNP
- 2007-2012 Change: No change
| Fauldhouse and the Briech Valley - 3 seats |
| Party | Candidate | % 1st Pref | Count 1 | Count 2 | Count 3 | Count 4 | Count 5 | Count 6 |
|
Labour |
David Dodds |
33.30 |
1,713 |
|
|
|
|
|
|
SNP |
Garry Knox |
17.57 |
904 |
929.6 |
949.1 |
1,023.6 |
1,039.2 |
|
|
Labour |
Cathy Muldoon (incumbent) |
17.53 |
902 |
1,235.7 |
1,264.5 |
1,423.6 |
|
|
|
SNP |
Greg McCarra (incumbent) |
17.42 |
896 |
905.7 |
931.2 |
1,063.7 |
1,085.5 |
1,999.8 |
|
Action to Save St John's Hospital |
Jim Warnock |
10.34 |
532 |
557.4 |
647.6 |
|
|
|
|
Conservative |
Alastair Lowrie |
3.83 |
197 |
202.5 |
|
|
|
|
| Electorate: 11,239 Valid: 5,144 Spoilt: 106 Quota: 1,287 Turnout: 5,250 (45.77%) |
Whitburn and Blackburn
- 2007: 2xLab; 1xSNP; 1xASSH
- 2012: 2xLab; 2xSNP
- 2007-2012 Change: SNP gain one seat from ASSH
| Whitburn and Blackburn - 4 seats |
| Party | Candidate | % 1st Pref | Count 1 | Count 2 | Count 3 | Count 4 | Count 5 | Count 6 | Count 7 | Count 8 |
|
Labour |
George Paul (incumbent) |
32.59 |
1,896 |
|
|
|
|
|
|
|
|
SNP |
Jim Dickson (incumbent) |
27.68 |
1,610 |
|
|
|
|
|
|
|
|
Labour |
Barry Robertson |
11.96 |
696 |
1,356.2 |
|
|
|
|
|
|
|
Action to Save St John's Hospital |
George Beurskens (incumbent) |
10.64 |
619 |
639.8 |
668.9 |
712.4 |
729.7 |
760.3 |
886.4 |
|
|
SNP |
Mary Dickson |
9.66 |
562 |
575.1 |
964 |
986.7 |
996.9 |
1,012.3 |
1,058.5 |
1,317.4 |
|
Conservative |
Stuart Martin |
4.66 |
271 |
273.3 |
277.5 |
287.6 |
312.2 |
337.1 |
|
|
|
National Front |
Neil McIvor |
1.63 |
95 |
98.5 |
100.7 |
104.5 |
108.6 |
|
|
|
|
Liberal Democrats |
Robert Durie Howden |
1.17 |
68 |
72.2 |
75.8 |
83.7 |
|
|
|
|
| Electorate: 11,239 Valid: 5,817 Spoilt: 108 Quota: 1,164 Turnout: 5,925 (41.75%) |
Bathgate
- 2007: 2xSNP; 1xLab
- 2012: 2xLab; 2xSNP
- 2007-2012 Change: No change Lab gain extra seat
| Bathgate - 4 seats |
| Party | Candidate | % 1st Pref | Count 1 | Count 2 | Count 3 | Count 4 | Count 5 | Count 6 | Count 7 |
|
Labour |
John McGinty (incumbent) |
22.59 |
1,314 |
|
|
|
|
|
|
|
SNP |
Jim Walker (incumbent) |
22.04 |
1,282 |
|
|
|
|
|
|
|
Labour |
Harry Cartmill |
19.56 |
1,138 |
1,231.1 |
|
|
|
|
|
|
SNP |
William H. Boyle (incumbent) |
18.69 |
1,087 |
1,094.8 |
1,123.8 |
1,127.9 |
1,135.2 |
1,174.7 |
1,215.1 |
|
Independent |
Jamie Firth |
6.63 |
453 |
214.7 |
218.4 |
222.3 |
236.9 |
293.7 |
|
|
Conservative |
Charles Kennedy |
5.93 |
345 |
347.5 |
349.9 |
352.8 |
371 |
405.4 |
455.9 |
|
SNP |
Calum Laurie |
5.14 |
299 |
303.6 |
347.8 |
349.7 |
355.2 |
371.1 |
397.4 |
|
Action to Save St John's Hospital |
Douglas Banks |
3.35 |
195 |
198.5 |
201.9 |
207.8 |
224.3 |
|
|
|
UKIP |
Alistair Forrest |
1.34 |
78 |
79 |
79.8 |
80.8 |
|
|
|
| Electorate: 13,933 Valid: 5,817 Spoilt: 108 Quota: 1,164 Turnout: 5,925 (41.75%) |
Armadale and Blackridge
- 2007: 1xIndependent; 1xLab; 1xSNP
- 2012: 1xIndependent; 1xSNP; 1xLab
- 2007-2012 Change: No change
| Armadale and Blackridge - 3 seats |
| Party | Candidate | % 1st Pref | Count 1 | Count 2 |
|
Independent |
Stuart Borrowman (incumbent) |
56.68 |
2,541 |
|
|
SNP |
Isabel Hutton (incumbent)† |
19.21 |
861 |
1,217.5 |
|
Labour |
Jim Dixon (incumbent) |
17.58 |
788 |
1,283.1 |
|
SNP |
Dean Williamson |
3.75 |
168 |
229.5 |
|
Conservative |
Marion Kerr |
2.79 |
125 |
246.8 |
| Electorate: 11,247 Valid: 4,483 Spoilt: 49 Quota: 1,121 Turnout: 4,532 (39.86%) |
Post-election Changes
- † Armadale and Blackridge SNP Cllr Isabel Hutton was disqualified for non-attendance on 16 February 2015. The by-election was held on 26 March 2015 and the seat was won by the SNP's Sarah King.
- †† Linlithgow SNP Cllr Martyn Day was elected MP for Linlithgow and East Falkirk on 7 May 2015. He resigned his Council seat in July 2015 and a by-election was held on 1 October 2015 and the seat was held by the party's David Tait.
By Elections since 2012
| Armadale and Blackridge By-election (26 March 2015)- 1 Seat[1] |
| Party | Candidate | % 1st Pref | Count 1 | Count 2 | Count 3 | Count 4 |
|
SNP |
Sarah King |
43.4% |
1,620 |
1,647 |
1,676 |
1,874 |
|
Labour |
Andrew McGuire |
27.0% |
1,009 |
1,018 |
1,074 |
1,382 |
|
Independent |
Scott Mackay |
20.3% |
756 |
786 |
868 |
|
|
Conservative |
Ian Burgess |
6.8% |
255 |
264 |
|
|
|
Scottish Green |
Jenny Johnson |
2.4% |
90 |
|
|
|
| Electorate: 12,315 Valid: 3,730 Spoilt: 46 Quota: 1,866 Turnout: 3,776 (30.7%) |
| Linlithgow By-election (1 October 2015)- 1 Seat[2] |
| Party | Candidate | % 1st Pref | Count 1 | Count 2 | Count 3 | Count 4 | Count 5 |
|
SNP |
David Tait |
43.1% |
2,049 |
2,061 |
2,099 |
2,234 |
2,325 |
|
Labour |
David Manion |
22.9% |
1,088 |
1,131 |
1,175 |
1,279 |
1,644 |
|
Conservative |
Ian Burgess |
20.5% |
973 |
992 |
1,056 |
1,070 |
|
|
Scottish Green |
Maire McCormack |
5.9% |
282 |
303 |
346 |
|
|
|
Independent |
Brenda Galloway |
4.8% |
230 |
246 |
|
|
|
|
Liberal Democrats |
Caron Lindsay |
2.8% |
133 |
|
|
|
|
| Electorate: 12,516 Valid: 4,755 Spoilt: 28 Quota: 2,378 Turnout: 4,783 (38.2%) |
References
http://www.westlothian.gov.uk/Council_and_government/pol_elec_democracy/elections_and_voting/election_results