St. John's South (provincial electoral district)
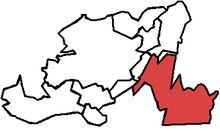 St. John's South in relation to other districts in St. John's | |
| Provincial electoral district | |
| Legislature | Newfoundland and Labrador House of Assembly |
| Last contested | 2011 |
| Demographics | |
| Population (2006) | 11,832 |
| Electors (2011) | 7,923 |
St. John’s South is a provincial electoral district for the House of Assembly of Newfoundland and Labrador, Canada. As of 2011, there are 7,923 eligible voters living within the district.[1]
Historically working class in nature, St. John's South includes increasingly prosperous residential pockets. The district covers the traditional "west end" of St. John's (now geographically closer to the centre, due to city expansion), the western section of the downtown core and the south side of the harbour to Cape Spear, including the neighbourhood of Shea Heights. In the 2007 redistribution, four per cent of Kilbride was added.[2]
Members of the House of Assembly
The district has elected the following Members of the House of Assembly:
| Member | Party | Term | |
|---|---|---|---|
| Tom Osborne | Liberal | 2013–2015 | |
| Independent | 2012-2013 | ||
| Progressive Conservative | 1996-2012 | ||
| Tom Murphy | Liberal | 1989-1996 | |
| John Collins | Progressive Conservative | 1975-89 | |
| Robert Wells | Progressive Conservative | 1972-1975 | |
| Hugh J. Shea | Progressive Conservative | 1971-1972 | |
| John A. Nolan | Liberal | 1966-1971 | |
| Rex Renouf | Progressive Conservative | 1962-1966 | |
| John R. O'Dea | United Newfoundland Party | 1959-1962 | |
| Rex Renouf | Progressive Conservative | 1957-1959 | |
| William Browne | Progressive Conservative | 1956-1957 | |
Election results
| Party | Candidate | Votes | % | ± | |
|---|---|---|---|---|---|
| Progressive Conservative | Tom Osborne | 2,966 | 57.90% | – | |
| NDP | Keith Dunne | 1,994 | 38.92% | ||
| Liberal | Trevor Hickey | 163 | 3.18% | ||
| Party | Candidate | Votes | % | ± | |
|---|---|---|---|---|---|
| Progressive Conservative | Tom Osborne | 3887 | 79.6% | – | |
| NDP | Clyde Bridger | 571 | 11.69% | ||
| Liberal | Rex Gibbons | 425 | 8.7% | ||
| Party | Candidate | Votes | % | ± | |
|---|---|---|---|---|---|
| Progressive Conservative | Tom Osborne | 4,532 | – | – | |
| Liberal | Dennis O'Keefe* | 756 | |||
| NDP | Tom McGinnis | 676 | |||
- Dennis O'Keefe who ran as the Liberal candidate is not the same Dennis O'Keefe that is currently Mayor of St. John's.
| Party | Candidate | Votes | % | ± | |
|---|---|---|---|---|---|
| Progressive Conservative | Tom Osborne | 4,041 | 66.32% | – | |
| Liberal | Patrick Kennedy | 1563 | 25.65% | ||
| NDP | Judy Vanata | 374 | 6.14% | ||
| Independent | Jason Crummey | 101 | 1.66% | ||
| Party | Candidate | Votes | % | ± | |
|---|---|---|---|---|---|
| Progressive Conservative | Tom Osborne | 2,521 | 42.17% | – | |
| Liberal | Tom Murphy | 2,417 | 40.43% | ||
| NDP | Sue Skipton | 858 | 14.35% | ||
| Independent | Bill Maddigan | 155 | 2.59% | ||
| Party | Candidate | Votes | % | ± | |
|---|---|---|---|---|---|
| Liberal | Tom Murphy | 2,432 | 47.97% | ||
| Progressive Conservative | Jerome Quinlan | 2,040 | 40.24% | – | |
| NDP | Bert Pitcher | 576 | 11.36% | ||
| Party | Candidate | Votes | % | ± | |
|---|---|---|---|---|---|
| Liberal | Thomas Murphy | 2107 | |||
| Progressive Conservative | Douglas Atkinson | 2105 | – | – | |
| NDP | Linda Hyde | 679 | |||
| Party | Candidate | Votes | % | ± | |
|---|---|---|---|---|---|
| Progressive Conservative | John Collins | 2466 | – | – | |
| Liberal | Dolores Linehan | 1145 | |||
| NDP | Bob Matthews | 924 | |||
| Party | Candidate | Votes | % | ± | |
|---|---|---|---|---|---|
| Progressive Conservative | John Collins | 2286 | – | – | |
| Liberal | Ernest Antle | 582 | |||
| NDP | Barbara Roberts | 235 | |||
References
- ↑ "Summary of Polling Divisions ST. JOHN'S SOUTH" (PDF). Elections Newfoundland and Labrador. 3 August 2011. Retrieved 4 September 2011.
- 1 2 CBC news NL votes 2007 district profiles
- ↑ Newfoundland & Labrador Votes 2007. Canadian Broadcasting Corporation. Retrieved May 22, 2009.
- ↑ Newfoundland & Labrador Votes 2003. Canadian Broadcasting Corporation. Retrieved May 22, 2009.
- 1 2 3 General Election Reports. Elections Newfoundland & Labrador. Retrieved April 6, 2011.
- 1 2 3 Report of the Chief Electoral Officer. Retrieved April 13, 2011.
External links
This article is issued from Wikipedia - version of the 12/5/2015. The text is available under the Creative Commons Attribution/Share Alike but additional terms may apply for the media files.