North Dorset (UK Parliament constituency)
Coordinates: 51°00′21″N 2°11′51″W / 51.0058°N 2.1976°W
| North Dorset | |
|---|---|
|
County constituency for the House of Commons | |
|
Boundary of North Dorset in Dorset. | |
|
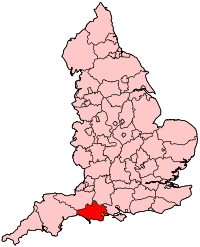
Location of Dorset within England. | |
| County | Dorset |
| Electorate | 73,010 (December 2010)[1] |
| Major settlements | Blandford Forum, Gillingham, Shaftesbury, Sturminster Newton and Verwood |
| Current constituency | |
| Created | 1885 |
| Member of parliament | Simon Hoare (Conservative) |
| Number of members | One |
| Overlaps | |
| European Parliament constituency | South West England |

North Dorset is a constituency[n 1] represented in the House of Commons of the UK Parliament by Simon Hoare, a Conservative.[n 2]
History
This seat was created by the Redistribution of Seats Act 1885, since which it has been served at various times by candidates from only two parties. For 19 of the years between 1885 and 1950 it has been served by a Liberal and for the other years it has been served only by Conservatives.
Constituency profile
The constituency covers North Dorset local government district and most (geographically) of East Dorset. It is largely rural, with a lower than average proportion of social housing and five small towns shown in the infobox. The largest town is Verwood, and the most central is the market town of Blandford Forum, north of the port of Poole.
Boundaries
1885-1918: The Municipal Borough of Shaftesbury, the Sessional Divisions of Blandford, Shaftesbury, and Sturminster, and part of the Sessional Division of Sherborne.
1918-1950: The Municipal Boroughs of Blandford Forum and Shaftesbury, the Urban District of Sherborne, the Rural Districts of Blandford, Shaftesbury, Sherborne, and Sturminster, and part of the Rural District of Wimborne and Cranborne.
1950-1983: The Municipal Boroughs of Blandford Forum and Shaftesbury, the Urban District of Wimborne Minster, and the Rural Districts of Blandford, Shaftesbury, Sturminster, and Wimborne and Cranborne.
1983-1997: The District of North Dorset, the District of Wimborne wards of Colehill, Corfe Mullen Central, Corfe Mullen North, Corfe Mullen South, Crane, Holt, Sixpenny Handley, Sturminster Marshall, Vale of Allen, and Wimborne Minster, and the District of Purbeck wards of Lytchett Matravers and Lytchett Minster.
1997-2010: The District of North Dorset, and the District of East Dorset wards of Colehill, Crane, Holt, Longham, Sixpenny Handley, Stapehill, Sturminster Marshall, Vale of Allen, and Wimborne Minster.
2010–present: The District of North Dorset, and the District of East Dorset wards of Alderholt, Crane, Handley Vale, Holt, Stour, Three Cross and Potterne, Verwood Dewlands, Verwood Newtown, and Verwood Stephen's Castle.
Members of Parliament
Elections
Elections in the 2010s
| Party | Candidate | Votes | % | ± | |
|---|---|---|---|---|---|
| Conservative | Simon Hoare[4] | 30,227 | 56.6 | +5.6 | |
| UKIP | Steve Unwin[5] | 9,109 | 17.1 | +11.9 | |
| Liberal Democrat | Hugo Miéville[6] | 6,226 | 11.7 | -25.3 | |
| Labour | Kim Fendley[7] | 4,785 | 9.0 | +3.6 | |
| Green | Richard Barrington [8] | 3,038 | 5.7 | +4.7 | |
| Majority | 21,118 | 39.6 | +25.5 | ||
| Turnout | 53,385 | 71.6 | -1.9 | ||
| Conservative hold | Swing | ||||
| Party | Candidate | Votes | % | ± | |
|---|---|---|---|---|---|
| Conservative | Robert Walter | 27,640 | 51.1 | +4.6 | |
| Liberal Democrat | Emily Gasson | 20,015 | 37.0 | -0.9 | |
| Labour | Mike Bunney | 2,910 | 5.4 | -4.2 | |
| UKIP | Jeremy Nieboer | 2,812 | 5.2 | +1.3 | |
| Green | Anna Hayball | 546 | 1.0 | -1.3 | |
| Monster Raving Loony | Roger Monksummers | 218 | 0.4 | +0.4 | |
| Majority | 7,625 | 14.1 | +9.9 | ||
| Turnout | 54,141 | 73.5 | +4.2 | ||
| Conservative hold | Swing | +2.8 | |||
Elections in the 2000s
| Party | Candidate | Votes | % | ± | |
|---|---|---|---|---|---|
| Conservative | Robert Walter | 23,714 | 44.9 | -1.8 | |
| Liberal Democrat | Emily Gasson | 21,470 | 40.7 | +2.0 | |
| Labour | John Yarwood | 4,596 | 8.7 | -2.5 | |
| UKIP | Richard Frampton Hobbs | 1,918 | 3.6 | +1.5 | |
| Green | Ralph Arliss | 1,117 | 2.1 | +2.1 | |
| Majority | 2,244 | 4.2 | -3.8 | ||
| Turnout | 52,815 | 71.1 | +4.8 | ||
| Conservative hold | Swing | -1.9 | |||
| Source BBC News, 2005 | |||||
| Party | Candidate | Votes | % | ± | |
|---|---|---|---|---|---|
| Conservative | Robert Walter | 22,314 | 46.7 | +2.4 | |
| Liberal Democrat | Emily Gasson | 18,517 | 38.7 | -0.4 | |
| Labour | Mark Wareham | 5,334 | 11.2 | +0.9 | |
| UKIP | Peter Jenkins | 1,019 | 2.1 | +0.6 | |
| Lower Excise Duty Party | Joseph Duthie | 391 | 0.8 | N/A | |
| Independent | Cora Bone | 246 | 0.5 | N/A | |
| Majority | 3,797 | 8.0 | |||
| Turnout | 47,821 | 66.3 | -10.0 | ||
| Conservative hold | Swing | +1.4 | |||
Elections in the 1990s
| Party | Candidate | Votes | % | ± | |
|---|---|---|---|---|---|
| Conservative | Robert Walter | 23,294 | 44.30 | ||
| Liberal Democrat | Paula Yates | 20,548 | 39.07 | ||
| Labour | John Fitzmaurice | 5,380 | 10.23 | ||
| Referendum | Margaret Evans | 2,564 | 4.88 | ||
| UKIP | David Wheeler | 801 | 1.52 | ||
| Majority | 2,746 | 5.22 | |||
| Turnout | 76.30 | ||||
| Conservative hold | Swing | ||||
| Party | Candidate | Votes | % | ± | |
|---|---|---|---|---|---|
| Conservative | Nicholas Baker | 34,234 | 54.6 | −2.5 | |
| Liberal Democrat | Mrs LE Siegle | 24,154 | 38.5 | +2.1 | |
| Labour | JF Fitzmaurice | 4,360 | 6.9 | +0.3 | |
| Majority | 10,080 | 16.1 | −4.6 | ||
| Turnout | 62,748 | 81.8 | +2.7 | ||
| Conservative hold | Swing | −2.3 | |||
Elections in the 1980s
| Party | Candidate | Votes | % | ± | |
|---|---|---|---|---|---|
| Conservative | Nicholas Baker | 32,854 | 57.02 | ||
| Liberal | Dr. Geoffrey W Tapper | 20,947 | 36.35 | ||
| Labour | J Hanley | 3,819 | 6.63 | ||
| Majority | 11,907 | 20.66 | |||
| Turnout | 79.10 | ||||
| Conservative hold | Swing | ||||
| Party | Candidate | Votes | % | ± | |
|---|---|---|---|---|---|
| Conservative | Nicholas Baker | 30,058 | 58.09 | ||
| Liberal | Dr. Geoffrey W Tapper | 18,678 | 36.10 | ||
| Labour | J Fox | 2,710 | 5.24 | ||
| Wessex Regionalist | David Fox | 294 | 0.57 | ||
| Majority | 11,380 | 21.99 | |||
| Turnout | 76.62 | ||||
| Conservative hold | Swing | ||||
Elections in the 1970s
| Party | Candidate | Votes | % | ± | |
|---|---|---|---|---|---|
| Conservative | Nicholas Brian Baker | 40,046 | 62.2 | ||
| Liberal | G Court | 16,750 | 26.0 | ||
| Labour | MC Rowlands | 7,543 | 11.7 | ||
| Majority | 23,296 | 36.2 | |||
| Turnout | 79.7 | ||||
| Conservative hold | Swing | ||||
| Party | Candidate | Votes | % | ± | |
|---|---|---|---|---|---|
| Conservative | David Pelham James | 28,891 | 51.15 | ||
| Liberal | Philip George Watkins | 20,350 | 36.03 | ||
| Labour | TG Jones | 7,245 | 12.8 | ||
| Majority | 8,541 | 15.1 | |||
| Turnout | 79.2 | ||||
| Conservative hold | Swing | ||||
| Party | Candidate | Votes | % | ± | |
|---|---|---|---|---|---|
| Conservative | David Pelham James | 30,288 | 50.7 | ||
| Liberal | Philip George Watkins | 23,405 | 39.2 | ||
| Labour | TG Smith | 6,032 | 10.1 | ||
| Majority | 6,883 | 11.5 | |||
| Turnout | 84.4 | ||||
| Conservative hold | Swing | ||||
| Party | Candidate | Votes | % | ± | |
|---|---|---|---|---|---|
| Conservative | David Pelham James | 28,471 | 57.9 | ||
| Liberal | Philip George Watkins | 12,095 | 24.6 | ||
| Labour | Haydn R White | 8,626 | 17.5 | ||
| Majority | 16,376 | 33.3 | |||
| Turnout | 78.5 | ||||
| Conservative hold | Swing | ||||
Elections in the 1960s
| Party | Candidate | Votes | % | ± | |
|---|---|---|---|---|---|
| Conservative | Richard Hamilton Glyn | 20,520 | 48.2 | ||
| Liberal | Richard Anthony Lamb | 15,005 | 35.2 | ||
| Labour | Jack R Rutland | 7,090 | 16.6 | ||
| Majority | 5,515 | 12.9 | |||
| Turnout | 42,615 | 81.3 | |||
| Conservative hold | Swing | ||||
| Party | Candidate | Votes | % | ± | |
|---|---|---|---|---|---|
| Conservative | Richard Hamilton Glyn | 19,898 | 48.6 | ||
| Liberal | Richard Anthony Lamb | 14,768 | 36.1 | ||
| Labour | JF Armstrong | 6,253 | 15.3 | ||
| Majority | 5,130 | 12.5 | |||
| Turnout | 40,919 | 81.7 | |||
| Conservative hold | Swing | ||||
Elections in the 1950s
| Party | Candidate | Votes | % | ± | |
|---|---|---|---|---|---|
| Conservative | Richard Hamilton Glyn | 20,255 | 52.8 | ||
| Liberal | John Alun Emlyn-Jones | 11,604 | 30.2 | ||
| Labour | H J Dutfield | 6,548 | 17.0 | ||
| Majority | 8,651 | 22.5 | |||
| Turnout | 38,407 | 82.0 | |||
| Conservative hold | Swing | ||||
| Party | Candidate | Votes | % | ± | |
|---|---|---|---|---|---|
| Conservative | Richard Hamilton Glyn | 15,513 | 45.1 | -7.0 | |
| Liberal | John Alun Emlyn-Jones | 12,411 | 36.1 | +3.7 | |
| Labour | H J Dutfield | 6,278 | 18.3 | +2.8 | |
| Independent | H C Wright | 170 | 0.5 | n/a | |
| Majority | 3,102 | 9.0 | -10.7 | ||
| Conservative hold | Swing | -5.4 | |||
| Party | Candidate | Votes | % | ± | |
|---|---|---|---|---|---|
| Conservative | Robert Fisher Crouch | 18,906 | 52.1 | ||
| Liberal | Hon. Michael Berkeley Portman | 11,747 | 32.4 | ||
| Labour | H J Dutfield | 5,633 | 15.5 | +7.5 | |
| Majority | 7,159 | ||||
| Turnout | 82.2 | ||||
| Conservative hold | Swing | ||||
| Party | Candidate | Votes | % | ± | |
|---|---|---|---|---|---|
| Conservative | Robert Fisher Crouch | 17,392 | 47.0 | ||
| Liberal | Charles Frank Byers | 16,645 | 45.0 | ||
| Labour | J. R. Tudor Griffith | 2,946 | 8.0 | ||
| Majority | 747 | 2.0 | |||
| Turnout | 86.4 | ||||
| Conservative hold | Swing | ||||
| Party | Candidate | Votes | % | ± | |
|---|---|---|---|---|---|
| Conservative | Robert Fisher Crouch | 15,324 | 43.3 | ||
| Liberal | Charles Frank Byers | 15,227 | 43.1 | ||
| Labour | J. R. Tudor Griffith | 4,807 | 13.6 | ||
| Majority | 97 | 0.3 | |||
| Turnout | 85.0 | ||||
| Conservative gain from Liberal | Swing | ||||
Elections in the 1940s
| Party | Candidate | Votes | % | ± | |
|---|---|---|---|---|---|
| Liberal | Charles Frank Byers | 14,444 | 53.7 | ||
| Conservative | Richard Hamilton Glyn | 12,479 | 46.3 | ||
| Majority | 1,965 | 7.30 | |||
| Turnout | 75.04 | ||||
| Liberal gain from Conservative | Swing | ||||
General Election 1939/40
Another General Election was required to take place before the end of 1940. The political parties had been making preparations for an election to take place and by the Autumn of 1939, the following candidates had been selected;
- Conservative: Angus Hambro
- Liberal: Frank Byers[18]
- Labour: CL Lander[19]
Elections in the 1930s
| Party | Candidate | Votes | % | ± | |
|---|---|---|---|---|---|
| Conservative | Angus Valdemar Hambro | 12,247 | 51.1 | +1.0 | |
| Liberal | Hon. William Borthwick | 11,704 | 48.9 | +11.0 | |
| Majority | 543 | 2.2 | -10.0 | ||
| Turnout | 23,951 | 73.4 | -6.3 | ||
| Conservative hold | Swing | -5.0 | |||
| Party | Candidate | Votes | % | ± | |
|---|---|---|---|---|---|
| Conservative | Sir Cecil Hanbury | 13,055 | 50.1 | -9.1 | |
| Liberal | Hon. William Borthwick | 9,871 | 37.9 | -2.9 | |
| Agriculture | George Henry Lane Fox Pitt-Rivers | 1,771 | 6.8 | n/a | |
| Labour | Miss M M Whitehead | 1,360 | 5.2 | n/a | |
| Majority | 3,184 | 12.2 | -6.2 | ||
| Turnout | 79.7 | -2.4 | |||
| Conservative hold | Swing | -3.1 | |||
| Party | Candidate | Votes | % | ± | |
|---|---|---|---|---|---|
| Conservative | Cecil Hanbury | 15,499 | 59.2 | +11.9 | |
| Liberal | Hon. William Borthwick | 10,682 | 40.8 | -3.0 | |
| Majority | 4,817 | 18.4 | +14.9 | ||
| Turnout | 82.1 | +0.7 | |||
| Conservative hold | Swing | +7.5 | |||
Elections in the 1920s
| Party | Candidate | Votes | % | ± | |
|---|---|---|---|---|---|
| Unionist | Cecil Hanbury | 12,203 | 47.3 | -6.0 | |
| Liberal | Hon. William Borthwick | 11,281 | 43.8 | -2.9 | |
| Labour | Colin Grant Clark | 2,298 | 8.9 | n/a | |
| Majority | 922 | 3.5 | |||
| Turnout | 25,782 | 81.4 | |||
| Unionist hold | Swing | -1.5 | |||

| Party | Candidate | Votes | % | ± | |
|---|---|---|---|---|---|
| Unionist | Cecil Hanbury | 11,819 | 53.3 | +5.1 | |
| Liberal | John Emlyn Emlyn-Jones | 10,341 | 46.7 | -5.1 | |
| Majority | 1,478 | 6.6 | +10.2 | ||
| Turnout | 86.5 | +2.2 | |||
| Unionist gain from Liberal | Swing | +5.1 | |||
| Party | Candidate | Votes | % | ± | |
|---|---|---|---|---|---|
| Liberal | John Emlyn Emlyn-Jones | 10,992 | 51.8 | -0.5 | |
| Unionist | Cecil Hanbury | 10,211 | 48.2 | +0.5 | |
| Majority | 781 | 3.6 | -1.0 | ||
| Turnout | 84.3 | ||||
| Liberal hold | Swing | -0.5 | |||
| Party | Candidate | Votes | % | ± | |
|---|---|---|---|---|---|
| Liberal | John Emlyn Emlyn-Jones | 10,805 | 52.3 | ||
| Unionist | Cecil Hanbury | 9,869 | 47.7 | ||
| Majority | 936 | 4.6 | |||
| Turnout | |||||
| Liberal gain from Unionist | Swing | ||||
Elections in the 1910s
| Party | Candidate | Votes | % | ± | |
|---|---|---|---|---|---|
| Unionist | 7,532 | ||||
| Liberal | John Emlyn Emlyn-Jones | 7,320 | |||
| Majority | |||||
| Turnout | |||||
| Unionist hold | Swing | ||||
- endorsed by the Coalition Government
| Party | Candidate | Votes | % | ± | |
|---|---|---|---|---|---|
| Conservative | Sir Randolf Littlehales Baker | 3,919 | 50.2 | ||
| Liberal | Arthur Walters Wills | 3,887 | 49.8 | ||
| Turnout | 7,806 | 91.6 | |||
| Majority | 32 | 0.4 | |||
| Conservative hold | Swing | ||||
| Party | Candidate | Votes | % | ± | |
|---|---|---|---|---|---|
| Conservative | Sir Randolf Littlehales Baker | 4,093 | 50.9 | +5.1 | |
| Liberal | Arthur Walters Wills | 3,944 | 49.1 | -5.1 | |
| Majority | 149 | 1.8 | |||
| Turnout | 93.3 | ||||
| Conservative gain from Liberal | Swing | +5.1 | |||
Elections in the 1900s
| Party | Candidate | Votes | % | ± | |
|---|---|---|---|---|---|
| Liberal | Arthur Walters Wills | 4,153 | 54.2 | -1.8 | |
| Conservative | Sir Randolf Littlehales Baker | 3,508 | 45.8 | +1.8 | |
| Majority | 8.4 | -3.6 | |||
| Turnout | 90.2 | -0.6 | |||
| Liberal hold | Swing | -1.8 | |||
| Party | Candidate | Votes | % | ± | |
|---|---|---|---|---|---|
| Liberal | Arthur Walters Wills | 4,239 | 56.0 | +9.9 | |
| Conservative | Sir Randolf Littlehales Baker | 3,330 | 44.0 | -9.9 | |
| Majority | 12.0 | 19.8 | |||
| Turnout | 90.8 | ||||
| Liberal gain from Conservative | Swing | +9.9 | |||
| Party | Candidate | Votes | % | ± | |
|---|---|---|---|---|---|
| Conservative | John Kenelm Digby Wingfield-Digby | 3,705 | 53.9 | ||
| Liberal | Hon. George Arthur Maurice Hamilton-Gordon | 3,165 | 46.1 | ||
| Majority | 540 | 7.8 | |||
| Turnout | 82.6 | ||||
| Conservative hold | Swing | ||||
See also
Notes and references
- Notes
- ↑ A county constituency (for the purposes of election expenses and type of returning officer)
- ↑ As with all constituencies, the constituency elects one Member of Parliament (MP) by the first past the post system of election at least every five years.
- References
- ↑ "Electorate Figures - Boundary Commission for England". 2011 Electorate Figures. Boundary Commission for England. 4 March 2011. Retrieved 13 March 2011.
- ↑ Leigh Rayment's Historical List of MPs – Constituencies beginning with "D" (part 2)
- ↑ "Election Data 2015". Electoral Calculus. Archived from the original on 17 October 2015. Retrieved 17 October 2015.
- ↑ "Simon Hoare chosen as the Conservative candidate for Dorset North". Conservative Home. Retrieved 2 February 2015.
- ↑ http://ukpollingreport.co.uk/2015guide/dorsetnorth/
- ↑ "Hugo Miéville". Lib Dems. Retrieved 15 January 2014.
- ↑ "Kim Fendley". Labour.
- ↑ http://www.westerngazette.co.uk/North-Dorset-Green-Party-announces-candidate/story-25997325-detail/story.html
- ↑ "Election Data 2010". Electoral Calculus. Archived from the original on 17 October 2015. Retrieved 17 October 2015.
- ↑ "Election Data 2005". Electoral Calculus. Archived from the original on 15 October 2011. Retrieved 18 October 2015.
- ↑ "Election Data 2001". Electoral Calculus. Archived from the original on 15 October 2011. Retrieved 18 October 2015.
- ↑ "Election Data 1997". Electoral Calculus. Archived from the original on 15 October 2011. Retrieved 18 October 2015.
- ↑ "Election Data 1992". Electoral Calculus. Archived from the original on 15 October 2011. Retrieved 18 October 2015.
- ↑ "Politics Resources". Election 1992. Politics Resources. 9 April 1992. Retrieved 2010-12-06.
- ↑ "Election Data 1987". Electoral Calculus. Archived from the original on 15 October 2011. Retrieved 18 October 2015.
- ↑ "Election Data 1983". Electoral Calculus. Archived from the original on 15 October 2011. Retrieved 18 October 2015.
- ↑ F W S Craig, British Parliamentary Election Results 1950-1973; Political Reference Publications, Glasgow 1973
- ↑ The Liberal Magazine, 1939
- ↑ Report of the Annual Conference of the Labour Party, 1939
- 1 2 3 4 British parliamentary election results 1818-1949, Craig, F. W. S.
- 1 2 British parliamentary election results 1885-1918
- 1 2 3 British parliamentary election results 1885-1918 by Craig