South East Cornwall (UK Parliament constituency)
Coordinates: 50°24′50″N 4°31′12″W / 50.414°N 4.520°W
| South East Cornwall | |
|---|---|
|
County constituency for the House of Commons | |
|
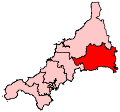
Boundary of South East Cornwall in Cornwall for the 2010 general election. | |
|
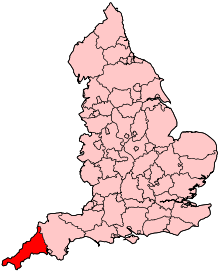
Location of Cornwall within England. | |
| County | Cornwall |
| Electorate | 71,851 (December 2010)[1] |
| Major settlements | Saltash, Torpoint, Liskeard and Looe |
| Current constituency | |
| Created | 1983 |
| Member of parliament | Sheryll Murray (Conservative) |
| Number of members | One |
| Created from | Bodmin, Cornwall North and Truro[2] |
| Overlaps | |
| European Parliament constituency | South West England |

South East Cornwall is a constituency[n 1] represented in the House of Commons of the UK Parliament since 2010 by Sheryll Murray, a Conservative.[n 2]
Boundaries
1983-2010: The District of Caradon, the Borough of Restormel wards of Fowey, Lostwithiel, St Blaise, and Tywardreath, and the District of North Cornwall ward of Stokeclimsland.
2010-present: The District of Caradon, and the Borough of Restormel ward of Lostwithiel.
History
The predecessor county division, Bodmin, serving the area from 1885 until 1983 had (during those 98 years) 15 members (two of whom had broken terms of office serving the area), seeing twelve shifts of preference between the Liberal, Liberal Unionist and Conservative parties, spread quite broadly throughout that period. Consistent with this, since 1983 the preference for an MP has alternated between Liberal Democrats and Conservatives.
The current constituency territory contains the location of several former borough constituencies which were abolished as 'rotten boroughs' by the Great Reform Act, 1832:
Constituency profile
The villages around the South Eastern edges of Cornwall often serve as a commuter base to the town of Plymouth, over the border in Devon.
Workless claimants were in November 2012 significantly lower than the national average of 3.8%, at 2.5% of the population based on a statistical compilation by The Guardian.[3]
Despite the presence of 'South' in its name, this constituency is the second most northern of the six Cornwall seats, and several parts of the seat extend further north than parts of Cornwall North.
Members of Parliament
| Election | Member[4] | Party | |
|---|---|---|---|
| 1983 | Robert Adrian Hicks | Conservative | |
| 1997 | Colin Breed | Liberal Democrat | |
| 2010 | Sheryll Murray | Conservative | |
Elections
Elections in the 2010s
| Party | Candidate | Votes | % | ± | |
|---|---|---|---|---|---|
| Conservative | Sheryll Murray | 25,516 | 50.5 | +5.4 | |
| Liberal Democrat | Phil Hutty | 8,521 | 16.9 | −21.8 | |
| UKIP | Bradley Monk | 7,698 | 15.2 | +9.0 | |
| Labour | Declan Lloyd | 4,692 | 9.3 | +2.2 | |
| Green | Martin Corney | 2,718 | 5.4 | +3.7 | |
| Mebyon Kernow | Andrew Long [6] | 1,003 | 2.0 | +0.7 | |
| Independent | George Trubody | 350 | 0.7 | +0.7 | |
| Majority | 16,995 | 33.7 | +28.2 | ||
| Turnout | 50,498 | 71.1 | +2.4 | ||
| Conservative hold | Swing | +13.6 | |||
| Party | Candidate | Votes | % | ± | |
|---|---|---|---|---|---|
| Conservative | Sheryll Murray | 22,390 | 45.1 | +10.1 | |
| Liberal Democrat | Karen Gillard | 19,170 | 38.6 | −8.1 | |
| Labour | Michael Sparling | 3,507 | 7.1 | −3.4 | |
| UKIP | Stephanie McWilliam | 3,083 | 6.2 | +1.1 | |
| Green | Roger Creagh-Osborne | 826 | 1.7 | +1.7 | |
| Mebyon Kernow | Roger Holmes | 641 | 1.3 | −0.4 | |
| Majority | 3,220 | 6.5 | |||
| Turnout | 49,617 | 68.7 | +1.0 | ||
| Conservative gain from Liberal Democrat | Swing | +9.1 | |||
Elections in the 2000s
| Party | Candidate | Votes | % | ± | |
|---|---|---|---|---|---|
| Liberal Democrat | Colin Breed | 24,986 | 46.7 | +0.8 | |
| Conservative | Ashley Gray | 18,479 | 34.6 | −0.9 | |
| Labour | Colin Binley | 6,069 | 11.4 | −1.0 | |
| UKIP | David Lucas | 2,693 | 5.0 | +1.2 | |
| Mebyon Kernow | Graham Sandercock | 769 | 1.4 | −0.9 | |
| Veritas | Anne Assheton-Salton | 459 | 0.9 | N/A | |
| Majority | 6,507 | 12.2 | |||
| Turnout | 53,455 | 66.2 | 0.8 | ||
| Liberal Democrat hold | Swing | +0.9 | |||
| Party | Candidate | Votes | % | ± | |
|---|---|---|---|---|---|
| Liberal Democrat | Colin Breed | 23,756 | 45.9 | −1.2 | |
| Conservative | Ashley Gray | 18,381 | 35.5 | −0.3 | |
| Labour | William John Stevens | 6,429 | 12.4 | −0.4 | |
| UKIP | Graham Gordon Palmer | 1,978 | 3.8 | +1.3 | |
| Mebyon Kernow | Dr. Kenneth John George | 1,209 | 2.3 | +1.3 | |
| Majority | 5,375 | 10.4 | |||
| Turnout | 51,753 | 65.4 | −10.3 | ||
| Liberal Democrat hold | Swing | −0.5 | |||
Elections in the 1990s
| Party | Candidate | Votes | % | ± | |
|---|---|---|---|---|---|
| Liberal Democrat | Colin Breed | 27,044 | 47.1 | +9.0 | |
| Conservative | Warwick Lightfoot | 20,564 | 35.8 | −15.1 | |
| Labour | Mrs. Dorothy M. Kirk | 7,358 | 12.8 | +3.6 | |
| UKIP | James Alan Wonnacott | 1,428 | 2.5 | N/A | |
| Mebyon Kernow | Paul Andrew Roger Dunbar | 573 | 1.0 | N/A | |
| Liberal | Bill Weights | 268 | 0.5 | −0.6 | |
| Natural Law | Mrs. Margot Kathryn Francis Hartley | 197 | 0.3 | +0.0 | |
| Majority | 6,480 | 11.3 | |||
| Turnout | 57,400 | 75.7 | |||
| Liberal Democrat gain from Conservative | Swing | +12.0 | |||
| Party | Candidate | Votes | % | ± | |
|---|---|---|---|---|---|
| Conservative | Robert Adrian Hicks | 30,565 | 51.0 | −0.6 | |
| Liberal Democrat | Robin Teverson | 22,861 | 38.1 | −1.6 | |
| Labour | Linda Gilroy | 5,536 | 9.2 | +0.6 | |
| Liberal | Miss Maureen Henrietta Cook | 644 | 1.1 | +1.1 | |
| Anti-Federalist League | Anthony Oliver Hebert Quick | 227 | 0.4 | N/A | |
| Natural Law | Miss Rosaleen Allen | 155 | 0.3 | N/A | |
| Majority | 7,704 | 12.8 | +1.0 | ||
| Turnout | 59,988 | 82.1 | +2.6 | ||
| Conservative hold | Swing | +0.5 | |||
Elections in the 1980s
| Party | Candidate | Votes | % | ± | |
|---|---|---|---|---|---|
| Conservative | Robert Adrian Hicks | 28,818 | 51.6 | −3.7 | |
| Liberal | Ian Paul Tunbridge | 22,211 | 39.7 | +0.8 | |
| Labour | Paul Arthur Clark | 4,847 | 8.7 | +3.8 | |
| Majority | 6,607 | 11.9 | |||
| Turnout | 55.876 | 79.5 | +0.9 | ||
| Conservative hold | Swing | −2.3 | |||
| Party | Candidate | Votes | % | ± | |
|---|---|---|---|---|---|
| Conservative | Robert Adrian Hicks | 28,326 | 55.3 | N/A | |
| Liberal | David John Blunt | 19,972 | 38.9 | N/A | |
| Labour | Andrew Joseph Bebb | 2,507 | 4.9 | N/A | |
| Ecology | John Chadwick | 337 | 0.7 | N/A | |
| Independent | Mrs. Joy Elizabeth Dent | 94 | 0.2 | N/A | |
| Majority | 8,354 | 16.3 | N/A | ||
| Turnout | 51,236 | 78.6 | N/A | ||
| Conservative win (new seat) | |||||
See also
Notes and references
- Notes
- ↑ A county constituency (for the purposes of election expenses and type of returning officer)
- ↑ As with all constituencies, the constituency elects one Member of Parliament (MP) by the first past the post system of election at least every five years.
- References
- ↑ "Electorate Figures - Boundary Commission for England". 2011 Electorate Figures. Boundary Commission for England. 4 March 2011. Retrieved 13 March 2011.
- ↑ "'Cornwall South East', June 1983 up to May 1997". ElectionWeb Project. Cognitive Computing Limited. Retrieved 10 March 2016.
- ↑ Unemployment claimants by constituency The Guardian
- ↑ Leigh Rayment's Historical List of MPs – Constituencies beginning with "C" (part 6)
- ↑ "Election Data 2015". Electoral Calculus. Archived from the original on 17 October 2015. Retrieved 17 October 2015.
- ↑ https://www.mebyonkernow.org/news/article.php?id=155
- ↑ "Election Data 2010". Electoral Calculus. Archived from the original on 17 October 2015. Retrieved 17 October 2015.
- ↑ Lavery, Kevin (20 April 2010). "South East Cornwall statement of persons nominated and notice of poll" (MSWord). Acting Returning Officer. Cornwall Council. Retrieved 20 April 2010.
- ↑ "Election Data 2005". Electoral Calculus. Archived from the original on 15 October 2011. Retrieved 18 October 2015.
- ↑ "Election Data 2001". Electoral Calculus. Archived from the original on 15 October 2011. Retrieved 18 October 2015.
- ↑ "Election Data 1997". Electoral Calculus. Archived from the original on 15 October 2011. Retrieved 18 October 2015.
- ↑ "Election Data 1992". Electoral Calculus. Archived from the original on 15 October 2011. Retrieved 18 October 2015.
- ↑ "Politics Resources". Election 1992. Politics Resources. 9 April 1992. Retrieved 2010-12-06.
- ↑ "Election Data 1987". Electoral Calculus. Archived from the original on 15 October 2011. Retrieved 18 October 2015.
- ↑ "Election Data 1983". Electoral Calculus. Archived from the original on 15 October 2011. Retrieved 18 October 2015.