Les Cullayes
| Les Cullayes | ||
|---|---|---|
| Former municipality of Switzerland | ||
| ||
 Les Cullayes | ||
|
Location of Les Cullayes 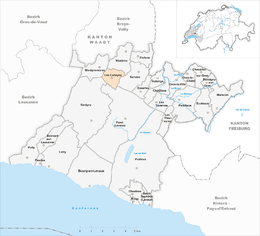 | ||
| Coordinates: 46°34′N 06°45′E / 46.567°N 6.750°ECoordinates: 46°34′N 06°45′E / 46.567°N 6.750°E | ||
| Country | Switzerland | |
| Canton | Vaud | |
| District | Lavaux-Oron | |
| Government | ||
| • Mayor | Bernard Burri | |
| Area | ||
| • Total | 2.12 km2 (0.82 sq mi) | |
| Elevation | 837 m (2,746 ft) | |
| Population (2010) | ||
| • Total | 691 | |
| • Density | 330/km2 (840/sq mi) | |
| Demonym(s) |
Les Cullatis Lè Rondze-Bourri | |
| Postal code | 1080 | |
| SFOS number | 5786 | |
| Surrounded by | Mézières (VD), Servion, Forel (Lavaux), Savigny, Montpreveyres | |
| Website |
www Profile (French), SFSO statistics | |

Les Cullayes is a former municipality in the district of Lavaux-Oron in the canton of Vaud in Switzerland. The municipality of Les Cullayes merged on 1 January 2012 into the municipality of Servion.[1]
History
Les Cullayes is first mentioned in 1359 as Culaes.[2]
Geography
Les Cullayes had an area, as of 2009, of 2.1 square kilometers (0.81 sq mi). Of this area, 1.52 km2 (0.59 sq mi) or 71.7% is used for agricultural purposes, while 0.21 km2 (0.081 sq mi) or 9.9% is forested. Of the rest of the land, 0.36 km2 (0.14 sq mi) or 17.0% is settled (buildings or roads).[3]
Of the built up area, housing and buildings made up 13.2% and transportation infrastructure made up 3.3%. Out of the forested land, 7.1% of the total land area is heavily forested and 2.8% is covered with orchards or small clusters of trees. Of the agricultural land, 40.6% is used for growing crops and 29.7% is pastures, while 1.4% is used for orchards or vine crops.[3]
The municipality was part of the Oron District until it was dissolved on 31 August 2006, and Les Cullayes became part of the new district of Lavaux-Oron.[4]
The former municipality is located in the Jorat region. It consists of the village of Les Cullayes and numerous hamlets.
Coat of arms
The blazon of the municipal coat of arms is Divided by Bend sinister Or, 1: Azure a Deer's Head affrontty Argent; 2: Gules a Rose Or.[5]
Demographics
Les Cullayes had a population (as of 2010) of 691. As of 2008, 13.4% of the population are resident foreign nationals.[6] Over the last 10 years (1999–2009 ) the population has changed at a rate of 10.1%. It has changed at a rate of 14.8% due to migration and at a rate of -4.1% due to births and deaths.[7]
Most of the population (as of 2000) speaks French (557 or 88.7%), with German being second most common (50 or 8.0%) and Portuguese being third (7 or 1.1%). There are 2 people who speak Italian.[8]
The age distribution, as of 2009, in Les Cullayes is; 73 children or 10.4% of the population are between 0 and 9 years old and 96 teenagers or 13.7% are between 10 and 19. Of the adult population, 71 people or 10.2% of the population are between 20 and 29 years old. 82 people or 11.7% are between 30 and 39, 127 people or 18.2% are between 40 and 49, and 108 people or 15.5% are between 50 and 59. The senior population distribution is 87 people or 12.4% of the population are between 60 and 69 years old, 29 people or 4.1% are between 70 and 79, there are 24 people or 3.4% who are between 80 and 89, and there are 2 people or 0.3% who are 90 and older.[9]
As of 2000, there were 269 people who were single and never married in the municipality. There were 291 married individuals, 31 widows or widowers and 37 individuals who are divorced.[8]
As of 2000 the average number of residents per living room was 0.55 which is fewer people per room than the cantonal average of 0.61 per room.[7] In this case, a room is defined as space of a housing unit of at least 4 m² (43 sq ft) as normal bedrooms, dining rooms, living rooms, kitchens and habitable cellars and attics.[10] About 74.3% of the total households were owner occupied, or in other words did not pay rent (though they may have a mortgage or a rent-to-own agreement).[11]
As of 2000, there were 230 private households in the municipality, and an average of 2.6 persons per household.[7] There were 58 households that consist of only one person and 17 households with five or more people. Out of a total of 240 households that answered this question, 24.2% were households made up of just one person and there were 2 adults who lived with their parents. Of the rest of the households, there are 57 married couples without children, 92 married couples with children There were 10 single parents with a child or children. There were 11 households that were made up of unrelated people and 10 households that were made up of some sort of institution or another collective housing.[8]
In 2000 there were 143 single family homes (or 76.9% of the total) out of a total of 186 inhabited buildings. There were 18 multi-family buildings (9.7%), along with 20 multi-purpose buildings that were mostly used for housing (10.8%) and 5 other use buildings (commercial or industrial) that also had some housing (2.7%).[12]
In 2000, a total of 210 apartments (92.5% of the total) were permanently occupied, while 13 apartments (5.7%) were seasonally occupied and 4 apartments (1.8%) were empty.[12] As of 2009, the construction rate of new housing units was 0 new units per 1000 residents.[7] The vacancy rate for the municipality, in 2010, was 1.92%.[7]
The historical population is given in the following chart:[2][13]

Politics
In the 2007 federal election the most popular party was the SVP which received 21.36% of the vote. The next three most popular parties were the Green Party (21%), the SP (18.54%) and the FDP (12.99%). In the federal election, a total of 226 votes were cast, and the voter turnout was 48.2%.[14]
Economy
As of 2010, Les Cullayes had an unemployment rate of 2.1%. As of 2008, there were 4 people employed in the primary economic sector and about 2 businesses involved in this sector. 30 people were employed in the secondary sector and there were 8 businesses in this sector. 74 people were employed in the tertiary sector, with 16 businesses in this sector.[7] There were 329 residents of the municipality who were employed in some capacity, of which females made up 47.7% of the workforce.
In 2008 the total number of full-time equivalent jobs was 79. The number of jobs in the primary sector was 3, all of which were in agriculture. The number of jobs in the secondary sector was 27 of which 4 or (14.8%) were in manufacturing and 23 (85.2%) were in construction. The number of jobs in the tertiary sector was 49. In the tertiary sector; 5 or 10.2% were in the sale or repair of motor vehicles, 3 or 6.1% were in the movement and storage of goods, 8 or 16.3% were in a hotel or restaurant, 1 was in the information industry, 2 or 4.1% were technical professionals or scientists, 4 or 8.2% were in education and 21 or 42.9% were in health care.[15]
In 2000, there were 55 workers who commuted into the municipality and 261 workers who commuted away. The municipality is a net exporter of workers, with about 4.7 workers leaving the municipality for every one entering.[16] Of the working population, 4.9% used public transportation to get to work, and 79.9% used a private car.[7]
Religion
From the 2000 census, 182 or 29.0% were Roman Catholic, while 332 or 52.9% belonged to the Swiss Reformed Church. Of the rest of the population, there were 3 members of an Orthodox church (or about 0.48% of the population), there were 6 individuals (or about 0.96% of the population) who belonged to the Christian Catholic Church, and there were 18 individuals (or about 2.87% of the population) who belonged to another Christian church. There was 1 individual who was Islamic and 1 person who was Buddhist. 80 (or about 12.74% of the population) belonged to no church, are agnostic or atheist, and 14 individuals (or about 2.23% of the population) did not answer the question.[8]
Education
In Les Cullayes about 229 or (36.5%) of the population have completed non-mandatory upper secondary education, and 125 or (19.9%) have completed additional higher education (either University or a Fachhochschule). Of the 125 who completed tertiary schooling, 60.0% were Swiss men, 27.2% were Swiss women, 4.8% were non-Swiss men and 8.0% were non-Swiss women.[8]
In the 2009/2010 school year there were a total of 95 students in the Les Cullayes school district. In the Vaud cantonal school system, two years of non-obligatory pre-school are provided by the political districts.[17] During the school year, the political district provided pre-school care for a total of 665 children of which 232 children (34.9%) received subsidized pre-school care. The canton's primary school program requires students to attend for four years. There were 46 students in the municipal primary school program. The obligatory lower secondary school program lasts for six years and there were 49 students in those schools.[18]
As of 2000, there were 20 students in Les Cullayes who came from another municipality, while 102 residents attended schools outside the municipality.[16]
References
- ↑ Amtliches Gemeindeverzeichnis der Schweiz published by the Swiss Federal Statistical Office (German) accessed 21 December 2011
- 1 2 Les Cullayes in German, French and Italian in the online Historical Dictionary of Switzerland.
- 1 2 Swiss Federal Statistical Office-Land Use Statistics 2009 data (German) accessed 25 March 2010
- ↑ Nomenklaturen – Amtliches Gemeindeverzeichnis der Schweiz (German) accessed 4 April 2011
- ↑ Flags of the World.com accessed 08-August-2011
- ↑ Swiss Federal Statistical Office - Superweb database - Gemeinde Statistics 1981-2008 Archived June 28, 2010, at the Wayback Machine. (German) accessed 19 June 2010
- 1 2 3 4 5 6 7 Swiss Federal Statistical Office Archived November 16, 2011, at the Wayback Machine. accessed 08-August-2011
- 1 2 3 4 5 STAT-TAB Datenwürfel für Thema 40.3 - 2000 Archived August 9, 2013, at the Wayback Machine. (German) accessed 2 February 2011
- ↑ Canton of Vaud Statistical Office (French) accessed 29 April 2011
- ↑ Eurostat. "Housing (SA1)". Urban Audit Glossary (pdf). 2007. p. 18. Retrieved 12 February 2010.
- ↑ Urban Audit Glossary pg 17
- 1 2 Swiss Federal Statistical Office STAT-TAB - Datenwürfel für Thema 09.2 - Gebäude und Wohnungen Archived September 7, 2014, at the Wayback Machine. (German) accessed 28 January 2011
- ↑ Swiss Federal Statistical Office STAT-TAB Bevölkerungsentwicklung nach Region, 1850-2000 Archived September 30, 2014, at the Wayback Machine. (German) accessed 29 January 2011
- ↑ Swiss Federal Statistical Office, Nationalratswahlen 2007: Stärke der Parteien und Wahlbeteiligung, nach Gemeinden/Bezirk/Canton Archived May 14, 2015, at the Wayback Machine. (German) accessed 28 May 2010
- ↑ Swiss Federal Statistical Office STAT-TAB Betriebszählung: Arbeitsstätten nach Gemeinde und NOGA 2008 (Abschnitte), Sektoren 1-3 Archived December 25, 2014, at the Wayback Machine. (German) accessed 28 January 2011
- 1 2 Swiss Federal Statistical Office - Statweb (German) accessed 24 June 2010
- ↑ Organigramme de l'école vaudoise, année scolaire 2009-2010 (French) accessed 2 May 2011
- ↑ Canton of Vaud Statistical Office - Scol. obligatoire/filières de transition (French) accessed 2 May 2011
| Wikimedia Commons has media related to Les Cullayes. |