Demographics of Ontario
Population of Ontario : 12,851,821 (2011 census)
Percentage of National Population : 38.4%
Population growth rate per year: 1.0%
Source: Statistics Canada[1]
Vital statistics
Birth Rate: 10.8/1,000 people [2]
Death Rate: 7.1/1,000 people [3]
Life Expectancy at birth: 81 years (2006 est) [4]
Infant Mortality rate: 5.2 (2007 est) [5]
Source: Statistics Canada
Historic populations since 1851
| Year | Population | 5 year % change |
10 year % change |
% Canadian population |
Urban Population | Rural Population | % Urban |
% Rural |
|---|---|---|---|---|---|---|---|---|
| 1851 | 952,004 | - | - | 39.0% | 133,463 | 818,541 | 14.0% | 86.0% |
| 1861 | 1,396,091 | - | 46.6% | 43.2% | 258,192 | 1,137,899 | 18.5% | 81.5% |
| 1871 | 1,620,851 | - | 16.1% | 43.9% | 355,997 | 1,264,854 | 22.0% | 78.0% |
| 1881 | 1,926,922 | - | 18.8% | 45.4% | 575,848 | 1,351,074 | 29.9% | 70.1% |
| 1891 | 2,114,321 | - | 9.7% | 48.9% | 818,998 | 1,295,323 | 38.7% | 61.3% |
| 1901 | 2,182,947 | - | 3.2% | 40.6% | 935,978 | 1,246,969 | 42.9% | 57.1% |
| 1911 | 2,527,292 | - | 15.8% | 35.1% | 1,328,489 | 1,198,803 | 52.6% | 47.4% |
| 1921 | 2,933,662 | - | 16.1% | 33.4% | 1,706,632 | 1,227,030 | 58.2% | 41.8% |
| 1931 | 3,431,683 | - | 17.0% | 33.1% | 2,095,992 | 1,335,691 | 61.1% | 38.9% |
| 1941 | 3,787,655 | - | 10.4% | 32.9% | 2,338,633 | 1,449,022 | 61.7% | 38.3% |
| 1951 | 4,597,542 | - | 21.3% | 32.8% | 3,251,099 | 1,346,443 | 70.7% | 29.3% |
| 1956 | 5,404,933 | 17.6% | - | 33.6% | 4,102,919 | 1,302,014 | 75.9% | 24.1% |
| 1961 | 6,236,092 | 15.4% | 35.6% | 34.2% | 4,823,529 | 1,412,563 | 77.3% | 22.7% |
| 1966 | 6,960,870 | 11.6% | 28.8% | 34.9% | 5,593,440 | 1,367,430 | 80.4% | 19.6% |
| 1971 | 7,703,105 | 10.7% | 23.5% | 35.7% | 6,343,630 | 1,359,480 | 82.4% | 17.6% |
| 1976 | 8,264,465 | 7.3% | 18.7% | 35.9% | 6,708,520 | 1,555,945 | 81.2% | 18.8% |
| 1981 | 8,625,107 | 4.4% | 12.0% | 35.4% | 7,047,032 | 1,578,075 | 81.7% | 18.3% |
| 1986 | 9,101,695 | 5.5% | 10.1% | 36.0% | 7,469,420 | 1,632,275 | 82.1 | 17.9% |
| 1991 | 10,084,885 | 10.8% | 16.9% | 36.9% | 8,253,842 | 1,831,043 | 81.9% | 18.1% |
| 1996 | 10,753,573 | 10.7% | 18.2% | 37.3% | 8,958,741 | 1,794,832 | 83.3% | 16.7% |
| 2001 | 11,410,046 | 6.1% | 13.2% | 38.0% | 9,662,547 | 1,747,499 | 84.7% | 15.3% |
| 2006 | 12,160,282 | 6.6% | 13.1% | 38.4% | 10,351,135 | 1,809,147 | 85.1% | 14.9% |
| 2011 | 12,851,821 | 5.7% | 12.6% | 38.4% | 11,045,786 | 1,806,036 | 86.0% | 14.0% |
Source: Statistics Canada [6]
Age structure
| Age Groups | Total | Male | Female |
|---|---|---|---|
| 0–4 years | 671,250 | 343,340 | 327,910 |
| 5–9 years | 772,650 | 396,385 | 376,265 |
| 10–14 years | 788,845 | 404,970 | 383,880 |
| 15–24 years | 1,487,835 | 754,565 | 733,270 |
| 25–34 years | 1,558,495 | 760,695 | 797,800 |
| 35–44 years | 1,959,520 | 963,840 | 995,680 |
| 45–54 years | 1,635,280 | 801,540 | 833,735 |
| 55–64 years | 1,064,000 | 520,570 | 543,430 |
| 65–74 years | 818,170 | 383,625 | 434,540 |
| 75–84 years | 503,930 | 202,270 | 301,665 |
| 85 years and over | 150,075 | 45,260 | 104,810 |
| Total | 11,410,045 | 5,577,055 | 5,832,990 |
Source : Statistics Canada [7] 2001
Visible minorities and Aboriginals
| Visible minority and Aboriginal population (Canada 2011 Census) | |||
|---|---|---|---|
| Population group | Population | % of total population | |
| White | 9,070,800 | 71.7% | |
| Visible minority group Source:[8] | South Asian | 965,990 | 7.6% |
| Chinese | 629,140 | 5% | |
| Black | 539,205 | 4.3% | |
| Filipino | 275,380 | 2.2% | |
| Latin American | 172,560 | 1.4% | |
| Arab | 151,645 | 1.1% | |
| Southeast Asian | 137,875 | 1.1% | |
| West Asian | 122,530 | 1% | |
| Korean | 78,290 | 0.6% | |
| Japanese | 29,085 | 0.2% | |
| Visible minority, n.i.e. | 81,130 | 0.6% | |
| Multiple visible minority | 96,735 | 0.8% | |
| Total visible minority population | 3,279,565 | 25.9% | |
| Aboriginal group Source:[8] | First Nations | 201,100 | 1.6% |
| Métis | 86,020 | 0.7% | |
| Inuit | 3,555 | 0% | |
| Aboriginal, n.i.e. | 8,040 | 0.1% | |
| Multiple Aboriginal identity | 2,910 | 0% | |
| Total Aboriginal population | 301,430 | 2.4% | |
| Total population | 12,651,795 | 100% | |
Ethnic groups
| Ethnic group | Responses | % |
|---|---|---|
| Total population | 12,028,895 | 100 |
| English | 2,971,360 | 24.7 |
| Canadian | 2,768,870 | 23.0 |
| Scottish | 2,101,100 | 17.5 |
| Irish | 1,988,940 | 16.5 |
| French | 1,351,600 | 11.2 |
| German | 1,144,560 | 9.5 |
| Italian | 867,980 | 7.2 |
| Chinese | 644,465 | 5.4 |
| East Indian | 573,250 | 4.8 |
| Dutch (Netherlands) | 490,995 | 4.1 |
| Polish | 465,560 | 3.9 |
| Ukrainian | 336,355 | 2.8 |
| North American Indian | 317,890 | 2.6 |
| Portuguese | 282,870 | 2.4 |
| Filipino | 215,750 | 1.8 |
| British, not included elsewhere | 205,755 | 1.7 |
| Jamaican | 197,540 | 1.6 |
| Welsh | 182,825 | 1.5 |
| Jewish | 177,255 | 1.5 |
| Russian | 167,365 | 1.4 |
| Hungarian (Magyar) | 151,750 | 1.3 |
| Spanish | 149,160 | 1.2 |
| Greek | 132,440 | 1.1 |
| American (USA) | 113,050 | 0.9 |
| Pakistani | 91,160 | 0.8 |
| Métis | 87,090 | 0.7 |
| Sri Lankan | 85,935 | 0.7 |
| Vietnamese | 83,330 | 0.7 |
| Romanian | 80,710 | 0.7 |
| African, not included elsewhere | 75,500 | 0.6 |
| Finnish | 72,990 | 0.6 |
| Korean | 72,065 | 0.6 |
| Croatian | 71,380 | 0.6 |
| Iranian | 70,590 | 0.6 |
Note: The graph takes dual responses (for example if someone is French-Canadian he/she would be added to both French and Canadian) thus the graph does not add up to 100%. Some places of ones ethnic origin do refer to a single specified country of origin, i.e. Spanish refers to people from Spanish speaking countries such as Colombia, Argentina, Cuba and others; or East Indian where the respondents origin could be from Pakistan, India, Nepal, Bangladesh, etc.; and the list contains about 200 nationalities known to reside in the province. However, there are options for the respondent to identify the country alone.
Ontario is a very diverse province. For example, 42.8% of the population of Toronto was born outside Canada,[9] which is the second-largest percentage of immigrants in a single city on Earth, after Miami. Hamilton is ranked the third-most diverse urbanized area in Canada (after Toronto and Vancouver).
Mother tongue
| Mother tongue | Responses | % |
|---|---|---|
| Total population | 12,722,065 | 100 |
| English | 8,950,685 | 70.4 |
| French | 561,160 | 4.4 |
| Italian | 270,445 | 2.1 |
| Chinese, not otherwise specified | 202,225 | 1.6 |
| Cantonese | 195,060 | 1.5 |
| Spanish | 190,410 | 1.5 |
| Panjabi (Punjabi) | 187,145 | 1.5 |
| Tagalog (Pilipino, Filipino) | 165,105 | 1.3 |
| Portuguese | 157,640 | 1.2 |
| Arabic | 148,735 | 1.2 |
| German | 147,040 | 1.2 |
| Urdu | 144,930 | 1.1 |
| Polish | 134,595 | 1.1 |
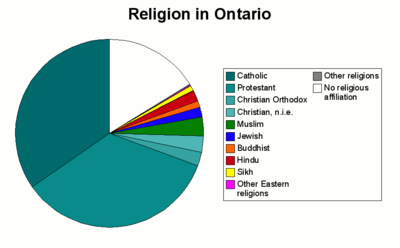
Religious groups
| Canadian Christian bodies |
|---|
|
Other
|
| Religion | People | % |
|---|---|---|
| Total | 12,651,795 | 100 |
| Christian | 8,167,295 | 64.6 |
| No Religious Affiliation | 2,927,790 | 23.1 |
| Muslim | 581,950 | 4.6 |
| Hindu | 366,720 | 2.9 |
| Jewish | 195,540 | 1.5 |
| Sikh | 179,765 | 1.4 |
| Buddhist | 163,750 | 1.3 |
| Traditional Aboriginal (Spirituality) | 15,905 | 0.1 |
| Other Religions | 53,080 | 0.4 |
- Of Christian faith: Catholic at 3,976,610 (31.4%); United Church 952,465 (7.5%); Anglican 774,560 (6.1%); Presbyterian 319,585 (2.5%); Christian Orthodox 297,710 (2.4%); Baptist 244,650 (1.9%); Pentecostal 213,945 (1.7%); Lutheran 163,460 (1.3%); Other Christian 1,224,300 (9.7%)
Source: Statistics Canada [10] StatsCan 2011 National Household Survey[8]
Census Metropolitan Areas
| City | 2011 [11] | 2006 [12] | 2001 [13] | 1996 [14] | 1991 [14] |
|---|---|---|---|---|---|
| Toronto | 5,583,064 | 5,113,149 | 4,682,897 | 4,263,757 | 3,898,933 |
| Ottawa-Gatineau | 1,236,324 | 1,130,761 | 1,063,664 | 1,010,498 | 941,814 |
| Hamilton | 721,053 | 692,911 | 662,401 | 624,360 | 599,760 |
| Kitchener-Cambridge-Waterloo | 477,160 | 451,235 | 414,284 | 382,940 | 356,421 |
| London | 474,786 | 457,720 | 432,451 | 398,616 | 381,522 |
| St. Catharines-Niagara | 392,184 | 390,317 | 377,009 | 372,406 | 364,552 |
| Oshawa | 356,177 | 330,594 | 296,298 | 268,773 | 240,104 |
| Windsor | 319,246 | 323,342 | 307,877 | 278,685 | 262,075 |
| Barrie | 187,013 | 177,061 | 148,480 | 118,695 | 97,150 |
| Greater Sudbury | 160,770 | 158,258 | 155,601 | 160,488 | 157,613 |
| Kingston | 159,561 | 152,358 | 146,838 | 143,416 | 136,401 |
| Guelph | 141,097 | 127,009 | 117,344 | 105,420 | 97,667 |
| Brantford | 135,501 | 124,607 | 86,417 | 100,238 | 97,106 |
| Thunder Bay | 121,596 | 122,907 | 121,986 | 125,562 | 124,925 |
| Peterborough | 118,975 | 116,570 | 102,423 | 100,193 | 98,060 |
Municipalities
| City | 2011 [15] | 2006 [16] | 2001 [17] | 1996 [18] | 1991 [18] |
|---|---|---|---|---|---|
| Toronto | 2,615,060 | 2,503,281 | 2,481,494 | 2,385,421 | 2,275,771 |
| Ottawa | 883,391 | 812,129 | 774,072 | 721,136 | 678,147 |
| Mississauga | 713,443 | 668,549 | 612,925 | 544,382 | 463,388 |
| Brampton | 523,911 | 433,806 | 325,428 | 268,251 | 234,445 |
| Hamilton | 519,949 | 504,559 | 490,268 | 467,799 | 451,665 |
| London | 366,151 | 352,395 | 336,539 | 325,646 | 311,620 |
| Markham | 301,709 | 261,573 | 208,615 | 173,383 | 153,811 |
| Vaughan | 288,301 | 238,866 | 182,022 | 132,549 | 111,359 |
| Kitchener | 219,153 | 204,668 | 190,399 | 178,420 | 168,282 |
| Windsor | 210,891 | 216,473 | 208,402 | 197,694 | 191,435 |
| Richmond Hill | 185,541 | 162,704 | 132,030 | 101,725 | 80,142 |
| Oakville | 182,520 | 165,613 | 144,738 | 128,405 | 114,670 |
| Burlington | 175,779 | 164,415 | 150,836 | 136,976 | 129,575 |
| Greater Sudbury | 160,274 | 157,857 | 155,219 | 164,049 | 161,210 |
| Oshawa | 149,607 | 141,590 | 139,051 | 134,364 | 129,344 |
See also

References
- ↑
- ↑ Birth rates of Canada and its provinces and territories
- ↑ Death rates of Canada and its provinces and territories
- ↑ Life expectancy of Canada and its provinces
- ↑ Infant mortality information of Canada and its provinces and territories
- ↑ Rural and Urban population changes since 1851 for Ontario
- ↑ Statistics profile for Ontario
- 1 2 3 http://www12.statcan.gc.ca/nhs-enm/2011/dp-pd/prof/details/Page.cfm?Lang=E&Geo1=PR&Code1=35&Data=Count&SearchText=Ontario&SearchType=Begins&SearchPR=01&A1=All&B1=All&GeoLevel=PR&GeoCode=35
- ↑ Visible minorities of Toronto.
- ↑
- ↑
- ↑
- ↑
- 1 2
- ↑
- ↑
- ↑
- 1 2
| Provinces | |
|---|---|
| Territories | |
| |
| Ethnic ancestry |
| ||||||||||||||||||||||||||||||||||||||||||||||||||||||||||||||||||||||||
|---|---|---|---|---|---|---|---|---|---|---|---|---|---|---|---|---|---|---|---|---|---|---|---|---|---|---|---|---|---|---|---|---|---|---|---|---|---|---|---|---|---|---|---|---|---|---|---|---|---|---|---|---|---|---|---|---|---|---|---|---|---|---|---|---|---|---|---|---|---|---|---|---|---|
| Demographics | |||||||||||||||||||||||||||||||||||||||||||||||||||||||||||||||||||||||||
| Culture & society | |||||||||||||||||||||||||||||||||||||||||||||||||||||||||||||||||||||||||
| List of Canadians |
| ||||||||||||||||||||||||||||||||||||||||||||||||||||||||||||||||||||||||
| |||||||||||||||||||||||||||||||||||||||||||||||||||||||||||||||||||||||||