Bolsover (UK Parliament constituency)
| Bolsover | |
|---|---|
|
County constituency for the House of Commons | |
|
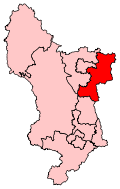
Boundary of Bolsover in Derbyshire for the 2010 general election. | |
|
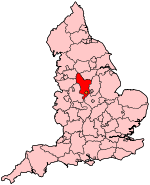
Location of Derbyshire within England. | |
| County | Derbyshire |
| Population | 94,473 (2011 census)[1] |
| Electorate | 72,162 (December 2010)[2] |
| Major settlements | Bolsover, Shirebrook |
| Current constituency | |
| Created | 1950 |
| Member of parliament | Dennis Skinner (Labour) |
| Number of members | One |
| Created from | Clay Cross and North East Derbyshire |
| Overlaps | |
| European Parliament constituency | East Midlands |
Bolsover /ˈbɒlsˌɒvər/, /ˈbɒlzˌɒvər/ and commonly /boʊzər/ is a constituency in Derbyshire represented in the House of Commons of the U.K. Parliament. The constituency was first contested in 1950 and is focused on the town of Bolsover.
History
Before the Reform Act 1832 relatively wealthy (forty shilling freeholders) of the whole county could attend elections when there was an opposition candidate. From 1868 until 1885 East Derbyshire served the area by gaining the area from North Derbyshire formed in 1832. The constituency was created in 1950 from parts of the constituencies of 1885-formed North East Derbyshire and 1918-formed Clay Cross.
Boundaries

1950-1983: The Urban District of Bolsover, and the Rural Districts of Blackwell and Clowne.
1983-2010: The District of Bolsover, and the District of North East Derbyshire wards of Morton, Pilsley, Shirland, and Sutton.
2010–present: The District of Bolsover, and the District of North East Derbyshire wards of Holmewood and Heath, Pilsley and Morton, Shirland, and Sutton.
Constituency profile
The seat includes many former mining communities and has in elections to date been a Labour Party stronghold although Skinner's share of the popular vote has "dropped" to a bare (50%) plurality in the 2010 election (from a high of 74%) - see below. Its economy has faced struggles following the last closures in the early 1990s of the coal pits upon which the area thrived for many years, facing from the 1970s increased competition to compete with international prices and a need for government subsidy as achieved in Eastern Europe, albeit on lower wages, which ceased under Margaret Thatcher. Bolsover's tourism industry has emerged in the area in recent years, including accommodation and tours involving Bolsover Castle, owned by English Heritage, and Hardwick Hall, home of Bess of Hardwick. Since 1970 it has been held by Dennis Skinner, a former miner whose fast wit and often abrasive manner in the House of Commons has led to him being dubbed "The Beast of Bolsover".
Members of Parliament
| Election | Member[3] | Party | |
|---|---|---|---|
| 1950 | Harold Neal[4] | Labour | |
| 1970 | Dennis Skinner[5] | Labour | |
Elections
Elections in the 2010s
| Party | Candidate | Votes | % | ± | |
|---|---|---|---|---|---|
| Labour | Dennis Skinner | 22,542 | 51.2 | +1.2 | |
| Conservative | Peter Bedford | 10,764 | 24.5 | -0.1 | |
| UKIP | Ray Calladine | 9,228 | 21.0 | +17.1 | |
| Liberal Democrat | David Lomax | 1,464 | 3.3 | -12.2 | |
| Majority | 11,778 | 26.8 | |||
| Turnout | 43,998 | 61.1 | |||
| Labour hold | Swing | 0.7 | |||
| Party | Candidate | Votes | % | ± | |
|---|---|---|---|---|---|
| Labour | Dennis Skinner | 21,994 | 50.0 | −15.2 | |
| Conservative | Lee Rowley | 10,812 | 24.6 | +7.3 | |
| Liberal Democrat | Denise Hawksworth | 6,821 | 15.5 | −2.0 | |
| BNP | Martin Radford | 2,640 | 6.0 | +6.0 | |
| UKIP | Ray Calladine | 1,721 | 3.9 | +3.9 | |
| Majority | 11,182 | 25.4 | |||
| Turnout | 43,988 | 60.5 | +4.3 | ||
| Labour hold | Swing | −11.3 | |||
Elections in the 2000s
| Party | Candidate | Votes | % | ± | |
|---|---|---|---|---|---|
| Labour | Dennis Skinner | 25,217 | 65.2 | −3.4 | |
| Liberal Democrat | Denise Hawksworth | 6,780 | 17.5 | +5.6 | |
| Conservative | Hasan Imam | 6,702 | 17.3 | −2.2 | |
| Majority | 18,437 | 47.6 | |||
| Turnout | 38,699 | 57.3 | −2.2 | ||
| Labour hold | Swing | −4.5 | |||
| Party | Candidate | Votes | % | ± | |
|---|---|---|---|---|---|
| Labour | Dennis Skinner | 26,249 | 68.6 | −5.4 | |
| Conservative | Simon Massey | 7,472 | 19.5 | +2.8 | |
| Liberal Democrat | Marie Bradley | 4,550 | 11.9 | +2.6 | |
| Majority | 18,777 | 49.1 | |||
| Turnout | 38,271 | 56.5 | −14.7 | ||
| Labour hold | Swing | ||||
Elections in the 1990s
| Party | Candidate | Votes | % | ± | |
|---|---|---|---|---|---|
| Labour | Dennis Skinner | 35,073 | 74.0 | +9.5 | |
| Conservative | Richard Harwood | 7,924 | 16.7 | −8.6 | |
| Liberal Democrat | Ian Cox | 4,417 | 9.3 | −0.9 | |
| Majority | 27,149 | 57.3 | +18.1 | ||
| Turnout | 47,414 | 71.3 | |||
| Labour hold | Swing | +9.1 | |||
| Party | Candidate | Votes | % | ± | |
|---|---|---|---|---|---|
| Labour | Dennis Skinner | 33,978 | 64.5 | +8.3 | |
| Conservative | Timothy D.R. James | 13,323 | 25.3 | −3.0 | |
| Liberal Democrat | Mrs Susan P. Barber | 5,368 | 10.2 | −5.3 | |
| Majority | 20,655 | 39.2 | +11.3 | ||
| Turnout | 52,669 | 79.1 | +1.8 | ||
| Labour hold | Swing | +5.7 | |||
Elections in the 1980s
| Party | Candidate | Votes | % | ± | |
|---|---|---|---|---|---|
| Labour | Dennis Skinner | 28,453 | 56.21 | ||
| Conservative | M.R. Lingens | 14,333 | 28.31 | ||
| Social Democratic | M.H. Fowler | 7,836 | 15.48 | ||
| Majority | 14,120 | 27.89 | |||
| Turnout | 77.34 | ||||
| Labour hold | Swing | ||||
| Party | Candidate | Votes | % | ± | |
|---|---|---|---|---|---|
| Labour | Dennis Skinner | 26,514 | 56.33 | ||
| Conservative | S. Roberts | 12,666 | 26.91 | ||
| Social Democratic | S. Reddish | 7,886 | 16.76 | ||
| Majority | 13,848 | 29.42 | |||
| Turnout | 72.67 | ||||
| Labour hold | Swing | ||||
Elections in the 1970s
| Party | Candidate | Votes | % | ± | |
|---|---|---|---|---|---|
| Labour | Dennis Skinner | 27,495 | 66.58 | ||
| Conservative | Anthony Favell | 10,116 | 24.49 | ||
| Liberal | James Ian Frost | 3,688 | 8.93 | ||
| Majority | 17,379 | 42.08 | |||
| Turnout | 78.31 | ||||
| Labour hold | Swing | ||||
| Party | Candidate | Votes | % | ± | |
|---|---|---|---|---|---|
| Labour | Dennis Skinner | 27,275 | 70.55 | ||
| Conservative | C.L. Sternberg | 6,209 | 16.06 | ||
| Liberal | M. Taylor | 5,176 | 13.39 | ||
| Majority | 21,066 | 54.49 | |||
| Turnout | 74.52 | ||||
| Labour hold | Swing | ||||
| Party | Candidate | Votes | % | ± | |
|---|---|---|---|---|---|
| Labour | Dennis Skinner | 30,787 | 76.47 | ||
| Conservative | A.R. Dix | 9,474 | 23.53 | ||
| Majority | 21,313 | 52.94 | |||
| Turnout | 78.38 | ||||
| Labour hold | Swing | ||||
| Party | Candidate | Votes | % | ± | |
|---|---|---|---|---|---|
| Labour | Dennis Skinner | 28,830 | 77.50 | ||
| Conservative | I.J. Humphrey | 8,371 | 22.50 | ||
| Majority | 20,459 | 55.00 | |||
| Turnout | 70.76 | ||||
| Labour hold | Swing | ||||
Elections in the 1960s
| Party | Candidate | Votes | % | ± | |
|---|---|---|---|---|---|
| Labour | Harold Neal | 30,114 | 81.55 | ||
| Conservative | P.C. Coleman | 6,815 | 18.45 | ||
| Majority | 23,299 | 63.09 | |||
| Turnout | 74.62 | ||||
| Labour hold | Swing | ||||
| Party | Candidate | Votes | % | ± | |
|---|---|---|---|---|---|
| Labour | Harold Neal | 31,234 | 79.34 | ||
| Conservative | Patrick Cormack | 8,131 | 20.66 | ||
| Majority | 23,103 | 58.69 | |||
| Turnout | 78.89 | ||||
| Labour hold | Swing | ||||
Elections in the 1950s
| Party | Candidate | Votes | % | ± | |
|---|---|---|---|---|---|
| Labour | Harold Neal | 32,536 | 78.19 | ||
| Conservative | Robin Marlar | 9,076 | 21.81 | ||
| Majority | 23,460 | 56.38 | |||
| Turnout | 82.47 | ||||
| Labour hold | Swing | ||||
| Party | Candidate | Votes | % | ± | |
|---|---|---|---|---|---|
| Labour | Harold Neal | 30,074 | 78.87 | ||
| Conservative | B.R.O. Bell | 8,055 | 21.13 | ||
| Majority | 22,019 | 57.75 | |||
| Turnout | 77.57 | ||||
| Labour hold | Swing | ||||
| Party | Candidate | Votes | % | ± | |
|---|---|---|---|---|---|
| Labour | Harold Neal | 33,661 | 79.89 | ||
| Conservative | J.K. Cordeaux | 8,472 | 20.11 | ||
| Majority | 25,189 | 59.78 | |||
| Turnout | 85.36 | ||||
| Labour hold | Swing | ||||
| Party | Candidate | Votes | % | ± | |
|---|---|---|---|---|---|
| Labour | Harold Neal | 34,017 | 80.61 | ||
| Conservative | J.K. Cordeaux | 8,184 | 19.39 | ||
| Majority | 25,833 | 61.21 | |||
| Turnout | 86.24 | ||||
| Labour hold | Swing | ||||
See also
Notes and references
- Notes
- References
- ↑ "Bolsover: Usual Resident Population, 2011". Neighbourhood Statistics. Office for National Statistics. Retrieved 31 January 2015.
- ↑ "Electorate Figures - Boundary Commission for England". 2011 Electorate Figures. Boundary Commission for England. 4 March 2011. Archived from the original on 6 November 2010. Retrieved 13 March 2011.
- ↑ Leigh Rayment's Historical List of MPs – Constituencies beginning with "B" (part 4)
- ↑ "MPs, as on 23 February 1950". They Work For You. Retrieved 28 July 2014.
- ↑ "MPs, as on 18 June 1970". They Work For You. Retrieved 28 July 2014.
- ↑ "Election Data 2015". Electoral Calculus. Archived from the original on 17 October 2015. Retrieved 17 October 2015.
- ↑ "Election Data 2010". Electoral Calculus. Archived from the original on 17 October 2015. Retrieved 17 October 2015.
- ↑ "Election Data 2005". Electoral Calculus. Archived from the original on 15 October 2011. Retrieved 18 October 2015.
- ↑ "Election Data 2001". Electoral Calculus. Archived from the original on 15 October 2011. Retrieved 18 October 2015.
- ↑ "Election Data 1997". Electoral Calculus. Archived from the original on 15 October 2011. Retrieved 18 October 2015.
- ↑ "Politics Resources". Election 1997. Politics Resources. 1 May 1997. Retrieved 2011-01-10.
- ↑ C. Rallings & M. Thrasher, The Media Guide to the New Parliamentary Constituencies, p.36 (Plymouth: LGC Elections Centre, 1995)
- ↑ The 1997 election result is calculated relative to the notional, not the actual, 1992 result.
- ↑ "Election Data 1992". Electoral Calculus. Archived from the original on 15 October 2011. Retrieved 18 October 2015.
- ↑ "Politics Resources". Election 1992. Politics Resources. 9 April 1992. Retrieved 2010-12-06.
- ↑ "Election Data 1987". Electoral Calculus. Archived from the original on 15 October 2011. Retrieved 18 October 2015.
- ↑ "Election Data 1983". Electoral Calculus. Archived from the original on 15 October 2011. Retrieved 18 October 2015.
External links
- nomis Constituency Profile for Bolsover — presenting data from the ONS annual population survey and other official statistics.
Coordinates: 53°14′N 1°18′W / 53.23°N 1.30°W