North East Derbyshire (UK Parliament constituency)
| North East Derbyshire | |
|---|---|
|
County constituency for the House of Commons | |
|
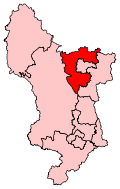
Boundary of North East Derbyshire in Derbyshire for the 2010 general election. | |
|
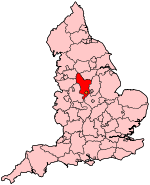
Location of Derbyshire within England. | |
| County | Derbyshire |
| Electorate | 72,374 (December 2010) |
| Major settlements | Clay Cross, Dronfield, Killamarsh, Staveley |
| Current constituency | |
| Created | 1885 |
| Member of parliament | Natascha Engel (Labour) |
| Number of members | One |
| Created from | East Derbyshire |
| Overlaps | |
| European Parliament constituency | East Midlands |
North East Derbyshire is a constituency[n 1] represented in the House of Commons of the UK Parliament since 2005 by Natascha Engel of the Labour Party.[n 2]
History
This constituency was created in the Redistribution of Seats Act 1885. Until 1910 it was a regularly represented by the Liberal party but since 1935 has remained a Labour safe seat, one of those longest continuously held by that party. In 2010 it became, unusually, a marginal seat. In the past mining and associated industries were an important source of employment, though the former ceased around 1970. At about the same time, some ex-mining towns like Dronfield saw much middle class commuter house building in areas like Dronfield Woodhouse; jobs were typically in Sheffield and Chesterfield.
Boundaries

1885-1918: The Sessional Division of Eckington, and part of the Sessional Divisions of Chesterfield.
1918-1950: The Urban Districts of Bolsover and Dronfield, the Rural Districts of Clowne and Norton, and part of the Rural District of Chesterfield.
1950-1983: The Urban Districts of Clay Cross and Dronfield, and part of the Rural District of Chesterfield.
1983-2010: The District of North East Derbyshire wards of Ashover, Barlow and Holmesfield, Brampton and Walton, Clay Cross North, Clay Cross South, Coal Aston, Dronfield North, Dronfield South, Dronfield Woodhouse, Eckington North, Eckington South, Gosforth Valley, Hasland, Holmewood and Heath, Killamarsh East, Killamarsh West, North Wingfield Central, Renishaw, Ridgeway and Marsh Lane, Tupton, Unstone, and Wingerworth, and the Borough of Chesterfield wards of Barrow Hill and Hollingwood, and Lowgates and Woodthorpe.
2010–present: The District of North East Derbyshire wards of Ashover, Barlow and Holmesfield, Brampton and Walton, Clay Cross North, Clay Cross South, Coal Aston, Dronfield North, Dronfield South, Dronfield Woodhouse, Eckington North, Eckington South, Gosforth Valley, Grassmoor, Killamarsh East, Killamarsh West, North Wingfield Central, Renishaw, Ridgeway and Marsh Lane, Tupton, Unstone, and Wingerworth, and the Borough of Chesterfield wards of Barrow Hill and New Whittington, and Lowgates and Woodthorpe.
The North East Derbyshire constituency covers the north eastern part of Derbyshire, surrounding Chesterfield on three sides. It covers most of the area of North East Derbyshire District Council.
Members of Parliament
| Election | Member[1] | Party | Notes | |
|---|---|---|---|---|
| 1885 | Francis Egerton | Liberal | ||
| 1886 | Thomas Bolton | Liberal | Died 1906 | |
| 1907 by-election | William Harvey | Liberal | ||
| Jan 1910 | Labour | Died 1914 | ||
| 1914 by-election | George Bowden | Unionist | ||
| 1918 | Stanley Holmes | Liberal | ||
| 1922 | Frank Lee | Labour | ||
| 1931 | Jardine Whyte | Conservative | ||
| 1935 | Frank Lee | Labour | ||
| 1942 by-election | Henry White | Labour | ||
| 1959 | Tom Swain | Labour | Died March 1979; no by-election held due to imminent general election | |
| 1979 | Ray Ellis | Labour | ||
| 1987 | Harry Barnes | Labour | ||
| 2005 | Natascha Engel | Labour | Second Deputy Chairman of Ways and Means 2015–present | |
Elections
Elections in the 2010s
| Party | Candidate | Votes | % | ± | |
|---|---|---|---|---|---|
| Labour | Natascha Engel[4] | 19,488 | 40.6 | +2.4 | |
| Conservative | Lee Rowley[4] | 17,605 | 36.7 | +3.7 | |
| UKIP | James Bush[5] | 7,631 | 15.9 | +10.3 | |
| Liberal Democrat | David Batey[6] | 2,004 | 4.2 | -19.1 | |
| Green | David Kesteven[7] | 1,059 | 2.2 | N/A | |
| Independent | Rob Lane | 161 | 0.3 | N/A | |
| Majority | 1,883 | 3.9 | -1.3 | ||
| Turnout | 47,948 | 67.1 | +1.2 | ||
| Labour hold | Swing | -0.6 | |||
| Party | Candidate | Votes | % | ± | |
|---|---|---|---|---|---|
| Labour | Natascha Engel | 17,948 | 38.2 | -10.1 | |
| Conservative | Huw Merriman | 15,503 | 33.0 | +7.0 | |
| Liberal Democrat | Richard Bull | 10,947 | 23.3 | +1.8 | |
| UKIP | James Bush | 2,636 | 5.6 | +1.2 | |
| Majority | 2,445 | 5.2 | -18.0 | ||
| Turnout | 47,034 | 65.9 | +4.7 | ||
| Labour hold | Swing | -8.6 | |||
Elections in the 2000s
| Party | Candidate | Votes | % | ± | |
|---|---|---|---|---|---|
| Labour | Natascha Engel | 21,416 | 49.3 | −6.3 | |
| Conservative | Dominic Johnson | 11,351 | 26.1 | −0.4 | |
| Liberal Democrat | Tom Snowdon | 8,812 | 20.3 | +2.5 | |
| UKIP | Kenneth Perkins | 1,855 | 4.3 | N/A | |
| Majority | 10,065 | 23.2 | -5.9 | ||
| Turnout | 43,434 | 61.2 | +2.3 | ||
| Labour hold | Swing | -3.0 | |||
| Party | Candidate | Votes | % | ± | |
|---|---|---|---|---|---|
| Labour | Harry Barnes | 23,437 | 55.6 | −4.9 | |
| Conservative | James Hollingsworth | 11,179 | 26.5 | +1.3 | |
| Liberal Democrat | Mark Higginbottom | 7,508 | 17.8 | +3.5 | |
| Majority | 12,258 | 29.1 | -6.2 | ||
| Turnout | 42,124 | 58.9 | −13.6 | ||
| Labour hold | Swing | -3.1 | |||
Elections in the 1990s
| Party | Candidate | Votes | % | ± | |
|---|---|---|---|---|---|
| Labour | Harry Barnes | 31,425 | 60.5 | +11.7 | |
| Conservative | Simon Elliott | 13,104 | 25.2 | −13.0 | |
| Liberal Democrat | Stephen Hardy | 7,450 | 14.3 | +1.3 | |
| Majority | 18,321 | 35.3 | |||
| Turnout | 71.5 | −12.1 | |||
| Labour hold | Swing | ||||
| Party | Candidate | Votes | % | ± | |
|---|---|---|---|---|---|
| Labour | Harry Barnes | 28,860 | 48.8 | +4.4 | |
| Conservative | John Henry Hayes | 22,590 | 38.2 | +0.5 | |
| Liberal Democrat | D Stone | 7,675 | 13.0 | −4.9 | |
| Majority | 6,270 | 10.6 | +3.9 | ||
| Turnout | 59,125 | 80.6 | +1.3 | ||
| Labour hold | Swing | +2.0 | |||
Elections in the 1980s
| Party | Candidate | Votes | % | ± | |
|---|---|---|---|---|---|
| Labour | Harry Barnes | 24,747 | 44.4 | +3.6 | |
| Conservative | John Henry Hayes | 21,027 | 37.7 | +0.8 | |
| Social Democratic | S. P. Hardy | 9,985 | 17.9 | -4.3 | |
| Majority | 3,720 | 6.7 | +2.8 | ||
| Turnout | 55,759 | 79.3 | |||
| Labour hold | Swing | ||||
| Party | Candidate | Votes | % | ± | |
|---|---|---|---|---|---|
| Labour | Raymond Joseph Ellis | 21,094 | 40.8 | ||
| Conservative | I. Bridge | 19,088 | 36.9 | ||
| Social Democratic | S. P. Hardy | 11,494 | 22.2 | ||
| Majority | 2,006 | 3.9 | |||
| Turnout | 51,676 | 79.3 | |||
| Labour hold | Swing | ||||
Elections in the 1970s
| Party | Candidate | Votes | % | ± | |
|---|---|---|---|---|---|
| Labour | Raymond Joseph Ellis | 27,218 | 48.1 | ||
| Conservative | E. Oliver | 21,889 | 38.7 | ||
| Liberal | P. Hall | 7,436 | 13.2 | ||
| Majority | 5,329 | 9.4 | |||
| Turnout | 79.9 | ||||
| Labour hold | Swing | ||||
| Party | Candidate | Votes | % | ± | |
|---|---|---|---|---|---|
| Labour | Thomas Henry Swain | 25,234 | 49.9 | ||
| Conservative | J. C. Ramsden | 14,997 | 29.7 | ||
| Liberal | C. Cook | 10,336 | 20.4 | ||
| Majority | 10,237 | 20.2 | |||
| Turnout | 73.4 | ||||
| Labour hold | Swing | ||||
| Party | Candidate | Votes | % | ± | |
|---|---|---|---|---|---|
| Labour | Thomas Henry Swain | 29,602 | 57.0 | ||
| Conservative | J. C. Ramsden | 22,320 | 43.0 | ||
| Majority | 7,282 | 14.0 | |||
| Turnout | 78.4 | ||||
| Labour hold | Swing | ||||
| Party | Candidate | Votes | % | ± | |
|---|---|---|---|---|---|
| Labour | Thomas Henry Swain | 38,181 | 60.9 | ||
| Conservative | John P Pashley | 24,550 | 39.1 | ||
| Majority | 13,631 | 21.7 | |||
| Turnout | 69.8 | ||||
| Labour hold | Swing | ||||
Elections in the 1960s
| Party | Candidate | Votes | % | ± | |
|---|---|---|---|---|---|
| Labour | Thomas Henry Swain | 38,723 | 66.9 | ||
| Conservative | Michael Fabian Spungin | 19,123 | 33.1 | ||
| Majority | 19,600 | 33.9 | |||
| Turnout | 73.9 | ||||
| Labour hold | Swing | ||||
| Party | Candidate | Votes | % | ± | |
|---|---|---|---|---|---|
| Labour | Thomas Henry Swain | 38,657 | 64.2 | ||
| Conservative | Michael Fabian Spungin | 21,564 | 35.8 | ||
| Majority | 17,093 | 28.4 | |||
| Turnout | 77.9 | ||||
| Labour hold | Swing | ||||
Elections in the 1950s
| Party | Candidate | Votes | % | ± | |
|---|---|---|---|---|---|
| Labour | Thomas Henry Swain | 37,444 | 62.9 | ||
| Conservative | Robert A Ward | 22,112 | 37.1 | ||
| Majority | 15,332 | 25.7 | |||
| Turnout | 80.8 | ||||
| Labour hold | Swing | ||||
| Party | Candidate | Votes | % | ± | |
|---|---|---|---|---|---|
| Labour | Henry White | 34,965 | 66.5 | ||
| Conservative | George R Shaw | 17,621 | 33.5 | ||
| Majority | 17,344 | 33.0 | |||
| Turnout | 76.7 | ||||
| Labour hold | Swing | ||||
| Party | Candidate | Votes | % | ± | |
|---|---|---|---|---|---|
| Labour | Henry White | 33,376 | 66.7 | ||
| Conservative | Peter Hughes | 16,655 | 33.3 | ||
| Majority | 16,721 | 33.4 | |||
| Turnout | 84.4 | ||||
| Labour hold | Swing | ||||
| Party | Candidate | Votes | % | ± | |
|---|---|---|---|---|---|
| Labour | Henry White | 33,417 | 66.3 | ||
| Conservative | George R Shaw | 17,021 | 33.8 | ||
| Majority | 16,396 | 32.5 | |||
| Turnout | 86.4 | ||||
| Labour hold | Swing | ||||
Elections in the 1940s
| Party | Candidate | Votes | % | ± | |
|---|---|---|---|---|---|
| Labour | Henry White | 35,795 | 65.6 | ||
| Conservative | Ronald Edward Warlow | 18,789 | 34.4 | ||
| Majority | 17,006 | 31.2 | |||
| Turnout | 79.0 | ||||
| Labour hold | Swing | ||||
| Party | Candidate | Votes | % | ± | |
|---|---|---|---|---|---|
| Labour | Henry White | Unopposed | N/A | N/A | |
| Labour hold | Swing | N/A | |||
Elections in the 1930s
| Party | Candidate | Votes | % | ± | |
|---|---|---|---|---|---|
| Labour | Frank Lee | 25,382 | 57.2 | ||
| Conservative | Horace Brimson Trevor-Cox | 15,802 | 35.6 | ||
| Liberal | Arthur Thomas Marwood | 3,186 | 7.2 | ||
| Majority | 9,580 | 21.6 | |||
| Turnout | 77.9 | ||||
| Labour gain from Conservative | Swing | ||||
| Party | Candidate | Votes | % | ± | |
|---|---|---|---|---|---|
| Conservative | Jardine Bell Whyte | 20,719 | 50.79 | ||
| Labour | Frank Lee | 19,385 | 47.52 | ||
| New Party | Albert Vincent Williams | 689 | 1.69 | ||
| Majority | 1,334 | 3.27 | |||
| Turnout | 79.35 | ||||
| Conservative gain from Labour | Swing | ||||
Elections in the 1920s
| Party | Candidate | Votes | % | ± | |
|---|---|---|---|---|---|
| Labour | Frank Lee | 21,633 | 54.6 | +9.7 | |
| Unionist | Rupert Eric Herbert Samuelson | 9,167 | 23.1 | -10.1 | |
| Liberal | Harry Anson Briggs | 8,861 | 22.3 | +0.4 | |
| Majority | 12,466 | 31.5 | -19.8 | ||
| Turnout | 79.8 | +1.3 | |||
| Labour hold | Swing | +9.9 | |||
| Party | Candidate | Votes | % | ± | |
|---|---|---|---|---|---|
| Labour | Frank Lee | 13,420 | 44.9 | +5.4 | |
| Unionist | George Robert Harland Bowden | 9,914 | 33.2 | +1.7 | |
| Liberal | Philip Guedalla | 6,529 | 21.9 | -7.1 | |
| Majority | 3,506 | 11.7 | +3.7 | ||
| Turnout | 29,863 | 78.5 | +2.7 | ||
| Labour hold | Swing | +1.8 | |||
| Party | Candidate | Votes | % | ± | |
|---|---|---|---|---|---|
| Labour | Frank Lee | 10,971 | 39.5 | +5.6 | |
| Unionist | Charles Waterhouse | 8,768 | 31.5 | -0.7 | |
| Liberal | Philip Guedalla | 8,080 | 29.0 | -4.9 | |
| Majority | 2,203 | 8.0 | +8.0 | ||
| Turnout | 27,819 | 75.8 | -1.5 | ||
| Labour hold | Swing | +3.1 | |||
| Party | Candidate | Votes | % | ± | |
|---|---|---|---|---|---|
| Labour | Frank Lee | 9,359 | 33.9 | ||
| Liberal | Joseph Stanley Holmes | 9,344 | 33.9 | ||
| Unionist | Charles Waterhouse | 8,877 | 32.2 | ||
| Majority | 15 | 0.0 | |||
| Turnout | 77.3 | ||||
| Labour gain from Liberal | Swing | ||||
Elections in the 1910s
| Party | Candidate | Votes | % | ± | |
|---|---|---|---|---|---|
| Liberal | Joseph Stanley Holmes | 6,117 | 31.4 | -6.4 | |
| Labour | Frank Lee | 5,560 | 28.6 | +6.1 | |
| Independent Unionist | George Robert Harland Bowden | 5,049 | 25.9 | -13.8 | |
| Coalition Unionist | Marquess of Hartington | 2,738 | 14.1 | n/a | |
| Majority | 557 | 2.8 | |||
| Turnout | 58.0 | ||||
| Liberal gain from Unionist | Swing | ||||
General Election 1914/15:
Another General Election was required to take place before the end of 1915. The political parties had been making preparations for an election to take place and by the July 1914, the following candidates had been selected;
- Unionist: George Robert Harland Bowden
- Liberal: John Plowright Houfton

| Party | Candidate | Votes | % | ± | |
|---|---|---|---|---|---|
| Unionist | George Robert Harland Bowden | 6,469 | 39.7 | -4.0 | |
| Liberal | John Plowright Houfton | 6,155 | 37.8 | n/a | |
| Labour | James Martin | 3,669 | 22.5 | -33.8 | |
| Majority | 314 | 1.9 | |||
| Turnout | 84.2 | +5.5 | |||
| Unionist gain from Labour | Swing | +14.9 | |||

| Party | Candidate | Votes | % | ± | |
|---|---|---|---|---|---|
| Labour | William Edwin Harvey | 7,838 | 56.3 | ||
| Liberal Unionist | Dr Josiah Court | 6,088 | 43.7 | ||
| Majority | 1,750 | 12.6 | |||
| Turnout | 78.7 | ||||
| Labour hold | Swing | ||||
| Party | Candidate | Votes | % | ± | |
|---|---|---|---|---|---|
| Labour | William Edwin Harvey | 8,715 | |||
| Liberal Unionist | Dr. Josiah Court | 6,411 | |||
| Majority | |||||
| Turnout | |||||
| Labour hold | Swing | ||||
Elections in the 1900s
| Party | Candidate | Votes | % | ± | |
|---|---|---|---|---|---|
| Liberal | William Edwin Harvey | 6,644 | |||
| Liberal Unionist | Dr. Josiah Court | 5,915 | |||
| Majority | 729 | ||||
| Turnout | |||||
| Liberal hold | Swing | ||||
| Party | Candidate | Votes | % | ± | |
|---|---|---|---|---|---|
| Liberal | Thomas Dolling Bolton | 7,665 | 56.5 | +5.2 | |
| Liberal Unionist | Dr. Josiah Court | 5,896 | 43.5 | -5.2 | |
| Majority | 1,769 | 13.0 | +10.4 | ||
| Turnout | 85.3 | +4.9 | |||
| Liberal hold | Swing | +5.2 | |||
| Party | Candidate | Votes | % | ± | |
|---|---|---|---|---|---|
| Liberal | Thomas Dolling Bolton | 5,251 | 51.3 | ||
| Liberal Unionist | Dr. Josiah Court | 4,983 | 48.7 | ||
| Majority | 268 | 2.6 | |||
| Turnout | 80.4 | ||||
| Liberal hold | Swing | ||||
Elections in the 1890s

| Party | Candidate | Votes | % | ± | |
|---|---|---|---|---|---|
| Liberal | Thomas Dolling Bolton | 4,737 | -10.3 | ||
| Liberal Unionist | Dr. Josiah Court | 4,210 | 47.1 | +10.3 | |
| Majority | 527 | 5.8 | -20.6 | ||
| Turnout | 80.9 | +3.5 | |||
| Liberal hold | Swing | -10.3 | |||
| Party | Candidate | Votes | % | ± | |
|---|---|---|---|---|---|
| Liberal | Thomas Dolling Bolton | 5,206 | 63.2 | ||
| Conservative | Frederick Gorell Barnes | 3,034 | 36.8 | ||
| Majority | 2,172 | 26.4 | |||
| Turnout | 77.4 | ||||
| Liberal hold | Swing | ||||
Elections in the 1880s
| Party | Candidate | Votes | % | ± | |
|---|---|---|---|---|---|
| Liberal | Thomas Dolling Bolton | 3,879 | 55.1 | ||
| Liberal Unionist | Charles Markham | 3,158 | 44.9 | ||
| Majority | 721 | 10.2 | |||
| Turnout | 76.4 | ||||
| Liberal hold | Swing | ||||
| Party | Candidate | Votes | % | ± | |
|---|---|---|---|---|---|
| Liberal | Hon. Francis Egerton | 4,999 | 66.3 | n/a | |
| Conservative | Charles Gould | 2,536 | 33.7 | n/a | |
| Majority | 2,463 | 32.6 | n/a | ||
| Turnout | 81.8 | n/a | |||
| Liberal win (new seat) | |||||
See also
Notes and references
- Notes
- ↑ A county constituency (for the purposes of election expenses and type of returning officer)
- ↑ As with all constituencies, the constituency elects one Member of Parliament (MP) by the first past the post system of election at least every five years.
- References
- ↑ Leigh Rayment's Historical List of MPs – Constituencies beginning with "D" (part 1)
- ↑ "Election Data 2015". Electoral Calculus. Archived from the original on 17 October 2015. Retrieved 17 October 2015.
- ↑ "BBC NEWS – Election 2010 – Derbyshire North East". BBC News.
- 1 2 http://electionresults.blogspot.co.uk/2013/04/derbyshire-north-east-2015.html
- ↑ https://twitter.com/JamesHenryBush/status/569622143358644225
- ↑ http://eastmidslibdems.org.uk/en/gallery/david-batey-parliamentary-candidate-for-north-east-derbyshire
- ↑ https://yournextmp.com/constituency/65676/north-east-derbyshire/
- ↑ "Election Data 2010". Electoral Calculus. Archived from the original on 17 October 2015. Retrieved 17 October 2015.
- ↑ "BBC NEWS – Election 2010 – Derbyshire North East". BBC News.
- ↑ "Election Data 2005". Electoral Calculus. Archived from the original on 15 October 2011. Retrieved 18 October 2015.
- ↑ "Election Data 2001". Electoral Calculus. Archived from the original on 15 October 2011. Retrieved 18 October 2015.
- ↑ "Election Data 1997". Electoral Calculus. Archived from the original on 15 October 2011. Retrieved 18 October 2015.
- ↑ "Election Data 1992". Electoral Calculus. Archived from the original on 15 October 2011. Retrieved 18 October 2015.
- ↑ "Politics Resources". Election 1992. Politics Resources. 9 April 1992. Retrieved 2010-12-06.
- ↑ "Election Data 1987". Electoral Calculus. Archived from the original on 15 October 2011. Retrieved 18 October 2015.
- ↑ "Election Data 1983". Electoral Calculus. Archived from the original on 15 October 2011. Retrieved 18 October 2015.
- 1 2 The Constitutional Year Book 1936, p.222
- 1 2 British parliamentary election results, 1918-1949 by FWS Craig
- 1 2 The Liberal Year Book 1924, p.203
- ↑ The Constitutional Year Book 1914, p.3
- 1 2 3 4 5 6 7 8 British parliamentary election results, 1885-1918 (Craig)
Coordinates: 53°14′N 1°33′W / 53.24°N 1.55°W