1982–83 South Pacific cyclone season
| |
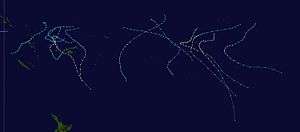
| Season summary map |
| First system formed |
October 31, 1982 |
| Last system dissipated |
April 23, 1983 |
| Strongest storm1 |
Oscar – 920 hPa (mbar), 205 km/h (125 mph) (10-minute sustained) |
| Total depressions |
14 |
| Tropical cyclones |
14 |
| Severe tropical cyclones |
10 (record high) |
| Total fatalities |
Unknown |
| Total damage |
Unknown |
| 1Strongest storm is determined by lowest pressure |
South Pacific tropical cyclone seasons
1980–81, 1981–82, 1982–83, 1983–84, 1984–85 |
| Related articles |
|
|
The 1982–83 South Pacific cyclone season was one of the most active and longest South Pacific tropical cyclone seasons on record, with 14 tropical cyclones occurring within the South Pacific basin between 160°E and 120°W. During the season tropical cyclones were monitored by the meteorological services of Australia, Fiji, French Polynesia and New Zealand. The United States Armed Forces through the Joint Typhoon Warning Center (JTWC) and Naval Pacific Meteorology and Oceanography Center (NPMOC), also monitored the basin and issued unofficial warnings for American interests. The first tropical cyclone of the season developed a day before the season officially began on October 31, while the last tropical cyclone of the season dissipated on April 23. Most of the activity during the season occurred within the central and eastern parts of the basin with French Polynesia affected by several systems.
Seasonal summary
The 1982–83 season was one of the most active and longest South Pacific tropical cyclone seasons on record, with 14 tropical cyclones occurring within the South Pacific basin between 160°E and 120°W. The season was characterised by a very strong El Niño Event, which resulted in eleven tropical cyclones occurring to the east of the International Dateline. Five of these tropical cyclones went on to affect the island nation of French Polynesia, which it was thought had not been affected by a tropical cyclone since another very strong El Nino episode in 1905-06.[1]
During the season, ten of the fourteen tropical cyclones observed to the east of 160 E were severe tropical cyclones, with 5 of them occurring in the French Polynesia region which represented one more than was experienced in the same area over the previous 13 seasons.[2]
Storms
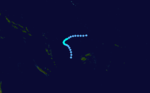
Tropical Cyclone Joti
| Category 2 tropical cyclone (Australian scale) |
| Category 1 tropical cyclone (SSHWS) |
|
|
| Duration |
October 31 – November 8 |
| Peak intensity |
110 km/h (70 mph) (10-min) 975 hPa (mbar) |
Joti existed from October 31 to November 8.
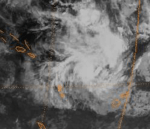
Tropical Cyclone Kina
| Category 1 tropical cyclone (Australian scale) |
| Tropical storm (SSHWS) |
|
|
| Duration |
November 6 – November 13 |
| Peak intensity |
75 km/h (45 mph) (10-min) 990 hPa (mbar) |
When Kina crossed Vanautu's Efate Island, no damage was reported to have occurred.[3]
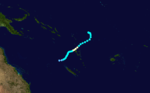
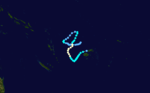
Tropical Cyclone Lisa
| Category 2 tropical cyclone (Australian scale) |
| Tropical storm (SSHWS) |
|
|
| Duration |
December 10 – December 18 |
| Peak intensity |
110 km/h (70 mph) (10-min) 975 hPa (mbar) |
Tropical Cyclone Lisa was first noted as shallow depression by the FMS during December 10, while it was located to the west of the Cook Island: Penrhyn.[4][5] Over the next 2 days the system gradually developed further, as it moved south-eastwards towards French Polynesia's Bora Bora island.[4] The system was subsequently estimated to have developed gale force winds near its centre and was declared a tropical cyclone during December 12, while it was located 240 km (150 mi) to the northwest of Bora Bora.[5][4]
Severe Tropical Cyclone Mark
| Category 3 severe tropical cyclone (Australian scale) |
| Category 1 tropical cyclone (SSHWS) |
|
|
| Duration |
January 20 – February 1 |
| Peak intensity |
150 km/h (90 mph) (10-min) 955 hPa (mbar) |
Mark existed from January 20 to February 1.
Severe Tropical Cyclone Nano
| Category 3 severe tropical cyclone (Australian scale) |
| Category 1 tropical cyclone (SSHWS) |
|
|
| Duration |
January 21 – January 29 |
| Peak intensity |
120 km/h (75 mph) (10-min) 970 hPa (mbar) |
Nano existed from January 21 to January 29.
Severe Tropical Cyclone Nisha-Orama
| Category 4 severe tropical cyclone (Australian scale) |
| Category 3 tropical cyclone (SSHWS) |
|
|
| Duration |
February 21 – February 27 |
| Peak intensity |
185 km/h (115 mph) (10-min) 925 hPa (mbar) |
Nisha existed from February 21 to February 27.
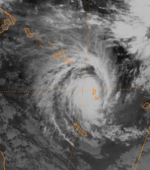
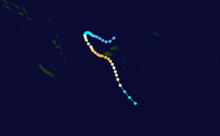
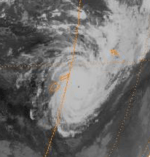
Severe Tropical Cyclone Oscar
| Category 5 severe tropical cyclone (Australian scale) |
| Category 3 tropical cyclone (SSHWS) |
|
|
| Duration |
February 23 – March 6 |
| Peak intensity |
205 km/h (125 mph) (10-min) 920 hPa (mbar) |
Oscar existed from February 23 to March 6.
Tropical Cyclone Prema
| Category 1 tropical cyclone (Australian scale) |
| Tropical storm (SSHWS) |
|
|
| Duration |
January 25 – March 6 |
| Peak intensity |
85 km/h (50 mph) (10-min) 987 hPa (mbar) |
Prema existed from January 25 to March 6.
Severe Tropical Cyclone Rewa
| Category 4 severe tropical cyclone (Australian scale) |
| Category 2 tropical cyclone (SSHWS) |
|
|
| Duration |
March 7 – March 15 |
| Peak intensity |
185 km/h (115 mph) (10-min) 925 hPa (mbar) |
During March 7, a tropical depression developed about 650 km (405 mi) to the northeast of the Society Islands. During that day, the system started to rapidly develop further as it moved and was named Rewa, as it had developed into a Category 1 tropical cyclone.
Rewa exacerbated the destruction caused by Severe Tropical Cyclone Nisha/Orama earlier in the season and destroyed more than 200 houses.
Tropical Cyclone Saba
| Category 2 tropical cyclone (Australian scale) |
|
|
| Duration |
March 20 – March 25 |
| Peak intensity |
95 km/h (60 mph) (10-min) 985 hPa (mbar) |
Saba existed from March 20 to March 25.
Severe Tropical Cyclone Sarah
| Category 3 severe tropical cyclone (Australian scale) |
| Category 2 tropical cyclone (SSHWS) |
|
|
| Duration |
March 22 – April 4 |
| Peak intensity |
155 km/h (95 mph) (10-min) 940 hPa (mbar) |
Sarah existed from March 22 to April 4.
Severe Tropical Cyclone Tomasi
| Category 4 severe tropical cyclone (Australian scale) |
| Category 3 tropical cyclone (SSHWS) |
|
|
| Duration |
March 28 – April 5 |
| Peak intensity |
185 km/h (115 mph) (10-min) 925 hPa (mbar) |
Tomasi existed from March 28 to April 5.
Severe Tropical Cyclone Veena
| Category 4 severe tropical cyclone (Australian scale) |
| Category 3 tropical cyclone (SSHWS) |
|
|
| Duration |
April 8 – April 14 |
| Peak intensity |
185 km/h (115 mph) (10-min) 925 hPa (mbar) |
Veena existed from April 8 to April 14.
Severe Tropical Cyclone William
| Category 3 severe tropical cyclone (Australian scale) |
| Category 1 tropical cyclone (SSHWS) |
|
|
| Duration |
April 15 – April 23 |
| Peak intensity |
150 km/h (90 mph) (10-min) 955 hPa (mbar) |
William existed from April 15 to April 23.
Seasonal effects
See also
References
- ↑ http://dailypost.vu/news/developing-el-nino-predicted-stronger-than---dubbed-godzilla/article_fe5cafeb-3ac9-5da5-b17d-9c3f29359515.html
- ↑ Thompson, Craig; Ready, Stephen; Zheng, Xiaogu (1992). Tropical Cyclones in the Southwest Pacific: November 1979 – May 1989 (PDF). New Zealand Meteorological Service, (Meteorological Service of New Zealand Limited, National Institute of Water and Atmospheric Research). ISBN 0-477-07346-8. Archived from the original on May 30, 2012. Retrieved May 10, 2012.
- ↑ Tropical cyclones in Vanuatu: 1847 to 1994 (PDF) (Report). Vanuatu Meteorological Service. May 19, 1994. Archived from the original on November 18, 2010. Retrieved February 21, 2015.
- 1 2 3 MetService (May 22, 2009). "TCWC Wellington Best Track Data 1967–2006". International Best Track Archive for Climate Stewardship.
- 1 2 Deangellis, Richard M (1983). Wilson, Elwyn E, ed. Hurricane Alley: Tropical Cyclones — December 1982 (Mariners Weather Log). 27. United States National Oceanic and Atmospheric Administration's National Oceanographic Data Service. p. 108. ISSN 0025-3367. OCLC 648466886.
- ↑ Costello, D. (1986-12-30). "Fiji prepares for worst as cyclone heads for coast". Courier-Mail.
External links