Winnipeg North
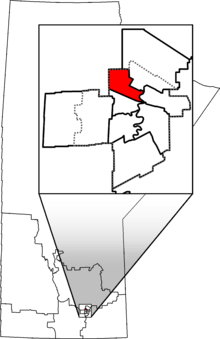 Winnipeg North in relation to other Manitoba federal electoral districts as of the 2013 Representation Order. Dotted line shows Winnipeg city limits. | |||
| Federal electoral district | |||
| Legislature | House of Commons | ||
| MP |
| ||
| District created | 1914 | ||
| First contested | 1917 | ||
| Last contested | 2015 | ||
| District webpage | profile, map | ||
| Demographics | |||
| Population (2011)[1] | 88,616 | ||
| Electors (2015) | 56,380 | ||
| Area (km²)[2] | 38 | ||
| Pop. density (per km²) | 2,332 | ||
| Census divisions | Division No. 11 | ||
| Census subdivisions | Winnipeg | ||
Winnipeg North (French: Winnipeg-Nord) is a federal electoral district in Canada that has been represented in the House of Commons of Canada since 1917. It covers the northern portion of Winnipeg, Manitoba.
Geography
The riding includes the neighbourhoods of Jefferson North, Mandalay West, Maple Glen, Garden City, Jefferson, St. John's, Inkster Faraday, William Whyte, Dufferin, North End, Burrows Central, Robertson, Selkirk, Mynarski, Northwood, Shaughnessy Heights, Lord, Tyndall Park, Garden Grove, Oak Point, Inkster Gardens, Luxton, the south part of The Maples and the north part of Logan CPR in the Winnipeg.
Demographics
- According to the Canada 2011 Census; 2013 representation[3][4]
Ethnic groups: 39.2% White, 28.6% Filipino, 18.2% Aboriginal, 1.9% Southeast Asian, 1.9% Black, 1.3% Chinese
Languages: 62.6% English, 16.8% Tagalog, 5.0% Punjabi, 1.9% Portuguese, 1.8% Ukrainian, 1.3% Polish, 1.3% French, 1.0% Chinese
Religions: 68.0% Christian (44.0% Catholic, 3.4% United Church, 2.8% Anglican, 1.8% Baptist, 1.7% Pentecostal, 1.6% Lutheran, 1.2% Christian Orthodox, 11.4% Other), 5.1% Sikh, 1.3% Buddhist, 1.1% Hindu, 22.2% No religion
Median income (2010): $24,695
Average income (2010): $28,984
Winnipeg North is the riding with:
- The highest % of people of Filipino ethnic origin (20.7%)[5]
- The highest % of people belonging to the Filipino visible minority group (20.2%)[6]
- The highest % of native speakers of Tagalog (Pilipino, Filipino) (16.8%)[7]
- The highest % of immigrants from Southeast Asia in the overall population (15.2%)[8][9]
- The highest % of immigrants from Philippines in the overall population (13.5%)
History
This riding was originally created in 1914 from Winnipeg and Selkirk ridings.
In 1997, it was renamed "Winnipeg North—St. Paul".
In 2003, Winnipeg North—St. Paul was abolished with parts transferred to Winnipeg North, Winnipeg Centre and Kildonan—St. Paul ridings. Winnipeg North was re-created from parts of Winnipeg North—St. Paul and Winnipeg North Centre.
Often a safe seat for the New Democratic Party, in 2011 Winnipeg North was narrowly retained by Liberal incumbent Kevin Lamoureux in an otherwise dismal performance by the party nationwide.[10] Along with Wascana in Saskatchewan, Winnipeg North was one of only two seats won by the Liberals in the Prairie Provinces.
This riding gained territory from Kildonan—St. Paul during the 2012 electoral redistribution.
Members of Parliament
This riding has elected the following Members of Parliament:
| Parliament | Years | Member | Party | |
|---|---|---|---|---|
| Winnipeg North Riding created from Winnipeg and Selkirk |
||||
| 13th | 1917–1921 | Matthew Robert Blake | Government (Unionist) | |
| 14th | 1921–1925 | Edward James McMurray | Liberal | |
| 15th | 1925–1926 | Abraham Albert Heaps | Labour | |
| 16th | 1926–1930 | |||
| 17th | 1930–1935 | |||
| 18th | 1935–1940 | Co-operative Commonwealth | ||
| 19th | 1940–1945 | Charles Stephen Booth | Liberal | |
| 20th | 1945–1949 | Alistair Stewart | Co-operative Commonwealth | |
| 21st | 1949–1953 | |||
| 22nd | 1953–1957 | |||
| 23rd | 1957–1958 | |||
| 24th | 1958–1962 | Murray Smith | Progressive Conservative | |
| 25th | 1962–1963 | David Orlikow | New Democratic | |
| 26th | 1963–1965 | |||
| 27th | 1965–1968 | |||
| 28th | 1968–1972 | |||
| 29th | 1972–1974 | |||
| 30th | 1974–1979 | |||
| 31st | 1979–1980 | |||
| 32nd | 1980–1984 | |||
| 33rd | 1984–1988 | |||
| 34th | 1988–1993 | Rey Pagtakhan | Liberal | |
| 35th | 1993–1997 | |||
| Riding dissolved into Winnipeg North—St. Paul | ||||
| Riding re-created from Winnipeg North—St. Paul and Winnipeg North Centre | ||||
| 38th | 2004–2006 | Judy Wasylycia-Leis | New Democratic | |
| 39th | 2006–2008 | |||
| 40th | 2008–2010 | |||
| 2010–2011 | Kevin Lamoureux | Liberal | ||
| 41st | 2011–2015 | |||
| 42nd | 2015–Present | |||
Election results
Winnipeg North, 2004–present
| Canadian federal election, 2015 | ||||||||
|---|---|---|---|---|---|---|---|---|
| Party | Candidate | Votes | % | ∆% | Expenditures | |||
| Liberal | Kevin Lamoureux | 23,402 | 68.90 | +33.91 | – | |||
| Conservative | Harpreet Turka | 5,193 | 15.29 | -12.07 | – | |||
| New Democratic | Levy Abad | 4,543 | 13.38 | -22.02 | – | |||
| Green | John Redekopp | 826 | 2.43 | +0.65 | – | |||
| Total valid votes/Expense limit | 33,964 | 100.00 | $192,461.72 | |||||
| Total rejected ballots | 269 | 0.79 | – | |||||
| Turnout | 34,233 | 59.40 | ||||||
| Eligible voters | 57,627 | |||||||
| Liberal notional gain from New Democratic | Swing | +27.97 | ||||||
| Source: Elections Canada[11][12] | ||||||||
| 2011 federal election redistributed results[13] | |||
|---|---|---|---|
| Party | Vote | % | |
| New Democratic | 9,440 | 35.40 | |
| Liberal | 9,331 | 34.99 | |
| Conservative | 7,295 | 27.36 | |
| Green | 475 | 1.78 | |
| Others | 126 | 0.47 | |
| Canadian federal election, 2011 | ||||||||
|---|---|---|---|---|---|---|---|---|
| Party | Candidate | Votes | % | ∆% | Expenditures | |||
| Liberal | Kevin Lamoureux[14] | 9,097 | 35.78 | -10.54 | $75,214.57 | |||
| New Democratic | Rebecca Blaikie | 9,053 | 35.60 | -5.57 | $71,243.32 | |||
| Conservative | Ann Matejicka | 6,701 | 26.35 | +15.9 | $40,787.18 | |||
| Green | John Harvie | 458 | 1.80 | +1.08 | $0.00 | |||
| Communist | Frank Komarniski | 118 | 0.46 | +0.01 | $502.42 | |||
| Total valid votes/Expense limit | 25,427 | 100.00 | – | |||||
| Total rejected ballots | 136 | 0.53 | -0.04 | |||||
| Turnout | 25,563 | 50.01 | +19.2 | |||||
| Eligible voters | 51,115 | – | ||||||
| Liberal hold | Swing | -4.97 | ||||||
| Canadian federal by-election, November 29, 2010 | ||||||||
|---|---|---|---|---|---|---|---|---|
| Party | Candidate | Votes | % | ∆% | Expenditures | |||
| Liberal | Kevin Lamoureux | 7,303 | 46.32 | +37.10 | $74,020.45 | |||
| New Democratic | Kevin Chief | 6,490 | 41.17 | -21.44 | $64,585.69 | |||
| Conservative | Julie Javier | 1,647 | 10.45 | -11.90 | $53,166.90 | |||
| Green | John Harvie | 114 | 0.72 | -4.03 | $1,410.65 | |||
| Pirate | Jeff Coleman | 94 | 0.60 | – | $62.08 | |||
| Communist | Frank Komarniski | 71 | 0.45 | -0.22 | $192.32 | |||
| Christian Heritage | Eric Truijen | 46 | 0.29 | – | $1,790 | |||
| Total valid votes/Expense limit | 15,765 | 100.00 | $77,132 | |||||
| Total rejected ballots | 91 | 0.57 | +0.07 | |||||
| Turnout | 15,856 | 30.8 | -12 | |||||
| Eligible voters | N/A | – | ||||||
| Due to the resignation of Judy Wasylycia-Leis on April 30, 2010 | ||||||||
| Liberal gain from New Democratic | Swing | +29.27 | ||||||
| Canadian federal election, 2008 | ||||||||
|---|---|---|---|---|---|---|---|---|
| Party | Candidate | Votes | % | ∆% | Expenditures | |||
| New Democratic | Judy Wasylycia-Leis | 14,097 | 62.6% | +5.4% | $55,724 | |||
| Conservative | Ray Larkin | 5,033 | 22.4% | +4.8% | $6,136 | |||
| Liberal | Marcelle Marion | 2,075 | 9.2% | −11.9% | $13,525 | |||
| Green | Catharine Johannson | 1,077 | 4.8% | +1.9% | $491 | |||
| Communist | Frank Komarniski | 151 | 0.7% | +0.2% | $622 | |||
| People's Political Power | Roger F. Poisson | 90 | 0.4% | N/A | $4,416 | |||
| Total valid votes/Expense limit | 22,523 | 100.0% | $75,935 | |||||
| Total rejected ballots | – | – | ||||||
| Turnout | – | % | ||||||
| Canadian federal election, 2006 | ||||||||
|---|---|---|---|---|---|---|---|---|
| Party | Candidate | Votes | % | ∆% | Expenditures | |||
| New Democratic | Judy Wasylycia-Leis | 15,582 | 57.18 | +9.02 | $52,916 | |||
| Liberal | Parmjeet Gill | 5,752 | 21.11 | -15.44 | $64,979 | |||
| Conservative | Garreth McDonald | 4,810 | 17.65 | +5.39 | N/A | |||
| Green | David Carey | 779 | 2.86 | +0.82 | $398 | |||
| Christian Heritage | Eric Truijen | 207 | 0.76 | +0.22 | N/A | |||
| Communist | Darrell Rankin | 123 | 0.45 | +0.03 | $295 | |||
| Total valid votes | 27,253 | 100.00 | ||||||
| Total rejected ballots | 137 | 0.50 | +0.01 | |||||
| Turnout | 27,390 | 51 | +4 | |||||
| Canadian federal election, 2004 | ||||||||
|---|---|---|---|---|---|---|---|---|
| Party | Candidate | Votes | % | ∆% | Expenditures | |||
| New Democratic | Judy Wasylycia-Leis | 12,507 | 48.16 | +1.53 | $49,921 | |||
| Liberal | Rey Pagtakhan | 9,491 | 36.55 | +0.04 | $66,996 | |||
| Conservative | Kris Stevenson | 3,186 | 12.26 | -2.57 | $10,733 | |||
| Green | Alon Weinberg | 531 | 2.04 | – | $2,287 | |||
| Christian Heritage | Eric Truijen | 141 | 0.54 | – | $1,000 | |||
| Communist | Darrell Rankin | 111 | 0.42 | – | $654 | |||
| Total valid votes | 25,967 | 100.00 | ||||||
| Total rejected ballots | 128 | 0.49 | ||||||
| Turnout | 26,095 | 47.13 | ||||||
Change is based on redistributed results from 2000. Conservative change is from a combination of Canadian Alliance and Progressive Conservative votes.
Winnipeg North, 1917–1993
| Canadian federal election, 1993 | ||||||||
|---|---|---|---|---|---|---|---|---|
| Party | Candidate | Votes | % | ∆% | ||||
| Liberal | Rey Pagtakhan | 22,180 | 51.2 | +12.9 | ||||
| New Democratic | Judy Wasylycia-Leis | 13,706 | 31.7 | -2.5 | ||||
| Reform | Mike Wiens | 4,124 | 9.5 | +7.7 | ||||
| Progressive Conservative | Lynn Filbert | 1,992 | 4.6 | -20.0 | ||||
| National | Anna Polonyi | 767 | 1.8 | |||||
| Natural Law | Federico Papetti | 211 | 0.5 | |||||
| Independent | Mary Stanley | 184 | 0.4 | |||||
| Canada Party | Joe Lynch | 135 | 0.3 | |||||
| Total valid votes | 43,299 | 100.0 | ||||||
| Canadian federal election, 1988 | ||||||||
|---|---|---|---|---|---|---|---|---|
| Party | Candidate | Votes | % | ∆% | ||||
| Liberal | Rey Pagtakhan | 16,375 | 38.3 | +13.5 | ||||
| New Democratic | David Orlikow | 14,612 | 34.2 | -9.1 | ||||
| Progressive Conservative | Norman Perry Isler | 10,527 | 24.6 | -5.6 | ||||
| Reform | Ritchie W. Gural | 793 | 1.9 | |||||
| Independent | Stephen Keki | 214 | 0.5 | |||||
| Communist | Frank Goldspink | 150 | 0.4 | -0.3 | ||||
| Independent | Gurdeep Singh | 79 | 0.2 | |||||
| Total valid votes | 42,750 | 100.0 | ||||||
| Canadian federal election, 1984 | ||||||||
|---|---|---|---|---|---|---|---|---|
| Party | Candidate | Votes | % | ∆% | ||||
| New Democratic | David Orlikow | 18,209 | 43.3 | -7.2 | ||||
| Progressive Conservative | Luba Fedorkiw | 12,705 | 30.2 | +7.6 | ||||
| Liberal | Chris Lorenc | 10,421 | 24.8 | -1.1 | ||||
| Communist | Paula Fletcher | 283 | 0.7 | +0.1 | ||||
| Independent | William Hawryluk | 243 | 0.6 | |||||
| Independent | E.T. Dolski | 180 | 0.4 | |||||
| Total valid votes | 42,041 | 100.0 | ||||||
| Canadian federal election, 1980 | ||||||||
|---|---|---|---|---|---|---|---|---|
| Party | Candidate | Votes | % | ∆% | ||||
| New Democratic | David Orlikow | 18,561 | 50.5 | -2.2 | ||||
| Liberal | Walter Hlady | 9,517 | 25.9 | +7.1 | ||||
| Progressive Conservative | Roy Koniuk | 8,313 | 22.6 | -5.0 | ||||
| Communist | William C. Ross | 195 | 0.5 | 0.0 | ||||
| Marxist–Leninist | Brian Ostrow | 149 | 0.4 | +0.1 | ||||
| Total valid votes | 36,735 | 100.0 | ||||||
| Canadian federal election, 1979 | ||||||||
|---|---|---|---|---|---|---|---|---|
| Party | Candidate | Votes | % | ∆% | ||||
| New Democratic | David Orlikow | 22,417 | 52.7 | +11.8 | ||||
| Progressive Conservative | Anne Steen | 11,749 | 27.6 | -5.5 | ||||
| Liberal | Walter Hlady | 8,002 | 18.8 | -4.8 | ||||
| Communist | William C. Ross | 242 | 0.6 | -0.5 | ||||
| Marxist–Leninist | Brian Ostrow | 141 | 0.3 | +0.1 | ||||
| Total valid votes | 42,551 | 100.0 | ||||||
| Canadian federal election, 1974 | ||||||||
|---|---|---|---|---|---|---|---|---|
| Party | Candidate | Votes | % | ∆% | ||||
| New Democratic | David Orlikow | 15,026 | 40.9 | -1.9 | ||||
| Progressive Conservative | Anne Steen | 12,196 | 33.2 | +7.8 | ||||
| Liberal | Robert Parashin | 8,677 | 23.6 | -6.4 | ||||
| Social Credit | William Hawryluk | 410 | 1.1 | |||||
| Communist | William C. Ross | 390 | 1.1 | -0.5 | ||||
| Marxist–Leninist | Avrum Rosner | 80 | 0.2 | |||||
| Total valid votes | 36,779 | 100.0 | ||||||
| Canadian federal election, 1972 | ||||||||
|---|---|---|---|---|---|---|---|---|
| Party | Candidate | Votes | % | ∆% | ||||
| New Democratic | David Orlikow | 15,931 | 42.8 | -2.7 | ||||
| Liberal | Serge Radchuk | 11,150 | 30.0 | -12.7 | ||||
| Progressive Conservative | Anne Steen | 9,446 | 25.4 | +16.0 | ||||
| Independent | W.C. Ross | 587 | 1.6 | -1.0 | ||||
| Independent | C. Aili Waldman | 114 | 0.3 | |||||
| Total valid votes | 37,228 | 100.0 | ||||||
| Canadian federal election, 1968 | ||||||||
|---|---|---|---|---|---|---|---|---|
| Party | Candidate | Votes | % | ∆% | ||||
| New Democratic | David Orlikow | 15,608 | 45.5 | -2.2 | ||||
| Liberal | Cecil W. Semchyshyn | 14,645 | 42.7 | +14.8 | ||||
| Progressive Conservative | Gary Raymond Scherbain | 3,206 | 9.3 | -13.5 | ||||
| Communist | W.C. Ross | 869 | 2.5 | |||||
| Total valid votes | 34,328 | 100.0 | ||||||
| Canadian federal election, 1965 | ||||||||
|---|---|---|---|---|---|---|---|---|
| Party | Candidate | Votes | % | ∆% | ||||
| New Democratic | David Orlikow | 22,950 | 47.7 | +11.2 | ||||
| Liberal | Robert Taft | 13,420 | 27.9 | -3.8 | ||||
| Progressive Conservative | Walter Paschak | 10,992 | 22.8 | -5.5 | ||||
| Social Credit | Jacob Willms | 771 | 1.6 | -1.8 | ||||
| Total valid votes | 48,133 | 100.0 | ||||||
| Canadian federal election, 1963 | ||||||||
|---|---|---|---|---|---|---|---|---|
| Party | Candidate | Votes | % | ∆% | ||||
| New Democratic | David Orlikow | 18,512 | 36.5 | -0.2 | ||||
| Liberal | Paul Parashin | 16,081 | 31.7 | +3.0 | ||||
| Progressive Conservative | Don Thompson | 14,391 | 28.4 | +0.2 | ||||
| Social Credit | Nick Halas | 1,729 | 3.4 | -0.1 | ||||
| Total valid votes | 50,713 | 100.0 | ||||||
| Canadian federal election, 1962 | ||||||||
|---|---|---|---|---|---|---|---|---|
| Party | Candidate | Votes | % | ∆% | ||||
| New Democratic | David Orlikow | 18,236 | 36.7 | -5.3 | ||||
| Liberal | Paul Parashin | 14,270 | 28.7 | +16.4 | ||||
| Progressive Conservative | Murray Smith | 14,000 | 28.1 | -14.3 | ||||
| Social Credit | John De Fehr | 1,733 | 3.5 | |||||
| Communist | W.C. Ross | 1,504 | 3.0 | -0.2 | ||||
| Total valid votes | 49,743 | 100.0 | ||||||
Note: NDP vote is compared to CCF vote in 1958 election. Communist vote is compared to Labour-Progressive vote in 1958 election.
| Canadian federal election, 1958 | ||||||||
|---|---|---|---|---|---|---|---|---|
| Party | Candidate | Votes | % | ∆% | ||||
| Progressive Conservative | Murray Smith | 19,629 | 42.4 | +25.9 | ||||
| Co-operative Commonwealth | Alistair Stewart | 19,414 | 42.0 | -6.7 | ||||
| Liberal | Nina Partrick | 5,700 | 12.3 | -11.1 | ||||
| Labor–Progressive | William Cecil Ross | 1,503 | 3.3 | -0.5 | ||||
| Total valid votes | 46,246 | 100.0 | ||||||
| Canadian federal election, 1957 | ||||||||
|---|---|---|---|---|---|---|---|---|
| Party | Candidate | Votes | % | ∆% | ||||
| Co-operative Commonwealth | Alistair Stewart | 20,354 | 48.7 | -0.5 | ||||
| Liberal | Peter Taraska | 9,806 | 23.5 | -6.4 | ||||
| Progressive Conservative | Murray Smith | 6,905 | 16.5 | +3.8 | ||||
| Social Credit | Nick Halas | 3,161 | 7.6 | |||||
| Labor–Progressive | William Cecil Ross | 1,579 | 3.8 | -4.5 | ||||
| Total valid votes | 41,805 | 100.0 | ||||||
| Canadian federal election, 1953 | ||||||||
|---|---|---|---|---|---|---|---|---|
| Party | Candidate | Votes | % | ∆% | ||||
| Co-operative Commonwealth | Alistair Stewart | 15,005 | 49.2 | +9.9 | ||||
| Liberal | Frank Chester | 9,094 | 29.8 | -8.0 | ||||
| Progressive Conservative | John Kereluk | 3,876 | 12.7 | +7.0 | ||||
| Labor–Progressive | Joseph Zuken | 2,515 | 8.2 | -8.9 | ||||
| Total valid votes | 30,490 | 100.0 | ||||||
| Canadian federal election, 1949 | ||||||||
|---|---|---|---|---|---|---|---|---|
| Party | Candidate | Votes | % | ∆% | ||||
| Co-operative Commonwealth | Alistair Stewart | 12,432 | 39.3 | +1.4 | ||||
| Liberal | Peter Taraska | 11,962 | 37.8 | +12.2 | ||||
| Labor–Progressive | Joseph Zuken | 5,406 | 17.1 | -9.4 | ||||
| Progressive Conservative | John Hunter Restall | 1,816 | 5.7 | -1.8 | ||||
| Total valid votes | 31,616 | 100.0 | ||||||
| Canadian federal election, 1945 | ||||||||
|---|---|---|---|---|---|---|---|---|
| Party | Candidate | Votes | % | ∆% | ||||
| Co-operative Commonwealth | Alistair Stewart | 13,055 | 37.9 | +2.6 | ||||
| Labor–Progressive | Joseph Zuken | 9,116 | 26.5 | +9.8 | ||||
| Liberal | Peter Taraska | 8,839 | 25.7 | -15.2 | ||||
| Progressive Conservative | William John English | 2,584 | 7.5 | +0.4 | ||||
| Social Credit | Henry Lambert Yonker | 864 | 2.5 | |||||
| Total valid votes | 34,458 | 100.0 | ||||||
Note: Labour-Progressive vote is compared to Communist vote in 1940 election. Progressive Conservative vote is compared to "National Government" vote in 1940 election.
| Canadian federal election, 1940 | ||||||||
|---|---|---|---|---|---|---|---|---|
| Party | Candidate | Votes | % | ∆% | ||||
| Liberal | Charles Stephen Booth | 13,015 | 40.9 | +11.6 | ||||
| Co-operative Commonwealth | Abraham Albert Heaps | 11,249 | 35.3 | -6.8 | ||||
| Communist | Leslie Tom Morris | 5,315 | 16.7 | -8.7 | ||||
| National Government | Percy Ellor | 2,255 | 7.1 | |||||
| Total valid votes | 31,834 | 100.0 | ||||||
| Canadian federal election, 1935 | ||||||||
|---|---|---|---|---|---|---|---|---|
| Party | Candidate | Votes | % | ∆% | ||||
| Co-operative Commonwealth | Abraham Albert Heaps | 12,093 | 42.2 | -6.9 | ||||
| Liberal | C.S. Booth | 8,412 | 29.3 | +14.0 | ||||
| Communist | Tim Buck | 7,276 | 25.4 | |||||
| Social Credit | Fred John Welwood | 905 | 3.2 | |||||
| Total valid votes | 28,686 | 100.0 | ||||||
| Canadian federal election, 1930 | ||||||||
|---|---|---|---|---|---|---|---|---|
| Party | Candidate | Votes | % | ∆% | ||||
| Labour | Abraham Albert Heaps | 6,907 | 49.0 | -0.1 | ||||
| Conservative | Matthew Robert Blake | 5,011 | 35.6 | +7.3 | ||||
| Liberal | Leslie Morris | 2,164 | 15.4 | -7.1 | ||||
| Total valid votes | 14,082 | 100.0 | ||||||
| Canadian federal election, 1926 | ||||||||
|---|---|---|---|---|---|---|---|---|
| Party | Candidate | Votes | % | ∆% | ||||
| Labour | Abraham Albert Heaps | 6,171 | 49.2 | +10.1 | ||||
| Conservative | Richard R. Knox | 3,555 | 28.3 | -3.4 | ||||
| Liberal | George Boyd McTavish | 2,821 | 22.5 | -6.7 | ||||
| Total valid votes | 12,547 | 100.0 | ||||||
| Canadian federal election, 1925 | ||||||||
|---|---|---|---|---|---|---|---|---|
| Party | Candidate | Votes | % | ∆% | ||||
| Labour | Abraham Albert Heaps | 4,781 | 39.1 | +6.5 | ||||
| Conservative | Matthew Robert Blake | 3,882 | 31.7 | |||||
| Liberal | Edward James McMurray | 3,573 | 29.2 | -35.5 | ||||
| Total valid votes | 12,236 | 100.0 | ||||||
| Canadian federal by-election, 24 October 1923 | ||||||||
|---|---|---|---|---|---|---|---|---|
| Party | Candidate | Votes | % | ∆% | ||||
| Due to McMurray's appointment to an "office of emolument" | ||||||||
| Liberal | Edward James McMurray | 5,628 | 64.7 | +35.3 | ||||
| Labour | Abraham Albert Heaps | 2,835 | 32.6 | +27.2 | ||||
| Unknown | Paul Gigejczuc | 199 | 2.3 | |||||
| Unknown | Joseph Martin | 39 | 0.4 | |||||
| Total valid votes | 8,701 | 100.0 | ||||||
| Canadian federal election, 1921 | ||||||||
|---|---|---|---|---|---|---|---|---|
| Party | Candidate | Votes | % | ∆% | ||||
| Liberal | Edward James McMurray | 3,809 | 36.2 | +9.8 | ||||
| Socialist | Robert Boyd Russell | 3,094 | 29.4 | |||||
| Conservative | Matthew Robert Blake | 3,045 | 29.0 | -44.6 | ||||
| Labour | Jacob Penner | 565 | 5.4 | |||||
| Total valid votes | 10,513 | 100.0 | ||||||
Note: Conservative vote is compared to Government vote in 1917 election. Liberal vote is compared to Opposition vote in 1711 election.
| Canadian federal election, 1917 | ||||||||
|---|---|---|---|---|---|---|---|---|
| Party | Candidate | Votes | % | |||||
| Government (Unionist) | Matthew Robert Blake | 9,656 | 73.6 | |||||
| Opposition (Laurier Liberals) | Richard Arthur Rigg | 3,472 | 26.4 | |||||
| Total valid votes | 13,128 | 100.0 | ||||||
See also
References
- "(Code 46012) Census Profile". 2011 census. Statistics Canada. 2012. Retrieved 2011-03-03.
- Riding history for Winnipeg North (1914–1997) from the Library of Parliament
- Riding history for Winnipeg North (2003– ) from the Library of Parliament
- Expenditures - 2008
- Expenditures - 2004
Notes
- ↑ Statistics Canada: 2012
- ↑ Statistics Canada: 2012
- ↑ http://www12.statcan.gc.ca/census-recensement/2011/dp-pd/prof/details/page.cfm?Lang=E&Geo1=FED2013&Code1=46012&Geo2=PR&Code2=46&Data=Count&SearchText=Winnipeg%20North&SearchType=Begins&SearchPR=01&B1=All&Custom=&TABID=1
- ↑ http://www12.statcan.gc.ca/nhs-enm/2011/dp-pd/prof/details/page.cfm?Lang=E&Geo1=FED2013&Code1=46012&Data=Count&SearchText=Winnipeg%20North&SearchType=Begins&SearchPR=01&A1=All&B1=All&Custom=&TABID=1
- ↑ "2Profile of Ethnic Origin and Visible Minorities for Canada, Provinces, Territories and Federal Electoral Districts (2003 Representation Order), 2006 Census". 2.statcan.gc.ca. Retrieved 2012-12-02.
- ↑ "2006 Census of Canada: Topic-based tabulations | Federal Electoral District (FED) Profile, 2006 Census". 2.statcan.gc.ca. Retrieved 2012-11-16.
- ↑ "2011 Census of Canada: Topic-based tabulations | Detailed Mother Tongue (232), Knowledge of Official Languages (5), Age Groups (17A) and Sex (3) for the Population Excluding Institutional Residents of Canada, Provinces, Territories and Federal Electoral Districts (2003 Representation Order), 2011 Census". 2.statcan.gc.ca. Retrieved 2012-11-16.
- ↑ "Immigrant Status and Place of Birth (38), Sex (3) and Age Groups (10) for the Population of Canada, Provinces, Territories and Federal Electoral Districts (2003 Representation Order), 2006 Census - 20% Sample Data". 2.statcan.gc.ca. Retrieved 2012-11-23.
- ↑ "Appendix J Comparison of places of birth disseminated in 2006, 2001 and 1996". 2.statcan.ca. 2009-11-20. Retrieved 2012-11-30.
- ↑ Proussalidis, Daniel. "Liberals win seat by 44 votes after recount", Sun News Network, May 17, 2011. (accessed 14 January 2012)
- ↑ Elections Canada – Confirmed candidates for Winnipeg North, 30 September 2015
- ↑ Elections Canada – Preliminary Election Expenses Limits for Candidates
- ↑ Pundits' Guide to Canadian Elections
- ↑ Elections Canada accessed May 17, 2011
Coordinates: 49°55′34″N 97°10′26″W / 49.926°N 97.174°W