Villette, Vaud
| Villette | ||
|---|---|---|
| Former municipality of Switzerland | ||
|
Villette village | ||
| ||
 Villette | ||
|
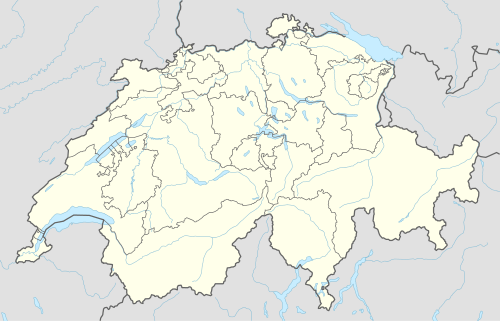
Location of Villette _2008.png) | ||
| Coordinates: 46°29′N 6°42′E / 46.483°N 6.700°ECoordinates: 46°29′N 6°42′E / 46.483°N 6.700°E | ||
| Country | Switzerland | |
| Canton | Vaud | |
| District | Lavaux-Oron | |
| Government | ||
| • Mayor | Jean-Pierre HAENNI | |
| Area | ||
| • Total | 1.37 km2 (0.53 sq mi) | |
| Elevation | 467 m (1,532 ft) | |
| Population | ||
| • Total | 593 | |
| • Density | 430/km2 (1,100/sq mi) | |
| Demonym(s) | Lè z'Aragne | |
| Postal code | 1091 | |
| SFOS number | 5612 | |
| Surrounded by | Forel (Lavaux), Grandvaux, Lugrin (FR-74), Lutry, Meillerie (FR-74), Savigny | |
| Website |
www Profile (French), SFSO statistics | |
%2C_Suisse_et_lac_L%C3%A9man.jpg)

Villette is a former municipality in the Swiss canton of Vaud, located in the district of Lavaux-Oron.
The municipalities of Cully, Epesses, Grandvaux, Riex and Villette (Lavaux) merged on 1 July 2011 into the new municipality of Bourg-en-Lavaux.[1]
Geography

Villette has an area, as of 2009, of 1.37 square kilometres (0.53 sq mi). Of this area, 0.95 km2 (0.37 sq mi) or 69.3% is used for agricultural purposes, while 0.02 km2 (0.0077 sq mi) or 1.5% is forested. Of the rest of the land, 0.39 km2 (0.15 sq mi) or 28.5% is settled (buildings or roads), 0.03 km2 (7.4 acres) or 2.2% is either rivers or lakes.[2]
Of the built up area, housing and buildings made up 11.7% and transportation infrastructure made up 14.6%. while parks, green belts and sports fields made up 1.5%. Out of the forested land, 0.0% of the total land area is heavily forested and 1.5% is covered with orchards or small clusters of trees. Of the agricultural land, 29.2% is used for growing crops and 6.6% is pastures, while 33.6% is used for orchards or vine crops. All the water in the municipality is in lakes.[2]
The municipality was part of the Lavaux District until it was dissolved on 31 August 2006, and Villette became part of the new district of Lavaux-Oron.[3]
Coat of arms
The blazon of the municipal coat of arms is Per fess Argent and Gules, a Vine counterchanged, leaved Vert.[4]
Demographics
Villette has a population (as of 2009) of 593.[5] As of 2008, 18.0% of the population are resident foreign nationals.[6] Over the last 10 years (1999–2009 ) the population has changed at a rate of 5%. It has changed at a rate of 1.8% due to migration and at a rate of 1.4% due to births and deaths.[5]
Most of the population (as of 2000) speaks French (499 or 88.5%), with German being second most common (26 or 4.6%) and English being third (11 or 2.0%). There are 8 people who speak Italian.[7]
Of the population in the municipality 134 or about 23.8% were born in Villette and lived there in 2000. There were 215 or 38.1% who were born in the same canton, while 93 or 16.5% were born somewhere else in Switzerland, and 113 or 20.0% were born outside of Switzerland.[7]
In 2008 there were 4 live births to Swiss citizens and 1 birth to non-Swiss citizens, and in same time span there were 4 deaths of Swiss citizens. Ignoring immigration and emigration, the population of Swiss citizens remained the same while the foreign population increased by 1. There were 2 Swiss men who emigrated from Switzerland. At the same time, there was 1 non-Swiss man who emigrated from Switzerland to another country and 1 non-Swiss woman who immigrated from another country to Switzerland. The total Swiss population change in 2008 (from all sources, including moves across municipal borders) was a decrease of 13 and the non-Swiss population increased by 12 people. This represents a population growth rate of -0.2%.[6] The age distribution of the population (as of 2000) is children and teenagers (0–19 years old) make up 24.8% of the population, while adults (20–64 years old) make up 61.2% and seniors (over 64 years old) make up 14%.[5]
As of 2000, there were 235 people who were single and never married in the municipality. There were 287 married individuals, 18 widows or widowers and 24 individuals who are divorced.[7]
As of 2000 the average number of residents per living room was 0.53 which is fewer people per room than the cantonal average of 0.61 per room.[5] In this case, a room is defined as space of a housing unit of at least 4 m2 (40 sq ft) as normal bedrooms, dining rooms, living rooms, kitchens and habitable cellars and attics.[8] About 52.4% of the total households were owner-occupied, or in other words did not pay rent (though they may have a mortgage or a rent-to-own agreement).[9]
As of 2000, there were 217 private households in the municipality, and an average of 2.6 persons per household.[5] There were 48 households that consist of only one person and 22 households with five or more people. Out of a total of 221 households that answered this question, 21.7% were households made up of just one person and there were 4 adults who lived with their parents. Of the rest of the households, there are 68 married couples without children, 78 married couples with children There were 15 single parents with a child or children. There were 4 households that were made up of unrelated people and 4 households that were made up of some sort of institution or another collective housing.[7]
In 2000 there were 95 single-family homes (or 55.9% of the total) out of a total of 170 inhabited buildings. There were 24 multi-family buildings (14.1%), along with 43 multi-purpose buildings that were mostly used for housing (25.3%) and 8 other use buildings (commercial or industrial) that also had some housing (4.7%). Of the single-family homes 19 were built before 1919, while 12 were built between 1990 and 2000. The greatest number of single-family homes (21) were built between 1919 and 1945. The most multi-family homes (10) were built before 1919 and the next most (7) were built between 1961 and 1970.[10]
In 2000 there were 235 apartments in the municipality. The most common apartment size was 5 rooms of which there were 53. There were 5 single-room apartments and 115 apartments with five or more rooms. Of these apartments, a total of 206 apartments (87.7% of the total) were permanently occupied, while 21 apartments (8.9%) were seasonally occupied and 8 apartments (3.4%) were empty.[10] As of 2009, the construction rate of new housing units was 0 new units per 1000 residents.[5] The vacancy rate for the municipality, in 2010, was 0%.[5]
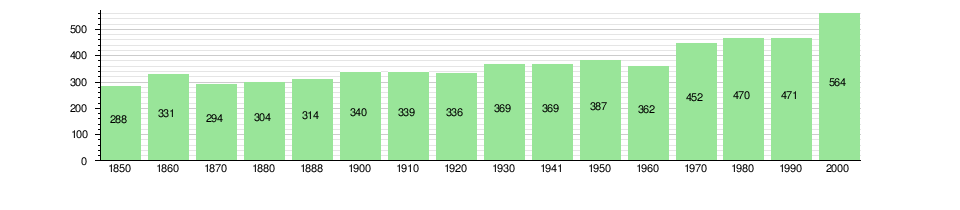
The historical population is given in the following chart:[11]
Heritage sites of national significance

The municipality contains part of the UNESCO World Heritage Site: Lavaux, Vineyard Terraces which is also listed as a Swiss heritage site of national significance. The entire village of Aran is part of the Inventory of Swiss Heritage Sites.[12]
Politics
In the 2007 federal election the most popular party was the SVP which received 20.84% of the vote. The next three most popular parties were the FDP (19.9%), the LPS Party (15.23%) and the SP (12.82%). In the federal election, a total of 238 votes were cast, and the voter turnout was 62.5%.[13]
Economy
As of 2010, Villette had an unemployment rate of 1%. As of 2008, there were 45 people employed in the primary economic sector and about 16 businesses involved in this sector. 9 people were employed in the secondary sector and there were 4 businesses in this sector. 85 people were employed in the tertiary sector, with 14 businesses in this sector.[5] There were 282 residents of the municipality who were employed in some capacity, of which females made up 40.4% of the workforce.
In 2008 the total number of full-time equivalent jobs was 108. The number of jobs in the primary sector was 35, all of which were in agriculture. The number of jobs in the secondary sector was 8 of which 3 or (37.5%) were in manufacturing and 5 (62.5%) were in construction. The number of jobs in the tertiary sector was 65. In the tertiary sector; 4 or 6.2% were in the sale or repair of motor vehicles, 1 was in the movement and storage of goods, 49 or 75.4% were in a hotel or restaurant, 2 or 3.1% were the insurance or financial industry, 2 or 3.1% were technical professionals or scientists, 2 or 3.1% were in education.[14]
In 2000, there were 42 workers who commuted into the municipality and 216 workers who commuted away. The municipality is a net exporter of workers, with about 5.1 workers leaving the municipality for every one entering. About 9.5% of the workforce coming into Villette are coming from outside Switzerland.[15] Of the working population, 13.5% used public transportation to get to work, and 63.5% used a private car.[5]
Religion
From the 2000 census, 152 or 27.0% were Roman Catholic, while 272 or 48.2% belonged to the Swiss Reformed Church. Of the rest of the population, there were 2 members of an Orthodox church (or about 0.35% of the population), and there were 51 individuals (or about 9.04% of the population) who belonged to another Christian church. There was 1 individual who was Islamic. There was 1 person who was Buddhist. 99 (or about 17.55% of the population) belonged to no church, are agnostic or atheist, and 11 individuals (or about 1.95% of the population) did not answer the question.[7]
Education
In Villette about 172 or (30.5%) of the population have completed non-mandatory upper secondary education, and 157 or (27.8%) have completed additional higher education (either University or a Fachhochschule). Of the 157 who completed tertiary schooling, 52.2% were Swiss men, 31.8% were Swiss women, 8.9% were non-Swiss men and 7.0% were non-Swiss women.[7]
As of 2000, there were 23 students in Villette who came from another municipality, while 100 residents attended schools outside the municipality.[15]
Notes and references
- ↑ Amtliches Gemeindeverzeichnis der Schweiz published by the Swiss Federal Statistical Office (German) accessed 17 February 2011
- 1 2 Swiss Federal Statistical Office-Land Use Statistics 2009 data (German) accessed 25 March 2010
- ↑ Nomenklaturen – Amtliches Gemeindeverzeichnis der Schweiz (German) accessed 4 April 2011
- ↑ Flags of the World.com accessed 15-June-2011
- 1 2 3 4 5 6 7 8 9 Swiss Federal Statistical Office accessed 15-June-2011
- 1 2 Swiss Federal Statistical Office - Superweb database - Gemeinde Statistics 1981-2008 (German) accessed 19 June 2010
- 1 2 3 4 5 6 STAT-TAB Datenwürfel für Thema 40.3 - 2000 (German) accessed 2 February 2011
- ↑ Eurostat. "Housing (SA1)". Urban Audit Glossary (pdf). 2007. p. 18. Retrieved 12 February 2010.
- ↑ Urban Audit Glossary pg 17
- 1 2 Swiss Federal Statistical Office STAT-TAB - Datenwürfel für Thema 09.2 - Gebäude und Wohnungen (German) accessed 28 January 2011
- ↑ Swiss Federal Statistical Office STAT-TAB Bevölkerungsentwicklung nach Region, 1850-2000 (German) accessed 29 January 2011
- ↑ "Kantonsliste A-Objekte". KGS Inventar (in German). Federal Office of Civil Protection. 2009. Retrieved 25 April 2011. External link in
|work=(help) - ↑ Swiss Federal Statistical Office, Nationalratswahlen 2007: Stärke der Parteien und Wahlbeteiligung, nach Gemeinden/Bezirk/Canton (German) accessed 28 May 2010
- ↑ Swiss Federal Statistical Office STAT-TAB Betriebszählung: Arbeitsstätten nach Gemeinde und NOGA 2008 (Abschnitte), Sektoren 1-3 (German) accessed 28 January 2011
- 1 2 Swiss Federal Statistical Office - Statweb (German) accessed 24 June 2010
| Wikimedia Commons has media related to Villette, Vaud. |