United States presidential election in South Carolina, 2004
| | ||||||||||||||||||||||||||||||||
| ||||||||||||||||||||||||||||||||
| ||||||||||||||||||||||||||||||||
|
| ||||||||||||||||||||||||||||||||
| County Results
Kerry—70-80%
Kerry—60-70%
Kerry—50-60%
Bush—<50%
Bush—50-60%
Bush—60-70%
Bush—70-80% | ||||||||||||||||||||||||||||||||
| ||||||||||||||||||||||||||||||||


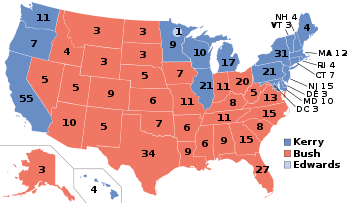
The 2004 United States presidential election in South Carolina took place on November 2, 2004, as part of the 2004 United States presidential election which took place throughout all 50 states and D.C. Voters chose eight representatives, or electors to the Electoral College, who voted for president and vice president.
South Carolina was won by incumbent President George W. Bush by a 17.1% margin of victory. Prior to the election, all 12 news organizations considered this a state Bush would win, or otherwise considered it as a safe red state. No Democrat had won this state since 1976. On election day, Bush won a majority of the counties and congressional districts in the state. The results were very similar to the state's results in 2000, although Democratic Senator John Edwards of the bordering state of North Carolina was chosen as the vice presidential nominee. Bush won both of the two largest counties of South Carolina, although the Democratic nominee usually carries the largest county in the state.
Primaries
For both parties in 2004, South Carolina's was the first primary in a Southern state and the first primary in a state in which African Americans make up a sizable percentage of the electorate.
| | |||||||||||||||||||||||||||||||
| |||||||||||||||||||||||||||||||
| |||||||||||||||||||||||||||||||
|
| |||||||||||||||||||||||||||||||
| Election results by county. Light Blue denotes counties won by Edwards, and Blue denotes those won by Kerry. | |||||||||||||||||||||||||||||||


The Democratic primary was held on February 3, with 45 delegates at stake.[1] It was held on the same day as six other primaries and caucuses.
South Carolina's 45 delegates to the 2004 Democratic National Convention were awarded proportionally based on the results of the primary. The state also sent ten superdelegates.
Candidates
- General Wesley Clark of Arkansas
- Former Governor Howard Dean of Vermont
- Senator John Edwards of North Carolina
- Senator John Kerry of Massachusetts
- Representative Dennis Kucinich of Ohio
- Senator Joe Lieberman of Connecticut, 2000 Democratic Party vice-presidential candidate
- Reverend Al Sharpton of New York
Withdrawn
- Representative Dick Gephardt of Missouri, former House Minority Leader
- Former Senator and Ambassador Carol Moseley-Braun of Illinois
Results
| Key: | Withdrew prior to contest |
| South Carolina Democratic presidential primary, 2004[1] | |||
|---|---|---|---|
| Candidate | Votes | Percentage | National delegates[1] |
| John Edwards | 131,174 | 44.86% | 28 |
| John Kerry | 88,508 | 30.27% | 17 |
| Al Sharpton | 28,201 | 9.65% | 0 |
| Wesley Clark | 21,011 | 7.19% | 0 |
| Howard Dean | 13,815 | 4.72% | 0 |
| Joe Lieberman | 7,147 | 2.44% | 0 |
| Dennis Kucinich | 1,319 | 0.45% | 0 |
| Dick Gephardt | 631 | 0.22% | 0 |
| Carol Moseley-Braun | 577 | 0.20% | 0 |
| Totals | 292,383 | 100.00% | 45 |
Campaign
Predictions

There were 12 news organizations who made state by state predictions of the election. Here are their last predictions before election day.[2]
- D.C. Political Report: Solid Republican
- Associated Press: Solid Bush
- CNN: Bush
- Cook Political Report: Solid Republican
- Newsweek: Solid Bush
- New York Times: Solid Bush
- Rasmussen Reports: Bush
- Research 2000: Solid Bush
- Washington Post: Bush
- Washington Times: Solid Bush
- Zogby International: Bush
- Washington Dispatch: Bush
Polling
Bush won every pre-election poll, each with a double digit margin (except for one) and with at least 49% of the vote. The final 3 poll average showed Bush leading 55% to 41%.[3]
Fundraising
Bush raised $3,113,641.[4] Kerry raised $533,966.[5]
Advertising and visits
Neither campaign advertised or visited this state during the fall election.[6][7]
Analysis
South Carolina, historically part of the Solid South, has become a Republican stronghold in the past few presidential elections. Since Barry Goldwater carried the state in 1964, the only Democratic presidential nominee to win it was Jimmy Carter of neighboring Georgia in 1976. Since then, the Palmetto State has been a safe bet for the Republicans.
Results
| United States presidential election in South Carolina, 2004 | |||||
|---|---|---|---|---|---|
| Party | Candidate | Votes | Percentage | Electoral votes | |
| Republican | George W. Bush | 937,974 | 58.0% | 8 | |
| Democratic | John Kerry | 661,699 | 40.9% | 0 | |
| Independent | Ralph Nader | 5,520 | 0.3% | 0 | |
| Constitution | Michael Peroutka | 5,317 | 0.3% | 0 | |
| Libertarian | Michael Badnarik | 3,608 | 0.2% | 0 | |
| United Citizens | Walt Brown | 2,124 | 0.1% | 0 | |
| Green | David Cobb | 1,488 | 0.1% | 0 | |
| Totals | - | 100.00% | 8 | ||
| Voter turnout (Voting age population) | 51.8% | ||||
Results breakdown
By county
| County | Bush# | Bush% | Kerry# | Kerry% | Others# | Others% | Total# |
|---|---|---|---|---|---|---|---|
| Abbeville | 5,435 | 54.77% | 4,389 | 44.23% | 100 | 1.01% | 9,924 |
| Aiken | 38,912 | 65.72% | 19,687 | 33.25% | 613 | 1.04% | 59,212 |
| Allendale | 984 | 27.42% | 2,563 | 71.43% | 41 | 1.14% | 3,588 |
| Anderson | 43,313 | 66.99% | 20,670 | 31.97% | 670 | 1.04% | 64,653 |
| Bamberg | 2,135 | 35.41% | 3,837 | 63.64% | 57 | 0.95% | 6,029 |
| Barnwell | 4,602 | 53.03% | 3,979 | 45.85% | 97 | 1.12% | 8,678 |
| Beaufort | 28,018 | 60.58% | 17,880 | 38.66% | 348 | 0.75% | 46,246 |
| Berkeley | 29,165 | 60.64% | 18,289 | 38.03% | 641 | 1.33% | 48,095 |
| Calhoun | 3,447 | 49.85% | 3,390 | 49.02% | 78 | 1.13% | 6,915 |
| Charleston | 61,787 | 51.25% | 56,636 | 46.98% | 2,129 | 1.77% | 120,552 |
| Cherokee | 12,064 | 64.63% | 6,443 | 34.52% | 158 | 0.85% | 18,665 |
| Chester | 5,205 | 49.43% | 5,200 | 49.38% | 126 | 1.20% | 10,531 |
| Chesterfield | 7,176 | 51.68% | 6,642 | 47.84% | 67 | 0.48% | 13,885 |
| Clarendon | 6,035 | 45.94% | 7,050 | 53.67% | 51 | 0.39% | 13,136 |
| Colleton | 7,242 | 51.52% | 6,672 | 47.46% | 144 | 1.02% | 14,058 |
| Darlington | 13,406 | 52.73% | 11,811 | 46.45% | 209 | 0.82% | 25,426 |
| Dillon | 4,293 | 46.53% | 4,831 | 52.36% | 102 | 1.11% | 9,226 |
| Dorchester | 26,006 | 62.94% | 14,733 | 35.66% | 578 | 1.40% | 41,317 |
| Edgefield | 5,611 | 57.57% | 4,051 | 41.57% | 84 | 0.86% | 9,746 |
| Fairfield | 3,173 | 36.34% | 5,423 | 62.11% | 135 | 1.55% | 8,731 |
| Florence | 27,488 | 55.91% | 21,267 | 43.25% | 412 | 0.84% | 49,167 |
| Georgetown | 12,420 | 53.40% | 10,456 | 44.96% | 382 | 1.64% | 23,258 |
| Greenville | 109,292 | 66.02% | 54,286 | 32.79% | 1,961 | 1.18% | 165,539 |
| Greenwood | 14,136 | 60.89% | 8,859 | 38.16% | 221 | 0.95% | 23,216 |
| Hampton | 2,798 | 40.09% | 4,096 | 58.69% | 85 | 1.22% | 6,979 |
| Horry | 50,382 | 62.03% | 29,489 | 36.31% | 1,346 | 1.66% | 81,217 |
| Jasper | 2,929 | 42.89% | 3,828 | 56.06% | 72 | 1.05% | 6,829 |
| Kershaw | 14,160 | 61.53% | 8,515 | 37.00% | 340 | 1.48% | 23,015 |
| Lancaster | 11,883 | 61.96% | 7,043 | 36.72% | 253 | 1.32% | 19,179 |
| Laurens | 14,367 | 60.80% | 9,109 | 38.55% | 154 | 0.65% | 23,630 |
| Lee | 2,611 | 36.16% | 4,577 | 63.39% | 32 | 0.44% | 7,220 |
| Lexington | 66,991 | 71.86% | 25,334 | 27.18% | 899 | 0.96% | 93,224 |
| Marion | 2,073 | 49.45% | 2,071 | 49.40% | 48 | 1.15% | 4,192 |
| Marlboro | 3,423 | 39.95% | 4,984 | 58.17% | 161 | 1.88% | 8,568 |
| McCormick | 2,443 | 47.82% | 2,643 | 51.73% | 23 | 0.45% | 5,109 |
| Newberry | 7,257 | 61.54% | 4,273 | 36.23% | 263 | 2.23% | 11,793 |
| Oconee | 18,715 | 68.39% | 8,326 | 30.43% | 323 | 1.18% | 27,364 |
| Orangeburg | 12,676 | 33.80% | 24,655 | 65.74% | 171 | 0.46% | 37,502 |
| Pickens | 29,706 | 73.46% | 10,272 | 25.40% | 461 | 1.14% | 40,439 |
| Richland | 47,390 | 41.71% | 65,098 | 57.30% | 1,130 | 0.99% | 113,618 |
| Saluda | 3,496 | 61.41% | 2,183 | 38.35% | 14 | 0.25% | 5,693 |
| Spartanburg | 61,892 | 64.10% | 33,545 | 34.74% | 1,121 | 1.16% | 96,558 |
| Sumter | 17,905 | 48.76% | 18,582 | 50.60% | 236 | 0.64% | 36,723 |
| Union | 6,592 | 56.18% | 5,036 | 42.92% | 106 | 0.90% | 11,734 |
| Williamsburg | 4,793 | 34.45% | 9,039 | 64.98% | 79 | 0.57% | 13,911 |
| York | 45,180 | 64.45% | 24,201 | 34.52% | 720 | 1.03% | 70,101 |
By congressional district
Bush won 5 of 6 congressional districts.
| District | Bush | Kerry | Representative |
|---|---|---|---|
| 1st | 61% | 39% | Henry E. Brown, Jr. |
| 2nd | 60% | 39% | Joe Wilson |
| 3rd | 66% | 34% | J. Gresham Barrett |
| 4th | 65% | 34% | Jim Demint |
| Bob Inglis | |||
| 5th | 57% | 42% | John M. Spratt, Jr. |
| 6th | 39% | 61% | Jim Clyburn |
Electors
Technically the voters of SC cast their ballots for electors: representatives to the Electoral College. SC is allocated 8 electors because it has 6 congressional districts and 2 senators. All candidates who appear on the ballot or qualify to receive write-in votes must submit a list of 8 electors, who pledge to vote for their candidate and his or her running mate. Whoever wins the majority of votes in the state is awarded all 8 electoral votes. Their chosen electors then vote for President and Vice President. Although electors are pledged to their candidate and running mate, they are not obligated to vote for them. An elector who votes for someone other than his or her candidate is known as a faithless elector.
The electors of each state and the District of Columbia met on December 13, 2004 to cast their votes for President and Vice President. The Electoral College itself never meets as one body. Instead the electors from each state and the District of Columbia met in their respective capitols.
The following were the members of the Electoral College from the state. All 8 were pledged for Bush/Cheney.
- Katon Dawson
- Buddy Witherspoon
- Wayland Moody
- Thomas McLean
- Brenda Bedenbaugh
- Edwin Foulke
- Robert Reagan
- Drew McKissick
References
- 1 2 3 "2004 Presidential Democratic Primary Election Results - South Carolina". U.S. Election Atlas. Retrieved 2009-02-21.
- ↑ http://www.dcpoliticalreport.com/members/2004/Pred2.htm#NW[]
- ↑ http://uselectionatlas.org/USPRESIDENT/GENERAL/CAMPAIGN/2004/polls.php?fips=45
- ↑ http://www.campaignmoney.com/political/campaigns/george_w_bush.asp?cycle=04
- ↑ http://www.campaignmoney.com/political/campaigns/john_f_kerry.asp?cycle=04
- ↑ http://www.cnn.com/ELECTION/2004/special/president/showdown/OH/
- ↑ http://www.cnn.com/ELECTION/2004/special/president/campaign.ads/
See also
State results of the United States presidential election, 2004 | ||
|---|---|---|
|  | |