TED spread

The TED spread is the difference between the interest rates on interbank loans and on short-term U.S. government debt ("T-bills"). TED is an acronym formed from T-Bill and ED, the ticker symbol for the Eurodollar futures contract.
Initially, the TED spread was the difference between the interest rates for three-month U.S. Treasuries contracts and the three-month Eurodollars contract as represented by the London Interbank Offered Rate (LIBOR). However, since the Chicago Mercantile Exchange dropped T-bill futures after the 1987 crash,[1] the TED spread is now calculated as the difference between the three-month LIBOR and the three-month T-bill interest rate.
Formula and reading

The size of the spread is usually denominated in basis points (bps). For example, if the T-bill rate is 5.10% and ED trades at 5.50%, the TED spread is 40 bps. The TED spread fluctuates over time but generally has remained within the range of 10 and 50 bps (0.1% and 0.5%) except in times of financial crisis. A rising TED spread often presages a downturn in the U.S. stock market, as it indicates that liquidity is being withdrawn.
Indicator
The TED spread is an indicator of perceived credit risk in the general economy,[2] since T-bills are considered risk-free while LIBOR reflects the credit risk of lending to commercial banks. An increase in the TED spread is a sign that lenders believe the risk of default on interbank loans (also known as counterparty risk) is increasing. Interbank lenders, therefore, demand a higher rate of interest, or accept lower returns on safe investments such as T-bills. When the risk of bank defaults is considered to be decreasing, the TED spread decreases.[3]
Historical levels
Highs
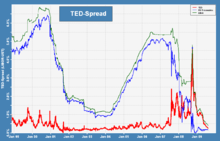
The long-term average of the TED spread has been 30 basis points with a maximum of 50 bps. During 2007, the subprime mortgage crisis ballooned the TED spread to a region of 150–200 bps. On September 17, 2008, the TED spread exceeded 300 bps, breaking the previous record set after the Black Monday crash of 1987.[4] Some higher readings for the spread were due to inability to obtain accurate LIBOR rates in the absence of a liquid unsecured lending market.[5] On October 10, 2008, the TED spread reached another new high of 457 basis points.
Lows
In October 2013, due to worries regarding a potential default on US debt, the 1-month TED went negative for the first time since it started being tracked.[6][7]
See also
References
- ↑ http://www.atimes.com/atimes/Global_Economy/LK25Dj01.html
- ↑ Bloomberg.com Financial Glossary
- ↑ Mission not accomplished not yet, anyway - Paul Krugman - Op-Ed Columnist - New York Times Blog
- ↑ Financial Times. (2008). Panic grips credit markets
- ↑ Bloomberg - Libor Jumps as Banks Seek Cash to Shore Up Finances
- ↑ Obama Says Real Boss in Default Showdown Means Bonds Call Shots, Bloomberg.com, 11 October 2013
- ↑ UBS Asset Management Taps Derivatives to Hedge U.S. Debt Risk, Bloomberg.com, 10 October 2013
External links
- Current TED Spread Quote from StockCharts.com
- Betting the Bank
- Understanding the TED spread from the Econbrowser blog
| ||||||||||||||||||||||||||||||