Subingen
| Subingen | ||
|---|---|---|
| ||
 Subingen | ||
|
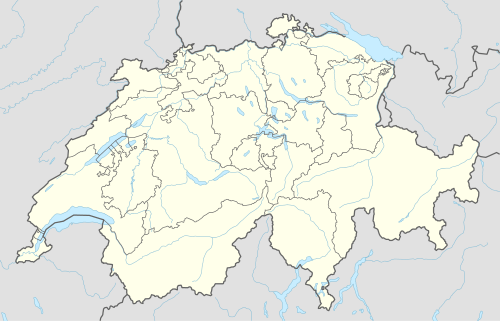
Location of Subingen  | ||
| Coordinates: 47°12′N 7°37′E / 47.200°N 7.617°ECoordinates: 47°12′N 7°37′E / 47.200°N 7.617°E | ||
| Country | Switzerland | |
| Canton | Solothurn | |
| District | Wasseramt | |
| Area[1] | ||
| • Total | 6.25 km2 (2.41 sq mi) | |
| Elevation | 440 m (1,440 ft) | |
| Population (Dec 2015[2]) | ||
| • Total | 3,068 | |
| • Density | 490/km2 (1,300/sq mi) | |
| Postal code | 4553 | |
| SFOS number | 2532 | |
| Surrounded by | Bolken, Deitingen, Derendingen, Etziken, Horriwil, Hüniken, Inkwil (BE), Oekingen, Wangenried (BE) | |
| Website |
www SFSO statistics | |

Subingen is a municipality in the district of Wasseramt in the canton of Solothurn in Switzerland.
Geography
Subingen has an area, as of 2009, of 6.25 square kilometers (2.41 sq mi). Of this area, 3.01 km2 (1.16 sq mi) or 48.2% is used for agricultural purposes, while 1.87 km2 (0.72 sq mi) or 29.9% is forested. Of the rest of the land, 1.28 km2 (0.49 sq mi) or 20.5% is settled (buildings or roads), 0.04 km2 (9.9 acres) or 0.6% is either rivers or lakes and 0.01 km2 (2.5 acres) or 0.2% is unproductive land.[3]
Of the built up area, industrial buildings made up 2.6% of the total area while housing and buildings made up 10.1% and transportation infrastructure made up 6.2%. while parks, green belts and sports fields made up 1.3%. Out of the forested land, 28.2% of the total land area is heavily forested and 1.8% is covered with orchards or small clusters of trees. Of the agricultural land, 40.2% is used for growing crops and 7.0% is pastures. All the water in the municipality is flowing water.[3]
Coat of arms
The blazon of the municipal coat of arms is Azure an Oxen passant on Coupeaux and in Chief a Mullet of Five all Argent.[4]
Demographics
Subingen has a population (as of December 2015) of 3,068.[5] As of 2008, 16.1% of the population are resident foreign nationals.[6] Over the last 10 years (1999–2009 ) the population has changed at a rate of 9.2%. It has changed at a rate of 5.9% due to migration and at a rate of 2.1% due to births and deaths.[7]
Most of the population (as of 2000) speaks German (2,396 or 91.3%), with Italian being second most common (47 or 1.8%) and Turkish being third (44 or 1.7%). There are 13 people who speak French and 2 people who speak Romansh.[8]
As of 2008, the gender distribution of the population was 49.3% male and 50.7% female. The population was made up of 1,192 Swiss men (40.3% of the population) and 265 (9.0%) non-Swiss men. There were 1,274 Swiss women (43.1%) and 227 (7.7%) non-Swiss women.[9] Of the population in the municipality 758 or about 28.9% were born in Subingen and lived there in 2000. There were 860 or 32.8% who were born in the same canton, while 611 or 23.3% were born somewhere else in Switzerland, and 317 or 12.1% were born outside of Switzerland.[8]
In 2008 there were 21 live births to Swiss citizens and 3 births to non-Swiss citizens, and in same time span there were 20 deaths of Swiss citizens and 2 non-Swiss citizen deaths. Ignoring immigration and emigration, the population of Swiss citizens increased by 1 while the foreign population increased by 1. There were 7 Swiss men and 2 Swiss women who immigrated back to Switzerland. At the same time, there were 16 non-Swiss men and 9 non-Swiss women who immigrated from another country to Switzerland. The total Swiss population change in 2008 (from all sources, including moves across municipal borders) was an increase of 26 and the non-Swiss population increased by 29 people. This represents a population growth rate of 1.9%.[6]
The age distribution, as of 2000, in Subingen is; 249 children or 9.5% of the population are between 0 and 6 years old and 450 teenagers or 17.1% are between 7 and 19. Of the adult population, 118 people or 4.5% of the population are between 20 and 24 years old. 932 people or 35.5% are between 25 and 44, and 571 people or 21.8% are between 45 and 64. The senior population distribution is 254 people or 9.7% of the population are between 65 and 79 years old and there are 51 people or 1.9% who are over 80.[10]
As of 2000, there were 1,098 people who were single and never married in the municipality. There were 1,311 married individuals, 109 widows or widowers and 107 individuals who are divorced.[8]
As of 2000, there were 1,046 private households in the municipality, and an average of 2.5 persons per household.[7] There were 272 households that consist of only one person and 74 households with five or more people. Out of a total of 1,053 households that answered this question, 25.8% were households made up of just one person and there were 11 adults who lived with their parents. Of the rest of the households, there are 304 married couples without children, 401 married couples with children There were 47 single parents with a child or children. There were 11 households that were made up of unrelated people and 7 households that were made up of some sort of institution or another collective housing.[8]
In 2000 there were 465 single family homes (or 72.3% of the total) out of a total of 643 inhabited buildings. There were 99 multi-family buildings (15.4%), along with 59 multi-purpose buildings that were mostly used for housing (9.2%) and 20 other use buildings (commercial or industrial) that also had some housing (3.1%). Of the single family homes 19 were built before 1919, while 116 were built between 1990 and 2000. The greatest number of single family homes (92) were built between 1981 and 1990.[11]
In 2000 there were 1,103 apartments in the municipality. The most common apartment size was 4 rooms of which there were 332. There were 23 single room apartments and 414 apartments with five or more rooms. Of these apartments, a total of 1,023 apartments (92.7% of the total) were permanently occupied, while 47 apartments (4.3%) were seasonally occupied and 33 apartments (3.0%) were empty.[11] As of 2009, the construction rate of new housing units was 3.1 new units per 1000 residents.[7] The vacancy rate for the municipality, in 2010, was 2.65%.[7]
The historical population is given in the following chart:[12]

Heritage sites of national significance
The Erdbeereinschlag, a number of Iron Age graves, are listed as a Swiss heritage site of national significance.[13]
Politics
In the 2007 federal election the most popular party was the SVP which received 27.88% of the vote. The next three most popular parties were the FDP (22.67%), the SP (21.41%) and the CVP (19.15%). In the federal election, a total of 837 votes were cast, and the voter turnout was 43.4%.[14]
Economy
As of 2010, Subingen had an unemployment rate of 4.2%. As of 2008, there were 47 people employed in the primary economic sector and about 13 businesses involved in this sector. 674 people were employed in the secondary sector and there were 39 businesses in this sector. 423 people were employed in the tertiary sector, with 75 businesses in this sector.[7] There were 1,441 residents of the municipality who were employed in some capacity, of which females made up 42.8% of the workforce.
In 2008 the total number of full-time equivalent jobs was 986. The number of jobs in the primary sector was 30, all of which were in agriculture. The number of jobs in the secondary sector was 645 of which 340 or (52.7%) were in manufacturing and 305 (47.3%) were in construction. The number of jobs in the tertiary sector was 311. In the tertiary sector; 84 or 27.0% were in wholesale or retail sales or the repair of motor vehicles, 15 or 4.8% were in the movement and storage of goods, 15 or 4.8% were in a hotel or restaurant, 18 or 5.8% were in the information industry, 7 or 2.3% were the insurance or financial industry, 23 or 7.4% were technical professionals or scientists, 63 or 20.3% were in education and 13 or 4.2% were in health care.[15]
In 2000, there were 638 workers who commuted into the municipality and 1,077 workers who commuted away. The municipality is a net exporter of workers, with about 1.7 workers leaving the municipality for every one entering.[16] Of the working population, 13.5% used public transportation to get to work, and 60.9% used a private car.[7]
Religion
From the 2000 census, 1,067 or 40.6% were Roman Catholic, while 928 or 35.4% belonged to the Swiss Reformed Church. Of the rest of the population, there were 36 members of an Orthodox church (or about 1.37% of the population), there were 27 individuals (or about 1.03% of the population) who belonged to the Christian Catholic Church, and there were 38 individuals (or about 1.45% of the population) who belonged to another Christian church. There were 3 individuals (or about 0.11% of the population) who were Jewish, and 126 (or about 4.80% of the population) who were Islamic. There were 12 individuals who were Buddhist, 3 individuals who were Hindu and 5 individuals who belonged to another church. 315 (or about 12.00% of the population) belonged to no church, are agnostic or atheist, and 65 individuals (or about 2.48% of the population) did not answer the question.[8]
Education
In Subingen about 1,066 or (40.6%) of the population have completed non-mandatory upper secondary education, and 278 or (10.6%) have completed additional higher education (either university or a Fachhochschule). Of the 278 who completed tertiary schooling, 76.3% were Swiss men, 14.4% were Swiss women, 6.1% were non-Swiss men and 3.2% were non-Swiss women.[8]
During the 2010-2011 school year there were a total of 262 students in the Subingen school system. The education system in the Canton of Solothurn allows young children to attend two years of non-obligatory Kindergarten.[17] During that school year, there were 40 children in kindergarten. The canton's school system requires students to attend six years of primary school, with some of the children attending smaller, specialized classes. In the municipality there were 214 students in primary school and 8 students in the special, smaller classes. The secondary school program consists of three lower, obligatory years of schooling, followed by three to five years of optional, advanced schools. All the lower secondary students from Subingen attend their school in a neighboring municipality.[18]
As of 2000, there were 31 students in Subingen who came from another municipality, while 168 residents attended schools outside the municipality.[16]
References
- ↑ Arealstatistik Standard - Gemeindedaten nach 4 Hauptbereichen
- ↑ Swiss Federal Statistical Office - STAT-TAB, online database – Ständige und nichtständige Wohnbevölkerung nach institutionellen Gliederungen, Geburtsort und Staatsangehörigkeit (German) accessed 30 August 2016
- 1 2 Swiss Federal Statistical Office-Land Use Statistics 2009 data (German) accessed 25 March 2010
- ↑ Flags of the World.com accessed 15-April-2011
- ↑ Swiss Federal Statistical Office - STAT-TAB, online database – Ständige und nichtständige Wohnbevölkerung nach institutionellen Gliederungen, Geburtsort und Staatsangehörigkeit (German) accessed 30 August 2016
- 1 2 Swiss Federal Statistical Office - Superweb database - Gemeinde Statistics 1981-2008 (German) accessed 19 June 2010
- 1 2 3 4 5 6 Swiss Federal Statistical Office accessed 15-April-2011
- 1 2 3 4 5 6 STAT-TAB Datenwürfel für Thema 40.3 - 2000 (German) accessed 2 February 2011
- ↑ Canton of Solothurn Statistics - Wohnbevölkerung der Gemeinden nach Nationalität und Geschlecht (German) accessed 11 March 2011
- ↑ Canton of Solothurn Statistics - Wohnbevölkerung nach Gemeinden, Nationalität, Altersgruppen und Zivilstand, Total (Männer + Frauen) (German) accessed 11 March 2011
- 1 2 Federal Statistical Office STAT-TAB - Datenwürfel für Thema 09.2 - Gebäude und Wohnungen (German) accessed 28 January 2011
- ↑ Swiss Federal Statistical Office STAT-TAB Bevölkerungsentwicklung nach Region, 1850-2000 (German) accessed 29 January 2011
- ↑ "Kantonsliste A-Objekte:Solothurn" (PDF). KGS Inventar (in German). Federal Office of Civil Protection. 2009. Retrieved 12 July 2010.
- ↑ Swiss Federal Statistical Office, Nationalratswahlen 2007: Stärke der Parteien und Wahlbeteiligung, nach Gemeinden/Bezirk/Canton (German) accessed 28 May 2010
- ↑ Swiss Federal Statistical Office STAT-TAB Betriebszählung: Arbeitsstätten nach Gemeinde und NOGA 2008 (Abschnitte), Sektoren 1-3 (German) accessed 28 January 2011
- 1 2 Swiss Federal Statistical Office - Statweb (German) accessed 24 June 2010
- ↑ Canton of Solothurn - Education information (German) accessed 11 March 2011
- ↑ Canton of Solothurn - School statistics (German) accessed 13 March 2011
| Wikimedia Commons has media related to Subingen. |