Solar power in Thailand

Solar power in Thailand is targeted to reach 6,000 MW by 2036.[2] In 2013 installed photovoltaic capacity nearly doubled and reached 704 MW by the end of the year.[3] At the end of 2015, with a total capacity of 2,500-2,800 MW, Thailand has more solar power capacity than all the rest of Southeast Asia combined.[2]
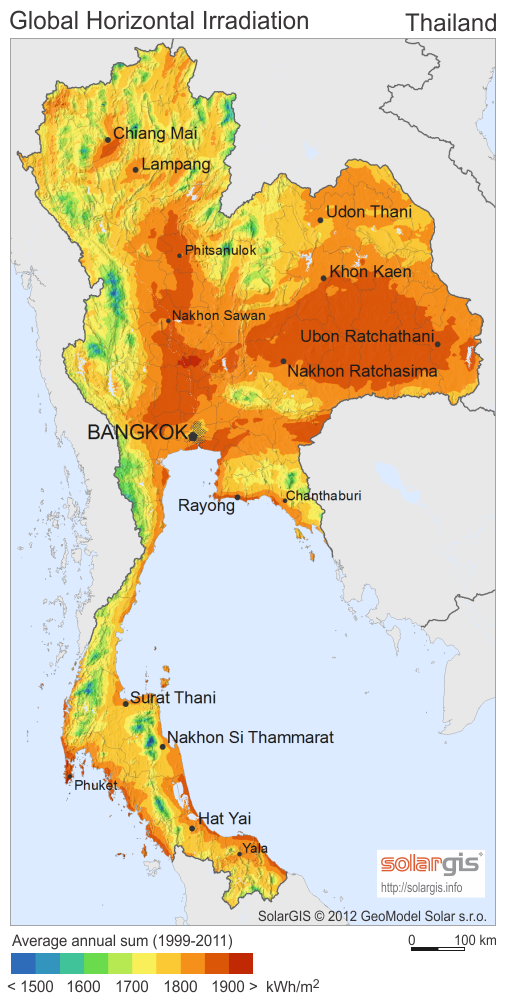
Thailand has great solar potential, especially the southern and northern parts of the northeastern region of Udon Thani Province and certain areas in the central region. Around 14.3% of the country has a daily solar exposure of around 19–20 MJ/m2/day, while another 50% of the country gains around 18–19 MJ/m2/day. In terms of solar potential, Thailand lags behind the US, but is ahead of Japan.[4]
The 84 MW Lopburi Solar Farm was completed in May 2013. German solar energy company Conergy signed a contract with Thailand's Siam Solar Energy to construct three solar plants of 10.5 MW each in addition to existing two solar plants that have been under construction since autumn 2012.[5]
Thailand's new power purchase scheme
In January 2015, Thailand's Energy Regulatory Commission (ERC) announced a new regulation for the purchase of electricity from ground-mounted solar projects, replacing the "adder" scheme with the "feed-in-tariff" (FiT) scheme. The regulation aims to revive the investment in renewable energy projects in Thailand after a quiet period in the renewable energy sector in 2014. There are over one hundred projects, with a total capacity of 1,000 MW, whose applications have not yet been accepted under the adder scheme and therefore are eligible for the feed-in-tariff scheme.[6]
Statistics
 Daily insolation in Bangkok with an average of 5.04 hours of sun per day.[7] |
| Year | Cumulative Capacity (MWp) |
Annual Installations (MWp) | ||||
|---|---|---|---|---|---|---|
| On-grid | Off-grid | Total | On-grid | Off-grid | Total | |
| 2005 | 1.77 | 22.11 | 23.88 | 0.01 | 13.04 | 13.05 |
| 2006 | 1.86 | 28.66 | 30.52 | 0.09 | 6.55 | 6.64 |
| 2007 | 3.61 | 28.90 | 32.51 | 1.74 | 0.24 | 1.98 |
| 2008 | 4.06 | 29.34 | 33.39 | 0.45 | 0.44 | 0.89 |
| 2009 | 13.67 | 29.49 | 43.17 | 9.62 | 0.16 | 9.77 |
| 2010 | 19.57 | 29.65 | 49.22 | 5.89 | 0.16 | 6.05 |
| 2011 | 212.80 | 29.88 | 242.68 | 193.23 | 0.23 | 193.46 |
| 2012 | 357.38 | 30.19 | 387.57 | 144.89 | 0.15 | 145.04 |
| 2013 | 794.07 | 29.73 | 823.80 | 436.69 | -0.45a | 436.24 |
| 2014 | 1,268.77 | 229.73 | 1,298.51 | 474.71 | 0 | 474.71 |
| 2015b | 1,299.62 | 230.03 | 1,329.65 | 30.85 | 0.29 | 31.15 |
| Source: IEA-PVPS, Annual Report 2015 (AR2015)[8] Notes:
| ||||||
See also
- Renewable energy
- Solar power
- Photovoltaics
- Solar power by country
- Photovoltaic system
- Photovoltaic power station
- Growth of photovoltaics
References
- ↑ "Global Horizontal Irradiation (GHI): Thailand". solargis. Retrieved 5 Mar 2015.
- 1 2 Jittapong, Khettiya (2015-07-12). "Thailand ignites solar power investment in Southeast Asia". Reuters. Reuters UK. Retrieved 2014-07-24.
- ↑ "Snapshot of Global PV 1992-2013" (PDF). 2nd Edition ISBN 978-3-906042-19-0. International Energy Agency - Photovoltaic Power Systems Programme. 2014. p. 8. Archived from the original on 5 April 2014.
- ↑ "Areas with solar power potential". Thailand Ministry of Energy, Department of Alternative Energy Development and Efficiency. Retrieved 5 Mar 2015.
- ↑ "Thailand turns to solar power". Investvine.com. 2013-02-25. Retrieved 2013-02-25.
- ↑ "Solar power in Thailand: new power purchase scheme creates investment opportunities". www.nortonrosefulbright.com. Retrieved 2015-09-23.
- ↑ "PV Watts". US National Renewable Energy Laboratory (NREL). Archived from the original on 23 October 2014. Retrieved 9 Jul 2012.
- ↑ IEA-PVPS, Annual Report 2015 (AR2015), p. 105, 27 May 2016
| Africa | |
|---|---|
| Asia | |
| Europe | |
| North America | |
| Oceania | |
| South America | |
| |