Sheffield Heeley (UK Parliament constituency)
Coordinates: 53°22′08″N 1°28′01″W / 53.369°N 1.467°W
| Sheffield Heeley | |
|---|---|
|
Borough constituency for the House of Commons | |
|
Boundary of Sheffield Heeley in South Yorkshire for the 2010 general election. | |
|
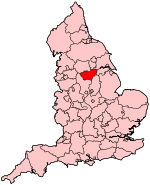
Location of South Yorkshire within England. | |
| County | South Yorkshire |
| Electorate | 66,432 (December 2010) |
| Current constituency | |
| Created | 1950 |
| Member of parliament | Louise Haigh (Labour Co-op) |
| Number of members | One |
| Created from | Sheffield Ecclesall |
| Overlaps | |
| European Parliament constituency | Yorkshire and the Humber |

Sheffield Heeley is a constituency[n 1] represented in the House of Commons of the UK Parliament since 2015 by Louise Haigh, a member of the Labour Party.[n 2]
History
This seat was created in 1950, largely replacing the former Sheffield Ecclesall constituency, its boundaries being significantly altered in 1955 with the abolition of Sheffield Neepsend. In the first five elections, up to but excluding 1966, the seat was won by a Conservative, Peter Roberts, it changed hands three times between 1966 and 1974.
Seeing a reverse-swing to that nationally, the 1979 election saw Sheffield Heeley move away from being a marginal Labour seat to a solid majority — in the seven elections since, only the first and the last have been fairly marginal, the others have suggested a safe seat. In the 2010 election the Liberal Democrat had more than a quarter of the vote, whereas the Conservative garnered 3% more votes than in 2005, on 17.3%.[n 3]
Boundaries
1950-1955: The County Borough of Sheffield wards of Heeley, Nether Edge, Norton, and Woodseats.
1955-1974: The County Borough of Sheffield wards of Heeley, Nether Edge, Norton, Sharrow, and Woodseats.
1974-1983: The County Borough of Sheffield wards of Beauchief, Gleadless, Heeley, and Intake.
1983-2010: The City of Sheffield wards of Beauchief, Heeley, Intake, Norton, and Park.
2010-present: The City of Sheffield wards of Arbourthorne, Beauchief and Greenhill, Gleadless Valley, Graves Park, and Richmond.
Constituency profile
This constituency has a moderate Labour majority and contains a mixture of urban areas, in 2010 the BNP unusually in Britain achieved more than the 5% deposit threshold share of the vote, however only 5.5% of the vote, a record in Sheffield.
The constituency consists of Census Output Areas a local government districts with: a working population whose income is marginally below the national average and that has close to average reliance upon social housing.[1] At the end of 2012 the unemployment rate in the constituency stood as 5.7% of the population claiming jobseekers allowance, compared to the regional average of 4.7%.[2] The district contributing to the seat has a medium 33% of its population without a car.[n 4] A medium 24.3% of the City's population are without qualifications, a high 15.8% of the population with level 3 qualifications and a medium 25.7% with level 4 qualifications or above. In terms of tenure a relatively low 58.3% of homes are owned outright or on a mortgage by occupants as at the 2011 census across the district.[3]
Members of Parliament
Elections

Elections in the 2010s
| Party | Candidate | Votes | % | ± | |
|---|---|---|---|---|---|
| Labour | Louise Haigh | 20,269 | 48.2 | +5.6 | |
| UKIP | Howard Denby | 7,315 | 17.4 | +13.7 | |
| Conservative | Stephen Castens | 6,792 | 16.2 | -1.2 | |
| Liberal Democrat | Simon Clement-Jones | 4,746 | 11.3 | -17.1 | |
| Green | Rita Wilcock | 2,566 | 6.1 | +3.7 | |
| TUSC | Alan Munro | 238 | 0.6 | +0.6 | |
| English Democrat | David Haslett | 122 | 0.3 | +0.3 | |
| Majority | 12,954 | 30.8 | |||
| Turnout | 42,048 | 60.7 | |||
| Labour Co-op hold | Swing | ||||
| Party | Candidate | Votes | % | ± | |
|---|---|---|---|---|---|
| Labour | Meg Munn | 17,409 | 42.6 | -11.5 | |
| Liberal Democrat | Simon Clement-Jones | 11,602 | 28.4 | +7.0 | |
| Conservative | Anne Crampton | 7,081 | 17.3 | +3.0 | |
| BNP | John Beatson | 2,260 | 5.5 | +2.1 | |
| UKIP | Charlotte Arnott | 1,530 | 3.7 | +1.4 | |
| Green | Gareth Roberts | 989 | 2.4 | -1.2 | |
| Majority | 5,807 | 14.2 | -19.5 | ||
| Turnout | 40,871 | 62.0 | +4.3 | ||
| Labour Co-op hold | Swing | -9.25 | |||
Elections in the 2000s
- General election of 2005
| Party | Candidate | Votes | % | ± | |
|---|---|---|---|---|---|
| Labour Co-op | Meg Munn | 18,405 | 53.98 | -2.99 | |
| Liberal Democrat | Colin Ross | 7,035 | 20.63 | -2.06 | |
| Conservative | Aster Crawshaw | 4,987 | 14.63 | +0.38 | |
| BNP | John Beatson | 1,314 | 3.85 | N/A | |
| Green | Rob Unwin | 1,312 | 3.85 | +1.58 | |
| UKIP | Mark Suter | 775 | 2.27 | +0.42 | |
| Socialist Alternative | Mark Dunnell | 265 | 0.78 | N/A | |
| Majority | 11,370 | 33.35 | |||
| Turnout | 34,093 | 57.06 | |||
| Labour Co-op hold | Swing | ||||
- General election of 2001
| Party | Candidate | Votes | % | ± | |
|---|---|---|---|---|---|
| Labour Co-op | Meg Munn | 19,452 | 57.0 | -3.7 | |
| Liberal Democrat | Dave Willis | 7,748 | 22.7 | +1.4 | |
| Conservative | Carolyn Abbott | 4,864 | 14.2 | -1.4 | |
| Green | Rob Unwin | 774 | 2.3 | N/A | |
| Socialist Labour | Brian Fischer | 667 | 2.0 | N/A | |
| UKIP | David Dunn | 634 | 1.9 | N/A | |
| Majority | 11,704 | 34.3 | |||
| Turnout | 34,139 | 55.1 | -9.9 | ||
| Labour Co-op hold | Swing | ||||
Elections in the 1990s
- General election of 1997
| Party | Candidate | Votes | % | ± | |
|---|---|---|---|---|---|
| Labour | Bill Michie | 26,274 | 60.7 | + 5.0 | |
| Liberal Democrat | Roger Davison | 9,196 | 21.3 | + 2.9 | |
| Conservative | John Harthman | 6,767 | 15.6 | - 10.3 | |
| Referendum | David Mawson | 1,029 | 2.4 | N/A | |
| Majority | 17,078 | 39.5 | + 9.8 | ||
| Turnout | 43,266 | 65.0 | - 5.9 | ||
| Labour hold | Swing | ||||
- General election of 1992
| Party | Candidate | Votes | % | ± | |
|---|---|---|---|---|---|
| Labour | Bill Michie | 28,005 | 55.7 | + 2.3 | |
| Conservative | David Beck | 13,051 | 25.9 | - 0.4 | |
| Liberal Democrat | Peter Moore | 9,247 | 18.4 | - 1.9 | |
| Majority | 14,954 | 29.7 | + 2.6 | ||
| Turnout | 70.9 | - 1.1 | |||
| Labour hold | Swing | ||||
Elections in the 1980s
- General election of 1987
| Party | Candidate | Votes | % | ± | |
|---|---|---|---|---|---|
| Labour | Bill Michie | 28,425 | 53.4 | + 7.6 | |
| Conservative | Nicholas Mearing-Smith | 13,985 | 26.3 | - 3.6 | |
| SDP–Liberal Alliance | Peter Moore | 10,811 | 20.3 | - 4.0 | |
| Majority | 14,440 | 27.1 | + 11.2 | ||
| Turnout | 72.0 | + 1.5 | |||
| Labour hold | Swing | ||||
- General election of 1983
| Party | Candidate | Votes | % | ± | |
|---|---|---|---|---|---|
| Labour | Bill Michie | 24,111 | 45.8 | - 4.0 | |
| Conservative | Sidney Cordle | 15,743 | 29.9 | - 10.2 | |
| SDP–Liberal Alliance | John Day | 12,813 | 24.3 | + 14.8 | |
| Majority | 8,368 | 15.9 | + 5.2 | ||
| Turnout | 70.5 | - 6.8 | |||
| Labour hold | Swing | ||||
Elections in the 1970s
- General election of 1979
| Party | Candidate | Votes | % | ± | |
|---|---|---|---|---|---|
| Labour | Frank Hooley | 24,618 | 49.8 | ||
| Conservative | Danny George | 19,845 | 40.1 | ||
| Liberal | Rodney Webb | 4,708 | 9.5 | ||
| National Front | P. K. Thorpe | 274 | 0.6 | ||
| Majority | 4,773 | 9.65 | |||
| Turnout | 77.3 | ||||
| Labour hold | Swing | ||||
- General election of October 1974
| Party | Candidate | Votes | % | ± | |
|---|---|---|---|---|---|
| Labour | Frank Hooley | 24,728 | 51.6 | ||
| Conservative | Alan Page | 15,322 | 32.0 | ||
| Liberal | Royden Fairfax | 7,151 | 14.9 | ||
| National Front | Peter Revell | 723 | 1.5 | ||
| Majority | 9,406 | 19.6 | |||
| Turnout | 73.5 | ||||
| Labour hold | Swing | ||||
- General election of February 1974
| Party | Candidate | Votes | % | ± | |
|---|---|---|---|---|---|
| Labour | Frank Hooley | 25,317 | 47.7 | ||
| Conservative | Robert Ingle | 18,732 | 35.3 | ||
| Liberal | Anthony Singleton | 9,061 | 17.0 | ||
| Majority | 6,585 | 12.4 | |||
| Turnout | 82.0 | ||||
| Labour gain from Conservative | Swing | ||||
- General election of 1970
| Party | Candidate | Votes | % | ± | |
|---|---|---|---|---|---|
| Conservative | John Deane Spence | 27,950 | 47.0 | ||
| Labour | Frank Hooley | 27,237 | 45.9 | ||
| Liberal | Anthony Singleton | 4,220 | 7.1 | ||
| Majority | 713 | 1.2 | |||
| Turnout | 73.4 | ||||
| Conservative gain from Labour | Swing | ||||
Elections in the 1960s
- General election of 1966
| Party | Candidate | Votes | % | ± | |
|---|---|---|---|---|---|
| Labour | Frank Hooley | 31,996 | 54.0 | ||
| Conservative | John Deane Spence | 27,267 | 46.0 | ||
| Majority | 4,729 | 8.0 | |||
| Turnout | 78.7 | ||||
| Labour gain from Conservative | Swing | ||||
- General election of 1964
| Party | Candidate | Votes | % | ± | |
|---|---|---|---|---|---|
| Conservative | Peter Roberts | 29,587 | 51.5 | ||
| Labour | Frank Hooley | 27,883 | 48.5 | ||
| Majority | 1,704 | 3.0 | |||
| Turnout | 76.0 | ||||
| Conservative hold | Swing | ||||
Elections in the 1950s
- General election of 1959
| Party | Candidate | Votes | % | ± | |
|---|---|---|---|---|---|
| Conservative | Peter Roberts | 33,236 | 59.0 | ||
| Labour | Joan Mellors | 23,109 | 41.0 | ||
| Majority | 10,127 | 18.0 | |||
| Turnout | 77.6 | ||||
| Conservative hold | Swing | ||||
- General election of 1955
| Party | Candidate | Votes | % | ± | |
|---|---|---|---|---|---|
| Conservative | Peter Roberts | 30,798 | 60.9 | ||
| Labour | John Sewell | 19,747 | 39.1 | ||
| Majority | 11,051 | 21.8 | |||
| Turnout | 77.0 | ||||
| Conservative hold | Swing | ||||
- General election of 1951
| Party | Candidate | Votes | % | ± | |
|---|---|---|---|---|---|
| Conservative | Peter Roberts | 27,776 | 61.0 | ||
| Labour | Arnold Jennings | 17,729 | 39.0 | ||
| Majority | 10,047 | 22.0 | |||
| Turnout | 84.6 | ||||
| Conservative hold | Swing | ||||
- General election of 1950
| Party | Candidate | Votes | % | ± | |
|---|---|---|---|---|---|
| Conservative | Peter Roberts | 26,560 | 56.3 | ||
| Labour | Arnold Jennings | 17,856 | 37.8 | ||
| Liberal | Phillip Beckerlegge | 2,779 | 5.9 | ||
| Majority | 8,704 | 18.5 | |||
| Turnout | 88.1 | ||||
| New creation: Conservative gain. | Swing | N/A | |||
See also
Notes and references
- Notes
- ↑ A borough constituency (for the purposes of election expenses and type of returning officer)
- ↑ As with all constituencies, the constituency elects one Member of Parliament (MP) by the first past the post system of election at least every five years.
- ↑ The 8th different candidate, one for each election, since 1979.
- ↑ This falls within the centrally coloured banding for metropolitan areas
- References
- ↑ 2001 Census
- ↑ Unemployment claimants by constituency The Guardian
- ↑ 2011 census interactive maps
- ↑ "Election Data 2015". Electoral Calculus. Archived from the original on 17 October 2015. Retrieved 17 October 2015.
- ↑ "Sheffield Heeley". BBC News. Retrieved 14 May 2015.
- ↑ "Election Data 2010". Electoral Calculus. Archived from the original on 17 October 2015. Retrieved 17 October 2015.
- ↑ "Election Data 2005". Electoral Calculus. Archived from the original on 15 October 2011. Retrieved 18 October 2015.
- ↑ "Election Data 2001". Electoral Calculus. Archived from the original on 15 October 2011. Retrieved 18 October 2015.
- ↑ "Election Data 1997". Electoral Calculus. Archived from the original on 15 October 2011. Retrieved 18 October 2015.
- ↑ "Election Data 1992". Electoral Calculus. Archived from the original on 15 October 2011. Retrieved 18 October 2015.
- ↑ "Election Data 1987". Electoral Calculus. Archived from the original on 15 October 2011. Retrieved 18 October 2015.
- ↑ "Election Data 1983". Electoral Calculus. Archived from the original on 15 October 2011. Retrieved 18 October 2015.
External links
- BBC Election 2005
- BBC Vote 2001
- Guardian Unlimited Politics (Election results from 1992 to the present) The Guardian
- Leigh Rayment's Historical List of MPs – Constituencies beginning with "H" (part 2)
- http://www.psr.keele.ac.uk/ (Election results from 1951 to the present)
- F. W. S. Craig, British Parliamentary Election Results 1918 - 1949
- F. W. S. Craig, British Parliamentary Election Results 1950 - 1970
- Sheffield General Election Results 1945 - 2001, Sheffield City Council