See District, Fribourg
| Bezirk See / District du Lac Seebezirk District du Lac | ||
|---|---|---|
| District | ||
| ||
 | ||
| Country |
| |
| Canton |
| |
| Capital | Murten/Morat | |
| Area | ||
| • Total | 142.1 km2 (54.9 sq mi) | |
| Population (31 December 2015) | ||
| • Total | 35,313 | |
| • Density | 250/km2 (640/sq mi) | |
| Time zone | CET (UTC+1) | |
| • Summer (DST) | CEST (UTC+2) | |
| Municipalities | 20 | |
| Website | See | |

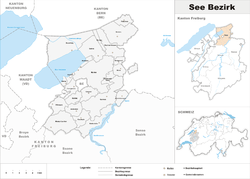
See or Lac District (German: Seebezirk, French: District du Lac) is one of the seven districts of the canton of Fribourg in Switzerland. Lying to the north of the canton, the district is bilingual (French/German). Its territory enclaves the two Bernese municipalities of Münchenwiler and Clavaleyres, while its own village of Wallenbuch (now part of Gurmels) is exclaved within Berne. It has a population of 35,313 (as of 31 December 2015).
Municipalities
See/Lac consists of the following twenty-six municipalities:
| Coat of Arms | Municipality | Population (31 December 2015)[1] |
Area in km²[2] |
|---|---|---|---|
| | Barberêche | 527 | 9.17 |
| | Courgevaux | 1,428 | 3.36 |
| | Courtepin | 3,681 | 4.06 |
| | Cressier | 932 | 4.17 |
| | Fräschels | 460 | 3.14 |
| | Galmiz | 645 | 9.06 |
| | Gempenach | 307 | 1.69 |
| | Greng | 177 | 0.97 |
| | Gurmels | 4,142 | 17.29 |
| | Kerzers | 4,848 | 12.23 |
| | Kleinbösingen | 602 | 3.01 |
| | Meyriez | 592 | 0.34 |
| | Misery-Courtion | 1,835 | 11.41 |
| | Mont-Vully | 3,495 | 17.53 |
| | Muntelier | 955 | 1.13 |
| | Murten/Morat | 8,120 | 17.41 |
| | Ried bei Kerzers | 1,095 | 7.59 |
| | Ulmiz | 414 | 2.83 |
| | Villarepos | 611 | 4.76 |
| | Wallenried | 447 | 3.86 |
| Total | 35,313 | 142.10 | |
Coat of arms
The blazon of the district coat of arms is Argent, a Lion rampant Gules crowned and armed Or on Coupeaux Vert.[3]
Demographics
See/Lac has a population (as of December 2015) of 35,313.[4]. Two thirds of the population (as of 2000) speak German (67.1%) as their first language, French is the second most common (24.9%), there are (1.1%) who speak Italian and (0.1%) who speak Romansh. [5]
As of 2008, the population was 49.9% male and 50.1% female. The population was made up of 13,164 Swiss men (40.6% of the population) and 3,028 (9.3%) non-Swiss men. There were 13,623 Swiss women (42.0%) and 2,613 (8.1%) non-Swiss women.[6] Of the population in the district, 12,800 or about 28.6% were born in See and lived there in 2000. There were 8,936 or 20.0% who were born in the same canton, while 13,299 or 29.8% were born somewhere else in Switzerland, and 8,415 or 18.8% were born outside of Switzerland.[5]
As of 2000, there were 19,076 people who were single and never married in the district. There were 21,312 married individuals, 2,098 widows or widowers and 2,203 individuals who are divorced.[5]
There were 5,569 households that consist of only one person and 1,466 households with five or more people.
The historical population is given in the following chart:[7]

Mergers and name changes
- On 15 February 1974 the former municipality of Coussiberlé merged into Courlevon.
- On 1 January 1975 the former municipality of Burg bei Murten merged into Murten/Morat.
- On 24 May 1977 the municipality of Vully-le-Haut changed its name to Haut-Vully, and Vully-le-Bas changed its name to Bas-Vully.
- On 1 January 1978 the former municipalities of Grossgurmels and Monterschu merged to form the new municipality of Gurmels. On 1 January 1978 Grossguschelmuth and Kleinguschelmuth merged to form the new municipality of Guschelmuth.
- On 1 January 1983 the former municipality of Chandossel merged into Villarepos.
- On 1 January 1991 the former municipality of Altavilla merged into Murten.
- On 1 January 1997 the former municipalities of Courtion, Cormérod, Cournillens and Misery merged to form the new municipality of Misery-Courtion.
On 1 January 2000 the former municipalities of Corsalettes merged into Grolley, and the former municipality of Kleingurmels merged into Gurmels.
- On 1 January 2003 the former municipalities of Wallenbuch, Liebistorf and Guschelmuth merged into Gurmels, and the former municipality of Courtaman merged into Courtepin.
- On 1 January 2005 the former municipality of Cordast merged into Gurmels.
- On 1 January 2006 the former municipality of Agriswil merged into Ried bei Kerzers.[8]
- On 1 January 2013 the former municipality of Büchslen merged into the municipality of Murten/Morat.[9]
- On 1 January 2016 the former municipalities of Bas-Vully and Haut-Vully merged into the new municipality of Mont-Vully. The former municipalities of Courlevon, Jeuss, Lurtigen and Salvenach merged into the municipality of Murten/Morat
Politics
In the 2011 federal election the most popular party was the SVP which received 24.4% of the vote. The next three most popular parties were the SPS (19.7%), the FDP (15.1%) and the CVP (14.2%).[10]
The SVP received about the same percentage of the vote as they did in the 2007 Federal election (28.4% in 2007 vs 24.4% in 2011). The SPS moved from third in 2007 (with 17.9%) to second in 2011, the FDP moved from second in 2007 (with 18.8%) to third and the CVP retained about the same popularity (16.4% in 2007). A total of 10,869 votes were cast in this election, of which 138 or 1.3% were invalid.[11]
Religion
From the 2000 census, 26,439 or 59.2% were Roman Catholic, while 9,847 or 22.0% belonged to the Swiss Reformed Church. Of the rest of the population, there were 920 members of an Orthodox church (or about 2.06% of the population), there were 23 individuals (or about 0.05% of the population) who belonged to the Christian Catholic Church, and there were 1,477 individuals (or about 3.31% of the population) who belonged to another Christian church. There were 15 individuals (or about 0.03% of the population) who were Jewish, and 1,936 (or about 4.33% of the population) who were Islamic. There were 311 individuals who were Buddhist, 161 individuals who were Hindu and 30 individuals who belonged to another church. 2,986 (or about 6.68% of the population) belonged to no church, are agnostic or atheist, and 1,260 individuals (or about 2.82% of the population) did not answer the question.[5]
Education
In See about 16,916 or (37.9%) of the population have completed non-mandatory upper secondary education, and 5,390 or (12.1%) have completed additional higher education (either university or a Fachhochschule). Of the 5,390 who completed tertiary schooling, 67.6% were Swiss men, 18.9% were Swiss women, 8.7% were non-Swiss men and 4.9% were non-Swiss women.[5]
The Canton of Fribourg school system provides one year of non-obligatory Kindergarten, followed by six years of Primary school. This is followed by three years of obligatory lower Secondary school where the students are separated according to ability and aptitude. Following the lower Secondary students may attend a three or four year optional upper Secondary school. The upper Secondary school is divided into collège (university preparatory) and vocational programmes. After they finish the upper Secondary programme, students may choose to attend a Tertiary school or continue their apprenticeship.[12]
During the 2010-11 school year, there were a total of 4,148 students attending 222 classes in See. A total of 5,462 students from the district attended any school, either in the district or outside of it. There were 34 kindergarten classes with a total of 655 students in the district. The district had 116 primary classes and 2,299 students. During the same year, there were 63 lower secondary classes with a total of 1,114 students. There were 2 upper Secondary classes, with 35 upper Secondary students. The district had 4 special Tertiary classes, with 45 specialized Tertiary students.[6]
References
- ↑ Swiss Federal Statistical Office - STAT-TAB, online database – Ständige und nichtständige Wohnbevölkerung nach institutionellen Gliederungen, Geburtsort und Staatsangehörigkeit (German) accessed 30 August 2016
- ↑ Arealstatistik Standard - Gemeindedaten nach 4 Hauptbereichen
- ↑ Flags of the World.com accessed 13-December-2011
- ↑ Swiss Federal Statistical Office - STAT-TAB, online database – Ständige und nichtständige Wohnbevölkerung nach institutionellen Gliederungen, Geburtsort und Staatsangehörigkeit (German) accessed 30 August 2016
- 1 2 3 4 5 STAT-TAB Datenwürfel für Thema 40.3 - 2000 (German) accessed 2 February 2011
- 1 2 Canton of Fribourg Statistics (German) accessed 3 November 2011
- ↑ Swiss Federal Statistical Office STAT-TAB Bevölkerungsentwicklung nach Region, 1850-2000 (German) accessed 29 January 2011
- ↑ Nomenklaturen – Amtliches Gemeindeverzeichnis der Schweiz (German) accessed 4 April 2011
- ↑ Nomenklaturen – Amtliches Gemeindeverzeichnis der Schweiz (German) accessed 9 February 2013
- ↑ Canton of Fribourg National Council Election of 23 October 2011 Statistics (German) (French) accessed 3 November 2011
- ↑ Swiss Federal Statistical Office, Nationalratswahlen 2007: Stärke der Parteien und Wahlbeteiligung, nach Gemeinden/Bezirk/Canton (German) accessed 28 May 2010
- ↑ Chart of the education system in Canton Fribourg (German)
Coordinates: 46°54′36″N 7°08′27″E / 46.91000°N 7.14083°E