Preston City Council election, 2008
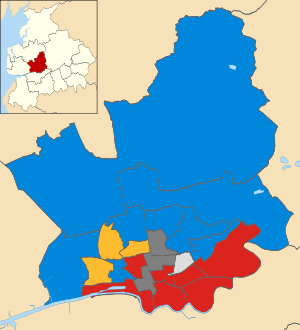
Elections to Preston City Council took place on 1 May 2008.
Preston council is elected "in thirds" which means one councillor from each three-member ward, and councillors from selected two-member wards, are elected each year, with one year free from all elections to ensure all councillors serve a full term.
Due to the "in thirds" system, these election results are compared to the Preston Council election, 2004.
Summary
In this summary, "seats" represent the number of wards each party are defending. In two cases this year, the winning candidate in 2004 has since defected to another party, but for comparison the defending party is that from 2004.
| Preston Local Election Result 2008 | ||||||||||
|---|---|---|---|---|---|---|---|---|---|---|
| Party | Seats | Gains | Losses | Net gain/loss | Seats % | Votes % | Votes | +/− | ||
| Conservative | 7 | 2 | 1 | 1 | 42 (8/19) | 42.3 | 12,423 | -2,331 | ||
| Labour | 7 | 1 | 1 | +0 | 37 (7/19) | 28.9 | 8,503 | -1,942 | ||
| Liberal Democrat | 4 | 0 | 1 | -1 | 16 (3/19) | 24.8 | 7,297 | -1,884 | ||
| Left List | 0 | 0 | 0 | 0 | 0 | 0.6 | 99 | n/a | ||
| Green | 0 | 0 | 0 | 0 | 0 | 0.4 | 75 | n/a | ||
| England First | 0 | 0 | 0 | 0 | 0 | 0.6 | 109 | -259 | ||
| Independent | 1 | 0 | 0 | 0 | 5 (1/19) | 3.0 | 891 | -30 | ||
| No label | 0 | 0 | 0 | 0 | 0 | 3.2 | 945 | n/a | ||
In this summary box, The Left List are a party split from RESPECT - The Unity Coalition. The device "No Label" represents those candidates with no party description according to the official candidates list on the website of Preston City Council.
Ashton
Won in corresponding 2004 elections by Conservative Party, majority 51
| Party | Candidate | Votes | % | ± | |
|---|---|---|---|---|---|
| Conservative | Keith Sedgewick | 657 | 54.7 | +12.8 | |
| Labour | Phil Crowe | 544 | 45.3 | +6.9 | |
| Majority | 113 | +62 | |||
| Turnout | 1,201 | 37% | -6 | ||
Brookfield
Won in corresponding 2004 elections by Labour Party, majority 265
| Party | Candidate | Votes | % | ± | |
|---|---|---|---|---|---|
| Conservative | Robert Cartwright | 788 | 53.1 | +25.4 | |
| Labour | Jonathan Saksena | 697 | 46.9 | +5.8 | |
| Majority | 91 | ||||
| Turnout | 1,485 | 28% | -9 | ||
| Conservative gain from Labour | Swing | +10.0 | |||
Cadley
Won in corresponding 2004 elections by Liberal Democrats, majority 329
| Party | Candidate | Votes | % | ± | |
|---|---|---|---|---|---|
| Liberal Democrat | Michael Onyon | 1,010 | 57.1 | +5.0 | |
| Conservative | Steven Johnston | 624 | 35.3 | -1.0 | |
| Labour | William Burke | 136 | 7.7 | -3.9 | |
| Majority | 386 | +57 | |||
| Turnout | 1,770 | 47% | -7 | ||
Deepdale
Won in corresponding 2004 elections by independent, majority 221
| Party | Candidate | Votes | % | ± | |
|---|---|---|---|---|---|
| Independent | Terry Cartwright | 891 | 57.4 | +11.3 | |
| Labour | Anis Faruki | 543 | 35.0 | +24.0 | |
| Conservative | Sheila Heys | 118 | 7.6 | -0.3 | |
| Majority | 348 | +127 | |||
| Turnout | 1,552 | 40% | -12 | ||
Fishwick
Won in corresponding 2004 elections by Conservative Party, majority 41. The winning candidate subsequently defected to the Liberal Democrats (and switched back to the Conservatives after losing the 2008 election). The result in 2008 will be based on the Conservative "defence", as is normal practice when comparing election results.
| Party | Candidate | Votes | % | ± | |
|---|---|---|---|---|---|
| Labour | Martyn Rawlinson | 608 | 48.1 | +13.2 | |
| Liberal Democrat | Sharon Riley | 550 | 43.5 | N/A | |
| No label | Peter Agland | 107 | 8.4 | N/A | |
| Majority | 58 | ||||
| Turnout | 1,265 | 34% | -4 | ||
| Labour gain from Conservative | Swing | ||||
Garrison
Won in corresponding 2004 elections by Conservative Party, majority 650
| Party | Candidate | Votes | % | ± | |
|---|---|---|---|---|---|
| Conservative | Stuart Greenhalgh | 1,207 | 66.8 | +13.3 | |
| Labour | Bert Williams | 324 | 17.9 | -3.4 | |
| Liberal Democrat | Stephen Wilkinson | 276 | 15.3 | -9.9 | |
| Majority | 883 | +233 | |||
| Turnout | 1,807 | 33% | -12 | ||
Greyfrairs
Won in corresponding 2004 elections by Conservative Party, majority 1,142
| Party | Candidate | Votes | % | ± | |
|---|---|---|---|---|---|
| Conservative | Geoff Driver | 1,678 | 71.3 | +8.7 | |
| Liberal Democrat | John Porter | 441 | 18.7 | -7.2 | |
| Labour | Alan Woods | 236 | 10.0 | -1.1 | |
| Majority | 1,237 | +95 | |||
| Turnout | 2,355 | ||||
Ingol
Won in corresponding 2004 elections by Liberal Democrats, majority 380. The winning candidate subsequently defected to the Conservative Party. The result in 2008 will be based on the Liberal Democrat "defence", as is normal practice when comparing election results.
| Party | Candidate | Votes | % | ± | |
|---|---|---|---|---|---|
| Liberal Democrat | Pauline Brown | 838 | 48.9 | +1.2 | |
| Conservative | June Dodd | 684 | 39.9 | +9.3 | |
| Labour | Shahzad Malik | 191 | 11.2 | -10.5 | |
| Majority | 154 | -226 | |||
| Turnout | 1,713 | ||||
Larches
Won in corresponding 2004 elections by Liberal Democrats, majority 137
| Party | Candidate | Votes | % | ± | |
|---|---|---|---|---|---|
| Liberal Democrat | Danny Gallagher | 1,011 | 61.7 | +20.6 | |
| Labour | Drew Gale | 627 | 38.3 | +3.4 | |
| Majority | 384 | +247 | |||
| Turnout | 1,638 | ||||
Lea
Won in corresponding 2004 elections by Liberal Democrats, majority 409
| Party | Candidate | Votes | % | ± | |
|---|---|---|---|---|---|
| Conservative | Trevor Hart | 892 | 48.6 | +15.6 | |
| Liberal Democrat | Julie Voges | 804 | 43.7 | -9.3 | |
| Labour | Dave Wilson | 141 | 7.7 | -6.2 | |
| Majority | 88 | - | |||
| Turnout | 1,837 | ||||
| Conservative gain from Liberal Democrat | Swing | ||||
Rural East
Won in corresponding 2004 elections by Conservative Party, majority 828
| Party | Candidate | Votes | % | ± | |
|---|---|---|---|---|---|
| Conservative | Thomas Davies | 1,019 | 73.9 | +6.1 | |
| Liberal Democrat | Liz Richardson | 234 | 17.0 | -2.1 | |
| Labour | Pauline Jackson | 126 | 9.1 | -4.0 | |
| Majority | 785 | -43 | |||
| Turnout | 1,379 | 45% | -10% | ||
Rural North
Won in corresponding 2004 elections by Conservative Party, majority 1,711
| Party | Candidate | Votes | % | ± | |
|---|---|---|---|---|---|
| Conservative | Anthony Gornall | 1,894 | 81.8 | +6.5 | |
| Liberal Democrat | Chris Richardson | 266 | 11.5 | -3.8 | |
| Labour | Derek Barton | 156 | 6.7 | -2.7 | |
| Majority | 1,628 | -40 | |||
| Turnout | 2,316 | 48% | -4% | ||
Ribbleton
Won in corresponding 2004 elections by Labour Party, majority 631
| Party | Candidate | Votes | % | ± | |
|---|---|---|---|---|---|
| Labour | Nicholas Pomfret | 735 | 57.0 | -2.3 | |
| Conservative | Christine Sharp | 354 | 27.7 | +5.2 | |
| Liberal Democrat | Rebecca Finch | 200 | 15.3 | -2.9 | |
| Majority | 381 | -250 | |||
| Turnout | 23% | -8 | |||
Riversway
Won in corresponding 2004 elections by Labour Party, majority 185
| Party | Candidate | Votes | % | ± | |
|---|---|---|---|---|---|
| Labour | Jack Davenport | 569 | 41.9 | +7.1 | |
| Liberal Democrat | John Potter | 318 | 23.4 | +0.6 | |
| Conservative | Ronald Smith | 187 | 13.8 | -4.6 | |
| England First | Mark Cotterill | 109 | 8.0 | N/A | |
| Left List | Elaine Abbot | 99 | 7.3 | N/A | |
| Green | Kizzi Murtagh | 75 | 5.5 | N/A | |
| Majority | 251 | ||||
| Turnout | 1,357 | ||||
Sharoe Green
Won in corresponding 2004 elections by Conservative Party, majority 639
| Party | Candidate | Votes | % | ± | |
|---|---|---|---|---|---|
| Conservative | Terence Thompson | 1,178 | 62.5 | +9.9 | |
| Liberal Democrat | Fiona Wren | 391 | 20.7 | -6.3 | |
| Labour | Terry Mattinson | 316 | 16.8 | -3.6 | |
| Majority | 787 | +148 | |||
| Turnout | 1,885 | 37% | -12 | ||
St George's
Won in corresponding 2004 elections by Labour Party, majority 185
| Party | Candidate | Votes | % | ± | |
|---|---|---|---|---|---|
| Labour Co-op | James Hull | 415 | 52.1 | +7.0 | |
| Conservative | Hussain Mulla | 242 | 30.4 | +2.8 | |
| Liberal Democrat | Tracy Singleton | 140 | 17.5 | n/a | |
| Majority | 173 | -12 | |||
| Turnout | 797 | 25% | -8 | ||
St Matthew's
Won in corresponding 2004 elections by Labour Party, majority 199
| Party | Candidate | Votes | % | ± | |
|---|---|---|---|---|---|
| Labour Co-op | Veronica Afrin | 780 | 63.9 | +18.7 | |
| Conservative | Julian Sedgewick | 201 | 16.5 | -4.5 | |
| Liberal Democrat | Liam Pennington | 179 | 14.7 | n/a | |
| No label | Danielle Field | 61 | 5.0 | n/a | |
| Majority | 579 | +380 | |||
| Turnout | 1,221 | 24% | -12 | ||
Town Centre
Won in corresponding 2004 elections by Labour Party, majority 142
| Party | Candidate | Votes | % | ± | |
|---|---|---|---|---|---|
| Labour | Salim Desai | 851 | 40.9 | +1.0 | |
| No label | Mukhtar Master | 777 | 37.3 | N/A | |
| Conservative | Alun Roberts | 268 | 12.9 | +1.4 | |
| Liberal Democrat | Jenny Buxton | 186 | 8.9 | -4.9 | |
| Majority | 74 | -68 | |||
| Turnout | |||||
Tulketh
Won in corresponding 2004 elections by Labour Party, majority 49
Held by Labour in 2008 by-election, majority over Liberal Democrats of 23.
| Party | Candidate | Votes | % | ± | |
|---|---|---|---|---|---|
| Labour Co-op | Matthew Brown | 507 | 36.4 | -14.9 | |
| Liberal Democrat | Rick Seymour | 453 | 32.5 | n/a | |
| Conservative | Paul Balshaw | 432 | 31.0 | -17.7 | |
| Majority | 54 | +5 | |||
| Turnout | 1,392 | 26% | -10 | ||
References
| County Council | |
|---|---|
| Blackburn with Darwen | |
| Blackpool | |
| Burnley | |
| Chorley | |
| Fylde | |
| Hyndburn | |
| Lancaster | |
| Pendle | |
| Preston | |
| Ribble Valley |
|
| Rossendale | |
| South Ribble | |
| West Lancashire | |
| Wyre | |
| |