Oetwil an der Limmat
| Ötwil an der Limmat | ||
|---|---|---|
 | ||
| ||
 Ötwil an der Limmat | ||
|
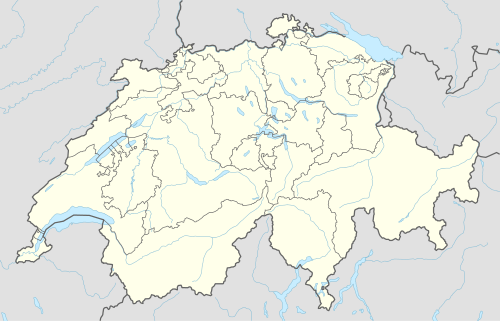
Location of Ötwil an der Limmat  | ||
| Coordinates: 47°26′N 8°24′E / 47.433°N 8.400°ECoordinates: 47°26′N 8°24′E / 47.433°N 8.400°E | ||
| Country | Switzerland | |
| Canton | Zurich | |
| District | Dietikon | |
| Area[1] | ||
| • Total | 2.76 km2 (1.07 sq mi) | |
| Elevation | 404 m (1,325 ft) | |
| Population (Dec 2015[2]) | ||
| • Total | 2,363 | |
| • Density | 860/km2 (2,200/sq mi) | |
| Postal code | 8955 | |
| SFOS number | 0246 | |
| Surrounded by | Dällikon, Dänikon, Dietikon, Geroldswil, Hüttikon, Spreitenbach (AG), Weiningen, Würenlos (AG) | |
| Website |
www SFSO statistics | |

Oetwil an der Limmat is a municipality in the district of Dietikon in the canton of Zürich in Switzerland, located in the Limmat Valley (German: Limmattal).
History
Oetwil an der Limmat is first mentioned around 850 as Otenwilare.[3]
Geography

Oetwil an der Limmat has an area of 2.8 km2 (1.1 sq mi). Of this area, 36.5% is used for agricultural purposes, while 39% is forested. Of the rest of the land, 20.6% is settled (buildings or roads) and the remainder (4%) is non-productive (rivers, glaciers or mountains).[4] In 1996 housing and buildings made up 15.9% of the total area, while transportation infrastructure made up the rest (4.3%).[5] Of the total unproductive area, water (streams and lakes) made up 3.3% of the area. As of 2007 19% of the total municipal area was undergoing some type of construction.[5]
The municipality is located on the right side of the Limmattal on the border with the Canton of Aargau.
Demographics
Oetwil an der Limmat has a population (as of 31 December 2015) of 2,363.[2] As of 2007, 12.4% of the population was made up of foreign nationals. As of 2008 the gender distribution of the population was 50.8% male and 49.2% female. Over the last 10 years the population has grown at a rate of 5.7%. Most of the population (as of 2000) speaks German (91.5%), with French being second most common ( 1.9%) and Italian being third ( 1.4%).
In the 2007 election the most popular party was the SVP which received 46.7% of the vote. The next three most popular parties were the FDP (19.7%), the SPS (11.4%) and the CVP (9.1%).
The age distribution of the population (as of 2000) is children and teenagers (0–19 years old) make up 18.3% of the population, while adults (20–64 years old) make up 70.9% and seniors (over 64 years old) make up 10.8%. In Oetwil an der Limmat about 84.6% of the population (between age 25-64) have completed either non-mandatory upper secondary education or additional higher education (either university or a Fachhochschule). There are 1000 households in Oetwil an der Limmat.[5]
Oetwil an der Limmat has an unemployment rate of 2.39%. As of 2005, there were 12 people employed in the primary economic sector and about 6 businesses involved in this sector. 81 people are employed in the secondary sector and there are 22 businesses in this sector. 170 people are employed in the tertiary sector, with 57 businesses in this sector.[4] As of 2007 42.2% of the working population were employed full-time, and 57.8% were employed part-time.[5]
As of 2008 there were 1198 Catholics and 1590 Protestants in Oetwil an der Limmat. In the 2000 census, religion was broken down into several smaller categories. From the 2000 census, 43.2% were some type of Protestant, with 40.4% belonging to the Swiss Reformed Church and 2.8% belonging to other Protestant churches. 27.7% of the population were Catholic. Of the rest of the population, 0% were Muslim, 12.4% belonged to another religion (not listed), 4.5% did not give a religion, and 11.2% were atheist or agnostic.[5]
| Historical population | ||||||||||||||||||||||||||||
|---|---|---|---|---|---|---|---|---|---|---|---|---|---|---|---|---|---|---|---|---|---|---|---|---|---|---|---|---|
|
| |||||||||||||||||||||||||||
| Source: [3] | ||||||||||||||||||||||||||||
References
- ↑ Arealstatistik Standard - Gemeindedaten nach 4 Hauptbereichen
- 1 2 Canton of Zurich Statistical Office (German) accessed 27 April 2016
- 1 2 Oetwil an der Limmat in German, French and Italian in the online Historical Dictionary of Switzerland.
- 1 2 Swiss Federal Statistical Office accessed 05-Aug-2009
- 1 2 3 4 5 Statistics Zurich (German) accessed 4 August 2009
External links
| Wikimedia Commons has media related to Oetwil an der Limmat. |
- Official website (German)