Oberwil, Basel-Landschaft
| Oberwil | ||
|---|---|---|
 | ||
| ||
 Oberwil | ||
|
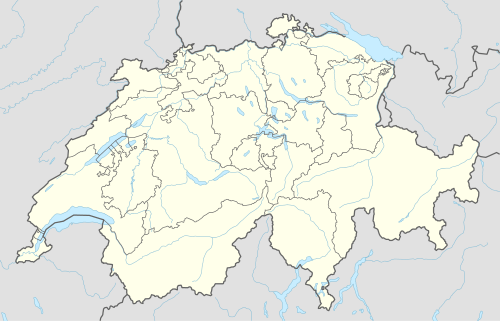
Location of Oberwil  | ||
| Coordinates: 47°31′N 7°33′E / 47.517°N 7.550°ECoordinates: 47°31′N 7°33′E / 47.517°N 7.550°E | ||
| Country | Switzerland | |
| Canton | Basel-Landschaft | |
| District | Arlesheim | |
| Area[1] | ||
| • Total | 7.88 km2 (3.04 sq mi) | |
| Elevation | 316 m (1,037 ft) | |
| Population (Mar 2016[2]) | ||
| • Total | 11,167 | |
| • Density | 1,400/km2 (3,700/sq mi) | |
| Postal code | 4104 | |
| SFOS number | 2771 | |
| Surrounded by | Allschwil, Biel-Benken, Binningen, Bottmingen, Neuwiller (FR-68), Reinach, Therwil | |
| Twin towns | Aschau im Zillertal (Austria) | |
| Website |
www SFSO statistics | |

Oberwil is a municipality in the district of Arlesheim in the canton of Basel-Country in Switzerland.
History
Oberwil is first mentioned around 1102-03 as Oberuuilre.[3]
Geography
Oberwil has an area, as of 2009, of 7.88 square kilometers (3.04 sq mi). Of this area, 3.47 km2 (1.34 sq mi) or 44.0% is used for agricultural purposes, while 1.54 km2 (0.59 sq mi) or 19.5% is forested. Of the rest of the land, 2.82 km2 (1.09 sq mi) or 35.8% is settled (buildings or roads), 0.03 km2 (7.4 acres) or 0.4% is either rivers or lakes and 0.02 km2 (4.9 acres) or 0.3% is unproductive land.[4]
Of the built up area, industrial buildings made up 1.6% of the total area while housing and buildings made up 21.7% and transportation infrastructure made up 7.4%. Power and water infrastructure as well as other special developed areas made up 1.8% of the area while parks, green belts and sports fields made up 3.3%. Out of the forested land, 17.8% of the total land area is heavily forested and 1.8% is covered with orchards or small clusters of trees. Of the agricultural land, 33.0% is used for growing crops and 8.0% is pastures, while 3.0% is used for orchards or vine crops. All the water in the municipality is flowing water.[4]
The municipality is located in the Arlesheim district, in the middle Leimen valley.
Coat of arms
The blazon of the municipal coat of arms is Gules, a Pallet wavy Argent, in dexter a Sword and in sinister a Key of the same.[5]
Demographics


Oberwil has a population (as of March 2016) of 11,167.[2] As of 2008, 18.2% of the population are resident foreign nationals.[6] Over the last 10 years (1997–2007) the population has changed at a rate of 11.6%.[7]
Most of the population (as of 2000) speaks German (8,184 or 87.4%), with English being second most common (233 or 2.5%) and French being third (191 or 2.0%). There are 7 people who speak Romansh.[8]
As of 2008, the gender distribution of the population was 48.7% male and 51.3% female. The population was made up of 8,466 Swiss citizens (81.2% of the population), and 1,961 non-Swiss residents (18.8%)[9] Of the population in the municipality 1,727 or about 18.4% were born in Oberwil and lived there in 2000. There were 1,457 or 15.6% who were born in the same canton, while 3,916 or 41.8% were born somewhere else in Switzerland, and 1,954 or 20.9% were born outside of Switzerland.[8]
In 2008 there were 77 live births to Swiss citizens and 15 births to non-Swiss citizens, and in same time span there were 53 deaths of Swiss citizens and 2 non-Swiss citizen deaths. Ignoring immigration and emigration, the population of Swiss citizens increased by 24 while the foreign population increased by 13. There were 6 Swiss men who immigrated back to Switzerland and 1 Swiss woman who emigrated from Switzerland. At the same time, there were 36 non-Swiss men and 52 non-Swiss women who immigrated from another country to Switzerland. The total Swiss population change in 2008 (from all sources, including moves across municipal borders) was a decrease of 96 and the non-Swiss population change was an increase of 125 people. This represents a population growth rate of 0.3%.[6]
The age distribution, as of 2010, in Oberwil is; 705 children or 6.8% of the population are between 0 and 6 years old and 1,409 teenagers or 13.5% are between 7 and 19. Of the adult population, 966 people or 9.3% of the population are between 20 and 29 years old. 1,294 people or 12.4% are between 30 and 39, 1,849 people or 17.7% are between 40 and 49, and 2,130 people or 20.4% are between 50 and 64. The senior population distribution is 1,563 people or 15.0% of the population are between 65 and 79 years old and there are 511 people or 4.9% who are over 80.[9]
As of 2000, there were 3,488 people who were single and never married in the municipality. There were 4,857 married individuals, 484 widows or widowers and 534 individuals who are divorced.[8]
As of 2000, there were 4,067 private households in the municipality, and an average of 2.2 persons per household.[7] There were 1,240 households that consist of only one person and 198 households with five or more people. Out of a total of 4,118 households that answered this question, 30.1% were households made up of just one person and 21 were adults who lived with their parents. Of the rest of the households, there are 1,412 married couples without children, 1,134 married couples with children There were 214 single parents with a child or children. There were 46 households that were made up unrelated people and 51 households that were made some sort of institution or another collective housing.[8]
In 2000 there were 1,630 single family homes (or 73.0% of the total) out of a total of 2,233 inhabited buildings. There were 397 multi-family buildings (17.8%), along with 135 multi-purpose buildings that were mostly used for housing (6.0%) and 71 other use buildings (commercial or industrial) that also had some housing (3.2%). Of the single family homes 99 were built before 1919, while 212 were built between 1990 and 2000. The greatest number of single family homes (445) were built between 1971 and 1980.[10]
In 2000 there were 4,418 apartments in the municipality. The most common apartment size was 4 rooms of which there were 1,329. There were 132 single room apartments and 1,466 apartments with five or more rooms. Of these apartments, a total of 4,008 apartments (90.7% of the total) were permanently occupied, while 249 apartments (5.6%) were seasonally occupied and 161 apartments (3.6%) were empty.[10] As of 2007, the construction rate of new housing units was 2.7 new units per 1000 residents.[7] The vacancy rate for the municipality, in 2008, was 0.38%.[7]
The historical population is given in the following chart:[3][11]

Politics
In the 2011 federal election the most popular party was the SP which received 26.3% of the vote. The next three most popular parties were the SVP (24.42%) the FDP (19.11%), and the CVP (10.32%). In the federal election, a total of 3,498 votes were cast, and the voter turnout was 48.5%.[12]
Economy
As of 2007, Oberwil had an unemployment rate of 2.39%. As of 2005, there were 171 people employed in the primary economic sector and about 23 businesses involved in this sector. 332 people were employed in the secondary sector and there were 72 businesses in this sector. 2,296 people were employed in the tertiary sector, with 346 businesses in this sector.[7] There were 4,704 residents of the municipality who were employed in some capacity, of which females made up 43.9% of the workforce.
In 2008 the total number of full-time equivalent jobs was 2,377. The number of jobs in the primary sector was 47, all of which were in agriculture. The number of jobs in the secondary sector was 332, of which 130 or (39.2%) were in manufacturing and 202 (60.8%) were in construction. The number of jobs in the tertiary sector was 1,998. In the tertiary sector; 580 or 29.0% were in wholesale or retail sales or the repair of motor vehicles, 265 or 13.3% were in the movement and storage of goods, 76 or 3.8% were in a hotel or restaurant, 61 or 3.1% were in the information industry, 57 or 2.9% were the insurance or financial industry, 177 or 8.9% were technical professionals or scientists, 194 or 9.7% were in education and 268 or 13.4% were in health care.[13]
In 2000, there were 2,363 workers who commuted into the municipality and 3,706 workers who commuted away. The municipality is a net exporter of workers, with about 1.6 workers leaving the municipality for every one entering. About 14.5% of the workforce coming into Oberwil are coming from outside Switzerland, while 0.4% of the locals commute out of Switzerland for work.[14] Of the working population, 31.2% used public transportation to get to work, and 40.6% used a private car.[7]
Religion

From the 2000 census, 3,206 or 34.2% were Roman Catholic, while 3,396 or 36.3% belonged to the Swiss Reformed Church. Of the rest of the population, there were 125 members of an Orthodox church (or about 1.34% of the population), there were 38 individuals (or about 0.41% of the population) who belonged to the Christian Catholic Church, and there were 213 individuals (or about 2.27% of the population) who belonged to another Christian church. There were 12 individuals (or about 0.13% of the population) who were Jewish, and 312 (or about 3.33% of the population) who were Islamic. There were 33 individuals who were Buddhist, 41 individuals who were Hindu and 12 individuals who belonged to another church. 1,673 (or about 17.87% of the population) belonged to no church, are agnostic or atheist, and 302 individuals (or about 3.23% of the population) did not answer the question.[8]
Education
In Oberwil about 3,810 or (40.7%) of the population have completed non-mandatory upper secondary education, and 1,984 or (21.2%) have completed additional higher education (either university or a Fachhochschule). Of the 1,984 who completed tertiary schooling, 56.1% were Swiss men, 26.2% were Swiss women, 10.2% were non-Swiss men and 7.5% were non-Swiss women.[8] As of 2000, there were 765 students in Oberwil who came from another municipality, while 346 residents attended schools outside the municipality.[14]
Notable residents
- Dario Zuffi, former FC Basel player (prior residence)
- Roger Federer, current world number one tennis player (moved to Wollerau, Schwyz in March 2008)
References
- ↑ Arealstatistik Standard - Gemeindedaten nach 4 Hauptbereichen
- 1 2 Canton of Basel-Land Statistics, Wohnbevölkerung nach Nationalität und Konfession per 31. März 2016 (German) accessed 30 August 201
- 1 2 Oberwil in German, French and Italian in the online Historical Dictionary of Switzerland.
- 1 2 Swiss Federal Statistical Office-Land Use Statistics 2009 data (German) accessed 25 March 2010
- ↑ Flags of the World.com accessed 25-February-2011
- 1 2 Swiss Federal Statistical Office - Superweb database - Gemeinde Statistics 1981-2008 (German) accessed 19 June 2010
- 1 2 3 4 5 6 Swiss Federal Statistical Office accessed 25-February-2011
- 1 2 3 4 5 6 STAT-TAB Datenwürfel für Thema 40.3 - 2000 Archived April 9, 2014, at the Wayback Machine. (German) accessed 2 February 2011
- 1 2 Canton of Basel-Land Statistics, Wohnbevölkerung nach Nationalität und Konfession per 30. September 2010 (German) accessed 16 February 2011
- 1 2 Federal Statistical Office STAT-TAB - Datenwürfel für Thema 09.2 - Gebäude und Wohnungen Archived January 21, 2015, at the Wayback Machine. (German) accessed 28 January 2011
- ↑ Swiss Federal Statistical Office STAT-TAB Bevölkerungsentwicklung nach Region, 1850-2000 Archived September 30, 2014, at the Wayback Machine. (German) accessed 29 January 2011
- ↑ Oberwil online, Aktuelles Gemeinde: National- und Ständeratswahlen 2011 accessed 24 Oct 2011
- ↑ Swiss Federal Statistical Office STAT-TAB Betriebszählung: Arbeitsstätten nach Gemeinde und NOGA 2008 (Abschnitte), Sektoren 1-3 Archived December 25, 2014, at the Wayback Machine. (German) accessed 28 January 2011
- 1 2 Swiss Federal Statistical Office - Statweb (German) accessed 24 June 2010
External links
- Official website (German)
-
 Media related to Oberwil at Wikimedia Commons
 - Swissinfo Article: Federer turns his back on home canton