Norfolk County Council elections
Norfolk County Council in England is elected every four years. Since the last boundary changes, 84 councillors have been elected from 84 wards.[1]
Political control
| Party in control[2] | Years |
|---|---|
| Conservative | 1973 - 1993 |
| No overall control | 1993 - 2001 |
| Conservative | 2001 - 2013 |
| No overall control | 2013 - Present |
Historical composition
Council elections
- Norfolk County Council election, 2001
- Norfolk County Council election, 2005
- Norfolk County Council election, 2009
- Norfolk County Council election, 2013
County result maps
-

2009 results map
-
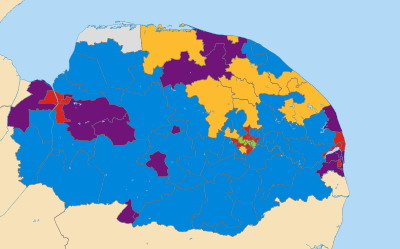
2013 results map
By-election results
1997-2001
| Party | Candidate | Votes | % | ± | |
|---|---|---|---|---|---|
| Labour | 808 | 43.0 | +1.0 | ||
| Liberal Democrat | 796 | 42.4 | +2.5 | ||
| Conservative | 275 | 14.6 | -0.2 | ||
| Majority | 12 | 0.6 | |||
| Turnout | 1,879 | 33.3 | |||
| Labour hold | Swing | ||||
| Party | Candidate | Votes | % | ± | |
|---|---|---|---|---|---|
| Labour | 803 | 53.5 | +1.2 | ||
| Liberal Democrat | 402 | 26.8 | -2.2 | ||
| Conservative | 296 | 19.7 | +2.5 | ||
| Majority | 401 | 26.7 | |||
| Turnout | 1,501 | ||||
| Labour hold | Swing | ||||
| Party | Candidate | Votes | % | ± | |
|---|---|---|---|---|---|
| Liberal Democrat | 1,848 | 55.4 | +14.5 | ||
| Conservative | 1,358 | 40.7 | +0.7 | ||
| Labour | 130 | 3.9 | -15.2 | ||
| Majority | 490 | 14.7 | |||
| Turnout | 3,336 | 44.0 | |||
| Liberal Democrat hold | Swing | ||||
| Party | Candidate | Votes | % | ± | |
|---|---|---|---|---|---|
| Labour | 575 | 48.4 | -8.3 | ||
| Conservative | 558 | 47.0 | +15.5 | ||
| Liberal Democrat | 55 | 4.6 | -7.2 | ||
| Majority | 17 | 1.4 | |||
| Turnout | 1,188 | 27.0 | |||
| Labour hold | Swing | ||||
2001-2005
| Party | Candidate | Votes | % | ± | |
|---|---|---|---|---|---|
| Liberal Democrat | 1,736 | 49.2 | +13.0 | ||
| Conservative | 1,734 | 49.1 | +9.1 | ||
| Green | 57 | 1.6 | -0.7 | ||
| Majority | 2 | 0.1 | |||
| Turnout | 3,527 | 35.7 | |||
| Liberal Democrat gain from Conservative | Swing | ||||
| Party | Candidate | Votes | % | ± | |
|---|---|---|---|---|---|
| Labour | 807 | 51.6 | +7.4 | ||
| Liberal Democrat | Paul Kendrick | 461 | 29.5 | -3.7 | |
| Conservative | 132 | 8.4 | -8.2 | ||
| Independent | 82 | 5.2 | +5.2 | ||
| Green | 81 | 5.2 | -0.7 | ||
| Majority | 346 | 22.1 | |||
| Turnout | 1,563 | ||||
| Labour hold | Swing | ||||
| Party | Candidate | Votes | % | ± | |
|---|---|---|---|---|---|
| Conservative | Shelagh Hutson | 1,301 | 68.3 | +13.0 | |
| Labour | 223 | 11.7 | -20.4 | ||
| UKIP | Michael Stone | 191 | 10.1 | +10.1 | |
| Liberal Democrat | John Nicholas-Letch | 190 | 10.0 | +0.2 | |
| Majority | 1,078 | 56.6 | |||
| Turnout | 1,905 | 21.3 | |||
| Conservative hold | Swing | ||||
2005-2009
| Party | Candidate | Votes | % | ± | |
|---|---|---|---|---|---|
| Green | Christopher Hull | 1,151 | 36.1 | +30.9 | |
| Liberal Democrat | Moira Toye | 958 | 30.1 | -11.7 | |
| Labour | David Fullman | 606 | 19.0 | -14.7 | |
| Conservative | John Wyatt | 470 | 14.8 | -4.5 | |
| Majority | 193 | 6.0 | |||
| Turnout | 3,185 | 41.0 | |||
| Green gain from Liberal Democrat | Swing | ||||
| Party | Candidate | Votes | % | ± | |
|---|---|---|---|---|---|
| Conservative | Judith Virgo | 1,725 | 47.7 | +1.6 | |
| Liberal Democrat | Jacqueline Sutton | 1,474 | 40.7 | +7.4 | |
| Green | Richard Bearman | 239 | 6.6 | +0.7 | |
| Labour | John Cowan | 180 | 5.0 | -9.7 | |
| Majority | 251 | 7.0 | |||
| Turnout | 3,618 | ||||
| Conservative hold | Swing | ||||
| Party | Candidate | Votes | % | ± | |
|---|---|---|---|---|---|
| Conservative | Tony Tomkinson | 1,743 | 46.0 | +5.2 | |
| Liberal Democrat | Bronwen Jenkins | 1,347 | 35.6 | -8.1 | |
| Green | Paul Fitzgerald | 378 | 9.8 | +2.2 | |
| Labour | Jeanette Fowler | 324 | 8.6 | +8.6 | |
| Majority | 396 | 10.4 | |||
| Turnout | 3,787 | 45.1 | |||
| Conservative gain from Liberal Democrat | Swing | ||||
| Party | Candidate | Votes | % | ± | |
|---|---|---|---|---|---|
| Liberal Democrat | David Harrison | 1,696 | 60.6 | +23.2 | |
| Conservative | Ian Graham | 854 | 30.5 | -6.4 | |
| Labour | Terry Glasspoole | 177 | 6.3 | -19.4 | |
| UKIP | Vandra Ahlstrom | 71 | 2.5 | +2.5 | |
| Majority | 842 | 30.1 | |||
| Turnout | 2,798 | 39.0 | |||
| Liberal Democrat hold | Swing | ||||
2009-2013
| Party | Candidate | Votes | % | ± | |
|---|---|---|---|---|---|
| Conservative | Judith VIRGO | 1015 | 46.6 | -5.4 | |
| Liberal Democrat | Jaqueline SUTTON | 438 | 20.1 | -4.5 | |
| Labour | Marian CHAPMAN | 424 | 19.4 | +11.4 | |
| Green | Janet KITCHENER | 170 | 7.8 | -7.7 | |
| UKIP | Richard COKE | 133 | 6.1 | 6.1 | |
| Majority | 577 | ||||
| Turnout | 2185 | 26.0 | |||
| Conservative hold | Swing | ||||
| Party | Candidate | Votes | % | ± | |
|---|---|---|---|---|---|
| Conservative | Barry Michael Stone | 1611 | 49.0 | +3.6 | |
| Labour | Trevor John Wainwright | 1076 | 32.7 | +10.6 | |
| Independent | John Lawrence Cooper | 418 | 12.7 | +12.7 | |
| Green | Michael Brackenbury | 184 | 5.6 | +5.6 | |
| Majority | 535 | ||||
| Turnout | |||||
| Conservative hold | Swing | ||||
Percentage change is since June 2009
| Party | Candidate | Votes | % | ± | |
|---|---|---|---|---|---|
| Conservative | Judy LEGGETT | 664 | 40.6 | -8.2 | |
| Liberal Democrat | Bob FOWKES | 414 | 25.3 | +11.8 | |
| Labour Co-op | Chrissie RUMSBY | 377 | 23.0 | +12.2 | |
| UKIP | Glenn Stuart TINGLE | 107 | 6.5 | -9.7 | |
| Green | Jennifer Ann PARKHOUSE | 75 | 4.6 | -6.0 | |
| Majority | 250 | ||||
| Turnout | 25.7 | ||||
| Conservative hold | Swing | ||||
Percentage change is since June 2009.
| Party | Candidate | Votes | % | ± | |
|---|---|---|---|---|---|
| Labour | Susan Jane WHITAKER | 1051 | 43.0 | +16.1 | |
| Liberal Democrat | David FAIRBAIRN | 611 | 25.0 | -6.7 | |
| Green | Paul Vincent NEALE | 492 | 20.1 | +7.4 | |
| Conservative | Mathew John MORRIS | 160 | 6.5 | -6.5 | |
| UKIP | Stephen Michael EMMENS | 133 | 5.4 | -10.3 | |
| Majority | 440 | ||||
| Turnout | |||||
| Labour gain from Liberal Democrat | Swing | ||||
| Party | Candidate | Votes | % | ± | |
|---|---|---|---|---|---|
| Labour | Alexandra KAMPOUROPOULOS | 824 | 45.8 | +34.1 | |
| Conservative | Paul FOSTER | 424 | 23.5 | -15.7 | |
| Liberal Democrat | Kathleen Marie SAYER | 282 | 15.7 | -13.1 | |
| UKIP | Michael STONE | 271 | 15.0 | +15.0 | |
| Majority | 400 | ||||
| Turnout | 22.5 | ||||
| Labour gain from Conservative | Swing | ||||
Percentage change is since June 2009.
2013-2017
| Party | Candidate | Votes | % | ± | |
|---|---|---|---|---|---|
| Labour | Terry Jermy | 1,071 | 45.2 | +9.8 | |
| UKIP | John Newton | 900 | 38.0 | +2.6 | |
| Conservative | Tristan Ashby | 282 | 11.9 | -3.5 | |
| Independent | Danny Jeffrey | 78 | 3.3 | +3.3 | |
| Green | Sandra Walmsley | 40 | 1.7 | -1.1 | |
| Majority | 171 | ||||
| Turnout | 24.64 | ||||
| Labour gain from UKIP | Swing | ||||
Percentage change is since May 2013. The by-election was triggered by the resignation of UKIP Councillor Peter Georgiou, after he admitted to shoplifting and tobacco duty evasion.[12]
| Party | Candidate | Votes | % | ± | |
|---|---|---|---|---|---|
| Conservative | Graham Plant | 876 | 42.7 | +15.3 | |
| Labour | Tony Wright | 773 | 37.7 | +1.8 | |
| UKIP | Adrian Myers | 285 | 13.9 | -22.8 | |
| Liberal Democrat | Tony Harris | 66 | 3.2 | N/A | |
| Green | Harry Webb | 51 | 2.5 | N/A | |
| Majority | 29 | 5.0 | |||
| Turnout | 2,053 | 27.9 | |||
| Conservative gain from UKIP | Swing | ||||
The by-election was triggered by the resignation of Councillor Matthew Smith, who was elected as a member of the UK Independence Party, following his guilty plea to charges of electoral fraud[13]
| Party | Candidate | Votes | % | ± | |
|---|---|---|---|---|---|
| Conservative | Claire Bowes | 822 | 45.6 | +18.2 | |
| Independent | Keith Gilbert | 793 | 44.0 | +20.4 | |
| Labour | Joseph Sisto | 105 | 5.8 | -5.4 | |
| Green | Timothy Birt | 81 | 4.5 | +0.3 | |
| Majority | 29 | 1.6 | |||
| Turnout | 1,806 | 21 | |||
| Conservative gain from UKIP | Swing | ||||
The by-election was triggered by the resignation of Councillor Stan Hebborn, who was elected for the UK Independence Party.[15]
References
- ↑ "The How the council works". Norfolk County Council. Retrieved 2009-09-08.
- ↑ "Local Council List - Norfolk". Vote 2001 - Local election 2001. BBC News. Retrieved 8 May 2013.
- ↑ "Greens in shock ward by-election win". Local Government Chronicle. 2005-05-27. Retrieved 2009-09-08.
- ↑ "Humbleyard by-election result". Norfolk County Council. 2006-05-05. Retrieved 2009-09-08.
- ↑ "Clavering by-election result". Norfolk County Council. 2007-05-04. Retrieved 2009-09-08.
- ↑ "Declaration of result of poll" (PDF). Broadland District Council. Retrieved 2009-09-08.
- ↑ "Declaration of result of poll". Norfolk County Council. Retrieved 4 March 2013.
- ↑ "Declaration of result of poll". Norfolk County Council. Retrieved 4 March 2013.
- ↑ "Declaration of result of poll". Norfolk County Council. Retrieved 4 March 2013.
- ↑ "Declaration of result of poll". Norfolk County Council. Retrieved 4 March 2013.
- ↑ "Declaration of result of poll". Norfolk County Council. Retrieved 4 March 2013.
- ↑ http://www.edp24.co.uk/news/politics/labour_fight_off_ukip_to_take_thetford_west_by_election_1_2312789
- ↑ http://www.greatyarmouthmercury.co.uk/news/conservatives_win_back_gorleston_seat_in_norfolk_county_council_by_election_1_4156706
- ↑ https://www.breckland.gov.uk/article/2128/Norfolk-County-Council-By-Election-Watton-Division
- ↑ http://www.wattonandswaffhamtimes.co.uk/news/polling_stations_announced_for_crucial_watton_by_election_1_4306306
External links
| Norfolk County Council | |
|---|---|
| Breckland District Council |
|
| Broadland District Council |
|
| Great Yarmouth Borough Council | |
| King's Lynn and West Norfolk Borough Council |
|
| North Norfolk District Council | |
| Norwich City Council | |
| South Norfolk District Council | |
| |