Norfolk County Council election, 2013
| | |||||||||||||||||||||||||||||||||||||||||||||||||||||||||
| |||||||||||||||||||||||||||||||||||||||||||||||||||||||||
| |||||||||||||||||||||||||||||||||||||||||||||||||||||||||
|
| |||||||||||||||||||||||||||||||||||||||||||||||||||||||||
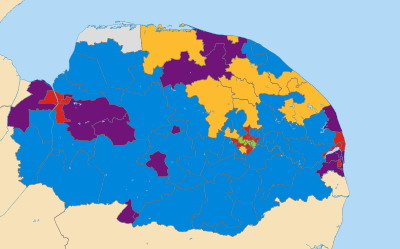
| Map showing the results of the 2013 Norfolk County Council elections. | |||||||||||||||||||||||||||||||||||||||||||||||||||||||||
| |||||||||||||||||||||||||||||||||||||||||||||||||||||||||
The Norfolk County Council election took place across Norfolk on 2 May 2013, coinciding with local elections for all county councils in England. The results were announced the following day, Friday 3 May 2013. The result brought to an end 12 years of Conservative Party rule, who finished three seats short of a majority after losing 20 seats. UKIP and the Labour Party both made gains of 14 and 11 seats respectively. The Liberal Democrats and the Green Party both lost three seats each, while an independent won a single seat in North Coast.
All locally registered electors (British, Irish, Commonwealth and European Union citizens) who were aged 18 or over on Thursday 2 May 2013 were entitled to vote in the local elections. Those who were temporarily away from their ordinary address (for example, away working, on holiday, in student accommodation or in hospital) were also entitled to vote in the local elections,[1] although those who had moved abroad and registered as overseas electors cannot vote in the local elections. It is possible to register to vote at more than one address (such as a university student who had a term-time address and lives at home during holidays) at the discretion of the local Electoral Register Office, but it remains an offence to vote more than once in the same local government election.[2]
Previous composition
2009 election
| Party | Seats | |
|---|---|---|
| Conservative | 60 | |
| Liberal Democrat | 13 | |
| Green | 7 | |
| Labour | 3 | |
| UKIP | 1 | |
| Total | 84 | |
Composition of council seats before election
| Party | Seats[3] | |
|---|---|---|
| Conservative | 58 | |
| Liberal Democrat | 9 | |
| Green | 6 | |
| Labour | 5 | |
| Independent | 3 | |
| UKIP | 1 | |
| Vacant | 2 | |
| Total | 84 | |
Summary of Results
| Norfolk County Council election results 2013 | ||||||||||
|---|---|---|---|---|---|---|---|---|---|---|
| Party | Seats | Gains | Losses | Net gain/loss | Seats % | Votes % | Votes | +/− | ||
| Conservative | 40 | 2 | 22 | -20 | 47.62 | 32.60 | 70,249 | -13.32 | ||
| UKIP | 15 | 14 | 0 | 14 | 17.86 | 23.47 | 50,568 | +18.92 | ||
| Labour | 14 | 11 | 0 | 11 | 16.67 | 22.75 | 49,028 | +8.98 | ||
| Liberal Democrat | 10 | 1 | 4 | -3 | 11.9 | 10.97 | 23,645 | -11.71 | ||
| Green | 4 | 0 | 3 | -3 | 4.76 | 6.55 | 14,119 | -4.32 | ||
| Independent | 1 | 1 | 0 | 1 | 1.19 | 3.49 | 7,519 | +2.12 | ||
| Christian Peoples | 0 | 0 | 0 | +/-0 | 0 | 0.13 | 287 | +0.13 | ||
| United People's Party | 0 | 0 | 0 | +/-0 | 0 | 0.02 | 50 | 0.02 | ||
| Total | 84 | 215,465 | ||||||||
Party performances
The Conservative Party suffered net a net loss of 20 seats (22 losses and 2 gains); Liberal Democrats a net loss of 3 seats (4 losses and 1 gain); the Green Party lost 3 seats, finishing with four in total. UKIP made 14 gains to become the official opposition, while Labour gained 11 seats, and 1 seat was gained by an independent.
The Conservatives lost one seat (Hevingham & Spixworth) to the Liberal Democrats in Broadland, one to an Independent candidate (North Coast) in King's Lynn and West Norfolk, 7 seats to Labour (Caister-on-Sea, Yarmouth North & Central, Clenchwarton & King's Lynn South, Gaywood South, King's Lynn North & Central, Bowthorpe and Catton Grove), as well as losing 13 seats to UKIP (Dereham South, Swaffham, Thetford East, Watton, Breydon, East Flegg, Gorleston St Andrews, Lothingland, Gayton & Nar Valley, Gaywood North & Central, Marshland North, Holt and Melton Constable).
The Liberal Democrats lost two seats to the Conservatives (Fakenham and Mundesley, both in North Norfolk), one seat to UKIP in Breckland (Thetford West) and one to Labour covering several city wards in the Norwich district (Lakenham).
The Green Party lost three seats to Labour in Norwich (Mile Cross, Sewell and Town Close).
Incumbent councillors
A total of 55 incumbent councillors were defending their seats for the same party they had stood for in 2009 (or in one of the five subsequent by-election). 41 were successful in retaining their seats, while 14 were not.
41 incumbent Conservative County Councillors were defending their seats at this election, including Judy Leggett (Old Catton), Judith Virgo (Humbleyard) and Barry Stone (Lothingland) who had won their seats in by-elections. Of these 41, 28 were re-elected while the other 13 lost their seats (9 to UKIP, 3 to Labour, 1 to the Liberal Democrats). All 5 Liberal Democrat incumbents held their seats. The Green Party had 3 incumbents defending seats; two were retained, while one was lost to Labour. Labour incumbents successfully defended all 5 of their seats (two of which they had won in by-elections - Susan Whitaker in Lakenham division and Alexandra Kemp (née Kampourpoulos) in Clenchwarton and King's Lynn South division). UKIP's single councillor retained his seat.
Incumbents who stood for other parties or as independents (such as former Conservative Jon Herbert in Forehoe) are not counted in these figures.
Group leaders
Bill Borrett (Elmham & Mattishall) continues as Conservative group leader, George Nobbs (Crome) was re-elected unopposed as the leader of the Labour Group. The Liberal Democrats elected Dr Marie Strong (Wells) as their new group leader, replacing Mike Brindle who did not stand in this election. Richard Bearman (Mancroft) continues as the leader of the Green Party group. [4] Richard Toby Coke (Gayton & Nar Valley division) was selected as the UKIP group leader on the council.[5]
Turnout
The overall turnout at the election was 32.14% (215,465 votes, out of a total electorate of 670,383). The turnout in each division ranged form 18.09% in King's Lynn North & Central to 50.75% in Holt.
Aftermath
In the aftermath of the election a "loose" alliance was formed between Labour, UKIP & The Liberal Democrats with support from the Green Party and an Independent councillor. Under the agreement, the previous cabinet system is set to be abolished and replaced by a committee system which would allow decisions to be made by more of the councillors, whereas before most decisions were made by less than 10 councillors who were all chosen as cabinet members by the council leader. Under the agreement Labour councillor George Nobbs would lead the council for 1 year while the cabinet system is replaced. [6]
Candidates by party
| 84 / 84
70 / 84
43 / 84 |
84 / 84
62 / 84
21 / 84 |
There were a total of 364 candidates standing across the whole of the county - an average of 4⅓ in each division. Both the Conservatives and Labour fielded a full slate of 84 candidates, UKIP stood 70 candidates, the Liberal Democrats stood 62, the Green Party stood 43, and there were 21 other candidates (including 3 for the Christian Peoples Alliance, 1 for the United People's Party and 17 independents).[7]
Compared to 2009, UKIP had 52 more candidates, there were 6 more independent candidates than 2009, the Conservatives and Labour had the same number, the Liberal Democrats had 7 fewer candidates and the Green Party had 8 fewer candidates. The British National Party did not stand any candidates, compared to the 7 they stood in the previous election. In total, there were 44 more candidates than in 2009.
Candidates and results by division
Below are the results of the election, separated into the 7 districts and 84 divisions.[8]
Breckland
Attleborough
| Party | Candidate | Votes | % | ± | |
|---|---|---|---|---|---|
| Conservative | Alec Byrne | 907 | 38.94 | ||
| UKIP | John Christopher Savory | 758 | 32.55 | ||
| Labour | John Herbert Williams | 530 | 22.76 | ||
| Liberal Democrat | Pat McClenning | 134 | 5.75 | ||
| Majority | 149 | 6.89 | |||
| Turnout | 2162 | 32.05 | |||
| Conservative hold | Swing | ||||
Dereham North
| Party | Candidate | Votes | % | ± | |
|---|---|---|---|---|---|
| Conservative | William Richmond | 909 | 37.91 | ||
| UKIP | Anna Hamilton | 793 | 33.07 | ||
| Labour Co-op | Harry Edward Jonathan Clarke | 472 | 19.68 | ||
| Green | Ann Patricia Robertson Bowyer | 224 | 9.34 | ||
| Majority | 116 | 4.84 | |||
| Turnout | 2398 | 30.76 | |||
| Conservative hold | Swing | ||||
Dereham South
| Party | Candidate | Votes | % | ± | |
|---|---|---|---|---|---|
| UKIP | Paul Christopher John Gilmour | 876 | 35.80 | ||
| Conservative | Gordon Bambridge | 693 | 28.32 | ||
| Labour | Craig Thomas Warmer | 528 | 21.58 | ||
| Liberal Democrat | Paul James Speed | 180 | 7.36 | ||
| Green | David Jonothan Bowyer | 112 | 4.58 | ||
| Christian Peoples | Chris Olley | 58 | 2.37 | ||
| Majority | 183 | 7.48 | |||
| Turnout | 2447 | 27.75 | |||
| UKIP gain from Conservative | Swing | ||||
Elmham & Mattishall
| Party | Candidate | Votes | % | ± | |
|---|---|---|---|---|---|
| Conservative | Bill Borrett | 1380 | 48.80 | ||
| UKIP | Anthony Nicholas Moore | 903 | 31.93 | ||
| Labour | Linda Goreham | 545 | 19.27 | ||
| Majority | 477 | 16.87 | |||
| Turnout | 2828 | 31.53 | |||
| Conservative hold | Swing | ||||
Guiltcross
| Party | Candidate | Votes | % | ± | |
|---|---|---|---|---|---|
| Conservative | Stephen Askew | 1132 | 43.61 | ||
| UKIP | Jeremy Power | 692 | 26.66 | ||
| Labour | Jim Walters | 438 | 16.87 | ||
| Liberal Democrat | Steve Gordon | 334 | 12.87 | ||
| Majority | 440 | 16.95 | |||
| Turnout | 2596 | 31.28 | |||
| Conservative hold | Swing | ||||
Necton & Launditch
| Party | Candidate | Votes | % | ± | |
|---|---|---|---|---|---|
| Conservative | Mark Kiddle-Morris | 1289 | 40.64 | ||
| UKIP | James Leigh-Wood | 867 | 27.33 | ||
| Labour | Joe Sisto | 582 | 18.35 | ||
| Green | Jane Keidan-Cooper | 254 | 8.01 | ||
| Independent | Glynn George Burrows | 180 | 5.67 | ||
| Majority | 422 | 13.30 | |||
| Turnout | 3172 | 36.51 | |||
| Conservative hold | Swing | ||||
Swaffham
| Party | Candidate | Votes | % | ± | |
|---|---|---|---|---|---|
| UKIP | Paul John Smyth | 1055 | 44.50 | ||
| Conservative | Ann Steward | 949 | 40.03 | ||
| Labour | Matthew Fulton | 367 | 15.48 | ||
| Majority | 106 | 4.47 | |||
| Turnout | 2371 | 30.13 | |||
| UKIP gain from Conservative | Swing | ||||
The Brecks
| Party | Candidate | Votes | % | ± | |
|---|---|---|---|---|---|
| Conservative | Ian Monson | 1253 | 42.84 | ||
| UKIP | James Vernon | 1082 | 36.99 | ||
| Labour | Stephen Green | 301 | 10.29 | ||
| Green | Jeff Prosser | 194 | 6.63 | ||
| Christian Peoples | Mark Anthony Clamp | 95 | 3.25 | ||
| Majority | 171 | 5.85 | |||
| Turnout | 2925 | 33.46 | |||
| Conservative hold | Swing | ||||
Thetford East
| Party | Candidate | Votes | % | ± | |
|---|---|---|---|---|---|
| UKIP | Denis Melvin Crawford | 896 | 47.01 | ||
| Conservative | Marion Chapman-Allen | 502 | 26.34 | ||
| Labour | Brenda Canham | 360 | 18.89 | ||
| Green | Julia Marianne Yelloly | 85 | 4.46 | ||
| Liberal Democrat | Bodo Rissman | 63 | 3.31 | ||
| Majority | 394 | 20.67 | |||
| Turnout | 1906 | 24.35 | |||
| UKIP gain from Conservative | Swing | ||||
Thetford West
| Party | Candidate | Votes | % | ± | |
|---|---|---|---|---|---|
| UKIP | Peter Costas Georgiou | 814 | 35.39 | ||
| Labour Co-op | Terry Jermy | 813 | 35.35 | ||
| Conservative | Tristan Ashby | 353 | 15.35 | ||
| Christian Peoples | Carl Clark | 134 | 5.83 | ||
| Liberal Democrat | Danny Jeffrey | 122 | 5.30 | ||
| Green | Sandra Elizabeth Walmsley | 64 | 2.78 | ||
| Majority | 1 | 0.04 | |||
| Turnout | 2300 | 23.75 | |||
| UKIP gain from Liberal Democrat | Swing | ||||
Watton
| Party | Candidate | Votes | % | ± | |
|---|---|---|---|---|---|
| UKIP | Stan Hebborn | 808 | 33.51 | ||
| Conservative | John Rogers | 662 | 27.46 | ||
| Independent | Keith Stephen Gilbert | 569 | 23.60 | ||
| Labour | Margaret Evelyn Holmes | 270 | 11.20 | ||
| Green | Timothy Edward Birt | 102 | 4.23 | ||
| Majority | 146 | 6.06 | |||
| Turnout | 2411 | 27.98 | |||
| UKIP gain from Conservative | Swing | ||||
Yare & All Saints
| Party | Candidate | Votes | % | ± | |
|---|---|---|---|---|---|
| Conservative | Cliff Jordan | 1074 | 44.07 | ||
| UKIP | Paul Thompson | 942 | 38.65 | ||
| Labour | John Charles William Michie | 421 | 17.28 | ||
| Majority | 132 | 5.42 | |||
| Turnout | 2437 | 32.16 | |||
| Conservative hold | Swing | ||||
Broadland
Acle
| Party | Candidate | Votes | % | ± | |
|---|---|---|---|---|---|
| Conservative | Brian John Maxwell Iles | 867 | 40.10 | ||
| UKIP | Christopher Woollands | 712 | 32.93 | ||
| Labour | Alan David Pawsey | 473 | 21.88 | ||
| Liberal Democrat | Victor Frederick Morgan | 110 | 5.09 | ||
| Majority | 155 | 7.17 | |||
| Turnout | 2162 | 32.05 | |||
| Conservative hold | Swing | ||||
Aylsham
| Party | Candidate | Votes | % | ± | |
|---|---|---|---|---|---|
| Liberal Democrat | David George Harrison | 1148 | 40.64 | ||
| Conservative | Ian Gordon Graham | 727 | 25.73 | ||
| UKIP | Steve Emmens | 617 | 21.84 | ||
| Labour | Ray Britt | 333 | 11.79 | ||
| Majority | 421 | 14.90 | |||
| Turnout | 2825 | 38.30 | |||
| Liberal Democrat hold | Swing | ||||
Blofield & Brundall
| Party | Candidate | Votes | % | ± | |
|---|---|---|---|---|---|
| Conservative | Andrew James Proctor | 1198 | 46.27 | ||
| Labour Co-op | Elliot Page | 544 | 21.01 | ||
| UKIP | Armin Hess | 493 | 19.04 | ||
| Green | Nick Ball | 235 | 9.08 | ||
| Liberal Democrat | Peter James Sergeant | 119 | 4.60 | ||
| Majority | 654 | 25.61 | |||
| Turnout | 2589 | 35.23 | |||
| Conservative hold | Swing | ||||
Drayton & Horsford
| Party | Candidate | Votes | % | ± | |
|---|---|---|---|---|---|
| Conservative | Tony Adams | 846 | 39.76 | ||
| UKIP | Brian G Antuar | 651 | 30.59 | ||
| Labour | Chris Jones | 421 | 19.78 | ||
| Liberal Democrat | Veronica Mary Beadle | 210 | 9.87 | ||
| Majority | 195 | 9.16 | |||
| Turnout | 2128 | 26.91 | |||
| Conservative hold | Swing | ||||
Hellesdon
| Party | Candidate | Votes | % | ± | |
|---|---|---|---|---|---|
| Conservative | Shelagh Cassandra Gurney | 1120 | 39.58 | ||
| UKIP | Michael Francis Walsh | 831 | 29.36 | ||
| Labour | Sasha Pearce | 496 | 17.53 | ||
| Liberal Democrat | Peter Balcombe | 229 | 8.09 | ||
| Green | Jennifer Ann Parkhouse | 154 | 5.44 | ||
| Majority | 289 | 10.21 | |||
| Turnout | 2830 | 31.81 | |||
| Conservative hold | Swing | ||||
Hevingham & Spixworth
| Party | Candidate | Votes | % | ± | |
|---|---|---|---|---|---|
| Liberal Democrat | Daniel Roper | 850 | 36.57 | ||
| Conservative | Shaun Andrew Vincent | 680 | 29.26 | ||
| UKIP | Sandra Smyth | 563 | 24.23 | ||
| Labour | Tony Hemmingway | 231 | 9.94 | ||
| Majority | 170 | 7.31 | |||
| Turnout | 2324 | 32.84 | |||
| Liberal Democrat gain from Conservative | Swing | ||||
Old Catton
| Party | Candidate | Votes | % | ± | |
|---|---|---|---|---|---|
| Conservative | Judy Leggett | 796 | 36.80 | ||
| UKIP | Lionel Robert Buckingham | 497 | 22.98 | ||
| Labour | Peter Leonard Watson | 389 | 17.98 | ||
| Liberal Democrat | James William Wright | 362 | 16.74 | ||
| Green | Phil Di Palma | 119 | 5.50 | ||
| Majority | 299 | 13.82 | |||
| Turnout | 2163 | 33.06 | |||
| Conservative hold | Swing | ||||
Reepham
| Party | Candidate | Votes | % | ± | |
|---|---|---|---|---|---|
| Liberal Democrat | James Michael Joyce | 768 | 33.58 | ||
| Conservative | Kerrie Alison Barnett | 717 | 31.35 | ||
| UKIP | Dominic Low | 510 | 22.30 | ||
| Labour | Christine Mary Hemmingway | 292 | 12.77 | ||
| Majority | 51 | 2.23 | |||
| Turnout | 2287 | 34.92 | |||
| Liberal Democrat hold | Swing | ||||
Sprowston
| Party | Candidate | Votes | % | ± | |
|---|---|---|---|---|---|
| Conservative | John Martyn Ward | 1076 | 33.79 | ||
| Labour Co-op | Chrissie Rumsby | 941 | 29.55 | ||
| UKIP | John Leslie Gilson | 865 | 27.17 | ||
| Liberal Democrat | Sam Sirdar | 302 | 9.48 | ||
| Majority | 135 | 4.24 | |||
| Turnout | 3184 | 33.98 | |||
| Conservative hold | Swing | ||||
Taverham
| Party | Candidate | Votes | % | ± | |
|---|---|---|---|---|---|
| Conservative | Stuart Michael Clancy | 1399 | 55.52 | ||
| UKIP | Ian P Kelly | 613 | 24.33 | ||
| Labour | Angus Dixon | 285 | 11.31 | ||
| Liberal Democrat | Paul Richard Burall | 223 | 8.85 | ||
| Majority | 786 | 31.19 | |||
| Turnout | 2520 | 32.52 | |||
| Conservative hold | Swing | ||||
Thorpe St Andrew
| Party | Candidate | Votes | % | ± | |
|---|---|---|---|---|---|
| Conservative | Ian James Mackie | 1153 | 46.70 | ||
| Labour | Joanna Lesley Barker | 577 | 23.37 | ||
| UKIP | David Moreland | 553 | 22.40 | ||
| Liberal Democrat | Steve Buckle | 186 | 7.53 | ||
| Majority | 576 | 23.33 | |||
| Turnout | 2469 | 31.37 | |||
| Conservative hold | Swing | ||||
Woodside
| Party | Candidate | Votes | % | ± | |
|---|---|---|---|---|---|
| Conservative | Nigel Christopher Shaw | 922 | 38.84 | ||
| Labour | Jill Veronica Wigy | 768 | 32.35 | ||
| UKIP | Ean Alexander Newberry | 555 | 23.38 | ||
| Liberal Democrat | Phyllida Isobel Margaret Scrivens | 129 | 5.43 | ||
| Majority | 154 | 6.49 | |||
| Turnout | 2374 | 36.24 | |||
| Conservative hold | Swing | ||||
Wroxham
| Party | Candidate | Votes | % | ± | |
|---|---|---|---|---|---|
| Conservative | Tom Garrod | 908 | 31.87 | ||
| Independent | Stephen Paul Heard | 550 | 19.31 | ||
| UKIP | Richard Amies | 543 | 19.06 | ||
| Liberal Democrat | Michael William Kitching | 533 | 18.71 | ||
| Labour | Malcolm Kenneth Kemp | 315 | 11.06 | ||
| Majority | 358 | 12.57 | |||
| Turnout | 2849 | 35.72 | |||
| Conservative hold | Swing | ||||
Great Yarmouth
Breydon
| Party | Candidate | Votes | % | ± | |
|---|---|---|---|---|---|
| UKIP | Alan Christie Grey | 903 | 37.01 | ||
| Labour | Trevor John Wainwright | 822 | 33.69 | ||
| Conservative | Graham Robert Plant | 715 | 29.30 | ||
| Majority | 81 | 3.32 | |||
| Turnout | 2440 | 29.31 | |||
| UKIP gain from Conservative | Swing | ||||
Caister-on-Sea
| Party | Candidate | Votes | % | ± | |
|---|---|---|---|---|---|
| Labour | Patrick Hacon | 875 | 34.67 | ||
| UKIP | John Cutting | 802 | 31.77 | ||
| Conservative | Ronald Charles Hanton | 688 | 27.26 | ||
| Green | Harry Lee Webb | 115 | 4.56 | ||
| Liberal Democrat | Nicholas Mark Dyer | 44 | 1.74 | ||
| Majority | 73 | 2.89 | |||
| Turnout | 2524 | 35.02 | |||
| Labour gain from Conservative | Swing | ||||
East Flegg
| Party | Candidate | Votes | % | ± | |
|---|---|---|---|---|---|
| UKIP | Jonathon Childs | 997 | 41.73 | ||
| Conservative | James Robert Shrimplin | 906 | 37.92 | ||
| Labour | Brian Pilkington | 486 | 20.34 | ||
| Majority | 91 | 3.81 | |||
| Turnout | 2389 | 32.77 | |||
| UKIP gain from Conservative | Swing | ||||
Gorleston St Andrews
| Party | Candidate | Votes | % | ± | |
|---|---|---|---|---|---|
| UKIP | Matthew Smith | 874 | 36.71 | ||
| Labour | Anthony Wright | 854 | 35.87 | ||
| Conservative | Patricia Elizabeth Page | 653 | 27.43 | ||
| Majority | 20 | 0.84 | |||
| Turnout | 2381 | 33.19 | |||
| UKIP gain from Conservative | Swing | ||||
Lothingland
| Party | Candidate | Votes | % | ± | |
|---|---|---|---|---|---|
| UKIP | Colin Aldred | 930 | 37.64 | ||
| Conservative | Barry Michael Stone | 856 | 34.64 | ||
| Labour | Brian Walker | 685 | 27.72 | ||
| Majority | 74 | 2.99 | |||
| Turnout | 2471 | 29.53 | |||
| UKIP gain from Conservative | Swing | ||||
Magdalen
| Party | Candidate | Votes | % | ± | |
|---|---|---|---|---|---|
| Labour | Colleen Walker | 1086 | 48.01 | ||
| UKIP | Matthew Swann | 757 | 33.47 | ||
| Conservative | Brian Michael Dolton | 419 | 18.52 | ||
| Majority | 329 | 14.54 | |||
| Turnout | 2262 | 28.92 | |||
| Labour hold | Swing | ||||
West Flegg
| Party | Candidate | Votes | % | ± | |
|---|---|---|---|---|---|
| Conservative | Michael Reginald Harry Carttiss | 802 | 40.65 | ||
| UKIP | Daniel Thistlewaite | 629 | 31.88 | ||
| Labour | Lee Paul Sutton | 542 | 27.47 | ||
| Majority | 173 | 8.77 | |||
| Turnout | 1973 | 34.08 | |||
| Conservative hold | Swing | ||||
Yarmouth Nelson & Southdown
| Party | Candidate | Votes | % | ± | |
|---|---|---|---|---|---|
| UKIP | Rex Edgar Parkinson-Hare | 825 | 42.09 | ||
| Labour | Kerry Susanne Robinson-Payne | 814 | 41.53 | ||
| Conservative | Barry George Coleman | 271 | 13.83 | ||
| United People's Party | Shaun Barry Wright | 50 | 2.55 | ||
| Majority | 11 | 0.56 | |||
| Turnout | 1960 | 21.78 | |||
| UKIP hold | Swing | ||||
Yarmouth North & Central
| Party | Candidate | Votes | % | ± | |
|---|---|---|---|---|---|
| Labour Co-op | Michael Castle | 975 | 38.51 | ||
| UKIP | Kay Elizabeth Grey | 892 | 35.23 | ||
| Conservative | Penelope Jane Carpenter | 568 | 22.43 | ||
| Liberal Democrat | Anthony John Harris | 97 | 3.83 | ||
| Majority | 83 | 3.28 | |||
| Turnout | 2532 | 27.85 | |||
| Labour gain from Conservative | Swing | ||||
King's Lynn and West Norfolk
Clenchwarton & King's Lynn South
| Party | Candidate | Votes | % | ± | |
|---|---|---|---|---|---|
| Labour | Alexandra Kemp | 955 | 44.05 | ||
| UKIP | Jason Edwards | 631 | 29.11 | ||
| Conservative | David Whitby | 582 | 26.85 | ||
| Majority | 324 | 14.94 | |||
| Turnout | 2168 | 29.06 | |||
| Labour gain from Conservative | Swing | ||||
Dersingham
| Party | Candidate | Votes | % | ± | |
|---|---|---|---|---|---|
| Conservative | John Dobson | 1422 | 46.61 | ||
| UKIP | Irene Olive Ramsbotham | 844 | 27.66 | ||
| Labour | Richard William Pennington | 627 | 20.55 | ||
| Liberal Democrat | Erika Ingrid Coward | 158 | 5.18 | ||
| Majority | 578 | 18.94 | |||
| Turnout | 3051 | 35.05 | |||
| Conservative hold | Swing | ||||
Docking
| Party | Candidate | Votes | % | ± | |
|---|---|---|---|---|---|
| Conservative | Michael Chenery of Horsbrugh | 1138 | 42.57 | ||
| Independent | David Holmes | 1012 | 37.86 | ||
| Labour | Ian Gourlay | 523 | 19.57 | ||
| Majority | 126 | 4.71 | |||
| Turnout | 2673 | 33.43 | |||
| Conservative hold | Swing | ||||
Downham Market
| Party | Candidate | Votes | % | ± | |
|---|---|---|---|---|---|
| Conservative | Tony White | 878 | 36.28 | ||
| UKIP | Karen Teresa Head | 774 | 31.98 | ||
| Labour Co-op | Peter Smith | 523 | 21.61 | ||
| Independent | Sheridan Payne | 245 | 10.12 | ||
| Majority | 104 | 4.30 | |||
| Turnout | 2420 | 30.78 | |||
| Conservative hold | Swing | ||||
Feltwell
| Party | Candidate | Votes | % | ± | |
|---|---|---|---|---|---|
| Conservative | Martin Storey | 1273 | 44.62 | ||
| UKIP | John Bankhead | 1095 | 38.38 | ||
| Labour | Phil Davies | 485 | 17.00 | ||
| Majority | 178 | 6.24 | |||
| Turnout | 2853 | 30.19 | |||
| Conservative hold | Swing | ||||
Fincham
| Party | Candidate | Votes | % | ± | |
|---|---|---|---|---|---|
| Conservative | Brian Long | 990 | 38.61 | ||
| UKIP | Ashley Richard Collins | 872 | 34.01 | ||
| Labour | Jonathan Toye | 556 | 21.68 | ||
| Liberal Democrat | Kate Sayer | 146 | 5.69 | ||
| Majority | 118 | 4.60 | |||
| Turnout | 2564 | 30.03 | |||
| Conservative hold | Swing | ||||
Freebridge Lynn
| Party | Candidate | Votes | % | ± | |
|---|---|---|---|---|---|
| Conservative | Jason Law | 917 | 33.42 | ||
| Green | Michael De Whalley | 773 | 28.17 | ||
| UKIP | Neville Manley | 589 | 21.47 | ||
| Labour | Gary Ian Howman | 389 | 14.18 | ||
| Liberal Democrat | Tony Bobb | 76 | 2.77 | ||
| Majority | 144 | 5.25 | |||
| Turnout | 2744 | 36.27 | |||
| Conservative hold | Swing | ||||
Gayton & Nar Valley
| Party | Candidate | Votes | % | ± | |
|---|---|---|---|---|---|
| UKIP | Richard Toby Coke | 783 | 28.32 | ||
| Independent | Mike Knights | 723 | 26.15 | ||
| Conservative | Paul Stephen Foster | 548 | 19.82 | ||
| Liberal Democrat | Elaine Margaret Oliver | 369 | 369 | ||
| Labour | Peter Wilkinson | 201 | 7.27 | ||
| Independent | Baljinder Anota | 141 | 5.10 | ||
| Majority | 60 | 2.17 | |||
| Turnout | 2765 | 33.65 | |||
| UKIP gain from Conservative | Swing | ||||
Gaywood North & Central
| Party | Candidate | Votes | % | ± | |
|---|---|---|---|---|---|
| UKIP | Jim Perkins | 697 | 35.60 | ||
| Labour | John Leonard Collop | 625 | 31.92 | ||
| Conservative | Jean Mickleburgh | 478 | 24.41 | ||
| Liberal Democrat | John Loveless | 158 | 8.07 | ||
| Majority | 72 | 3.68 | |||
| Turnout | 1958 | 26.38 | |||
| UKIP gain from Conservative | Swing | ||||
Gaywood South
| Party | Candidate | Votes | % | ± | |
|---|---|---|---|---|---|
| Labour | Margaret Rose Wilkinson | 835 | 37.41 | ||
| UKIP | Michael Stone | 758 | 33.96 | ||
| Conservative | Michael Langwade | 466 | 20.88 | ||
| Liberal Democrat | Richard James Coward | 173 | 7.75 | ||
| Majority | 77 | 3.45 | |||
| Turnout | 2232 | 22.83 | |||
| Labour gain from Conservative | Swing | ||||
King's Lynn North & Central
| Party | Candidate | Votes | % | ± | |
|---|---|---|---|---|---|
| Labour | David John Collis | 1026 | 72.61 | ||
| Conservative | Thomas Smith | 387 | 27.39 | ||
| Majority | 639 | 45.22 | |||
| Turnout | 1413 | 18.09 | |||
| Labour gain from Conservative | Swing | ||||
Marshland North
| Party | Candidate | Votes | % | ± | |
|---|---|---|---|---|---|
| UKIP | Fred Agnew | 751 | 37.14 | ||
| Conservative | Tony Wright | 621 | 30.71 | ||
| Independent | Sally Barbara Rust | 333 | 16.47 | ||
| Labour | Holly Rust | 317 | 15.68 | ||
| Majority | 130 | 6.43 | |||
| Turnout | 2022 | 26.48 | |||
| UKIP gain from Conservative | Swing | ||||
Marshland South
| Party | Candidate | Votes | % | ± | |
|---|---|---|---|---|---|
| Conservative | Harry Humphrey | 1375 | 65.54 | ||
| Labour | Heather Margaret Fouracre | 723 | 34.46 | ||
| Majority | 652 | 31.08 | |||
| Turnout | 2098 | 21.49 | |||
| Conservative hold | Swing | ||||
North Coast
| Party | Candidate | Votes | % | ± | |
|---|---|---|---|---|---|
| Independent | Richard Bird | 1125 | 40.06 | ||
| Conservative | Gary Sandell | 959 | 34.15 | ||
| UKIP | John Michael Crane | 455 | 16.20 | ||
| Labour | Emilia Rust | 269 | 9.58 | ||
| Majority | 166 | 5.91 | |||
| Turnout | 2808 | 37.72 | |||
| Independent gain from Conservative | Swing | ||||
North Norfolk
Cromer
| Party | Candidate | Votes | % | ± | |
|---|---|---|---|---|---|
| Conservative | Hilary Cox | 1127 | 34.7 | -7.3 | |
| UKIP | Stephen David Scott-Fawcett | 804 | 24.7 | +5.6 | |
| Liberal Democrat | Richard Payne Harbord | 585 | 18.0 | -14.3 | |
| Labour | Scott James Eastwood | 551 | 17.0 | +10.4 | |
| Green | Rupert Sandino Eris | 127 | 3.9 | +3.9 | |
| Independent | John Gaston Morgan | 56 | 1.7 | +1.7 | |
| Majority | 323 | 10.0 | +0.3 | ||
| Turnout | 3250 | 39.5 | -3.7 | ||
| Conservative hold | Swing | -6.5 | |||
Fakenham
| Party | Candidate | Votes | % | ± | |
|---|---|---|---|---|---|
| Conservative | Tom Fitzpatrick | 764 | 31.8 | -6.7 | |
| Labour | Janet Holdom | 646 | 26.9 | +17.0 | |
| UKIP | Terence Henry Comber | 639 | 26.6 | +26.6 | |
| Liberal Democrat | Gloria Margaret Diane Lisher | 249 | 10.4 | -41.2 | |
| Green | Frances Lee Collinson | 106 | 4.4 | +4.4 | |
| Majority | 118 | 4.9 | |||
| Turnout | 2404 | 29.7 | -5.8 | ||
| Conservative gain from Liberal Democrat | Swing | -11.9 | |||
Holt
| Party | Candidate | Votes | % | ± | |
|---|---|---|---|---|---|
| UKIP | Michael John Morton Baker | 1341 | 35.4 | +8.7 | |
| Conservative | Helen Eales | 991 | 26.2 | -12.6 | |
| Liberal Democrat | Sarah Elizabeth Jane Butikofer | 851 | 22.5 | +3.8 | |
| Labour | Jono Read | 399 | 10.5 | +7.9 | |
| Green | Martin Langsdon | 204 | 5.4 | -0.1 | |
| Majority | 350 | 9.2 | |||
| Turnout | 3786 | 50.8 | -3.6 | ||
| UKIP gain from Conservative | Swing | +10.7 | |||
Hoveton & Stalham
| Party | Candidate | Votes | % | ± | |
|---|---|---|---|---|---|
| Conservative | Nigel David Dixon | 833 | 31.7 | -18.1 | |
| UKIP | Duncan Charles Baker | 641 | 24.4 | +24.4 | |
| Labour | Sheila Ann Cullingham | 554 | 21.1 | +13.2 | |
| Liberal Democrat | Steve Riley | 521 | 19.8 | -22.5 | |
| Green | Alicia Jane Hull | 83 | 3.2 | +3.2 | |
| Majority | 192 | 7.3 | -0.2 | ||
| Turnout | 2632 | 36.7 | -4.8 | ||
| Conservative hold | Swing | -21.3 | |||
Melton Constable
| Party | Candidate | Votes | % | ± | |
|---|---|---|---|---|---|
| UKIP | David James Ramsbotham | 1144 | 35.7 | +20.3 | |
| Conservative | Russell John Wright | 945 | 29.5 | -11.4 | |
| Labour | Callum Edward Ringer | 568 | 17.7 | +12.4 | |
| Liberal Democrat | Jacqueline Howe | 355 | 11.1 | -18.2 | |
| Green | Thomas Andrew Silvano Robinson | 193 | 6.0 | +3.2 | |
| Majority | 199 | 6.2 | |||
| Turnout | 3205 | 42.7 | -4.2 | ||
| UKIP gain from Conservative | Swing | +15.9 | |||
Mundesley
| Party | Candidate | Votes | % | ± | |
|---|---|---|---|---|---|
| Conservative | Wyndham Northam | 742 | 26.25 | ||
| UKIP | Jason Malcom Patchett | 624 | 22.07 | ||
| Liberal Democrat | Edward Robert Maxfield | 582 | 20.59 | ||
| Independent | Graham Robert Jones | 283 | 10.01 | ||
| Labour | Liz Cornwall | 255 | 9.02 | ||
| Independent | Philip Keddell | 249 | 8.81 | ||
| Green | Peter Alan Crouch | 92 | 3.25 | ||
| Majority | 118 | 4.17 | |||
| Turnout | 2827 | 38.85 | |||
| Conservative gain from Liberal Democrat | Swing | ||||
North Walsham East
| Party | Candidate | Votes | % | ± | |
|---|---|---|---|---|---|
| Liberal Democrat | Edward Anthony Foss | 1068 | 35.11 | ||
| UKIP | Lynette Comber | 705 | 23.18 | ||
| Labour | Stephen Bernard Burke | 645 | 21.20 | ||
| Conservative | Richard Shepherd | 500 | 16.44 | ||
| Green | Paul Malcolm Oakes | 124 | 4.08 | ||
| Majority | 363 | 11.93 | |||
| Turnout | 3042 | 34.94 | |||
| Liberal Democrat hold | Swing | ||||
North Walsham West & Erpingham
| Party | Candidate | Votes | % | ± | |
|---|---|---|---|---|---|
| Liberal Democrat | John William Timewell | 804 | 28.25 | ||
| Labour Co-op | Dave Spencer | 765 | 26.88 | ||
| Conservative | Norman Smith | 591 | 20.77 | ||
| UKIP | John Arthurson | 546 | 19.18 | ||
| Green | Roger James Fredenburgh | 140 | 4.92 | ||
| Majority | 39 | 1.37 | |||
| Turnout | 2846 | 39.27 | |||
| Liberal Democrat hold | Swing | ||||
Sheringham
| Party | Candidate | Votes | % | ± | |
|---|---|---|---|---|---|
| Liberal Democrat | Brian John Hannah | 1084 | 36.8 | -22.3 | |
| Conservative | Rhodri Oliver | 850 | 28.8 | -7.9 | |
| UKIP | David Nathaniel Wilson | 557 | 18.9 | +18.9 | |
| Labour | Noel Christopher Gant | 361 | 12.2 | +8.0 | |
| Green | Alistair Kilmuir Cormack | 97 | 3.3 | +3.3 | |
| Majority | 234 | 7.9 | -14.4 | ||
| Turnout | 2949 | 43.0 | -2.3 | ||
| Liberal Democrat hold | Swing | -7.2 | |||
South Smallburgh
| Party | Candidate | Votes | % | ± | |
|---|---|---|---|---|---|
| Liberal Democrat | David Michael Thomas | 879 | 30.6 | -8.1 | |
| Conservative | Paul Rice | 844 | 29.4 | -5.1 | |
| UKIP | Jeffrey George Ernest Parkes | 768 | 26.7 | +5.8 | |
| Labour | Denise Lesley Burke | 274 | 9.5 | +3.5 | |
| Green | Ingrid Emma Dodd | 107 | 3.7 | +3.7 | |
| Majority | 35 | 1.2 | -3.0 | ||
| Turnout | 2872 | 40.1 | -6.2 | ||
| Liberal Democrat hold | Swing | -1.5 | |||
Wells
| Party | Candidate | Votes | % | ± | |
|---|---|---|---|---|---|
| Liberal Democrat | Marie Strong | 1410 | 49.0 | -1.3 | |
| Conservative | Simon Hester | 587 | 20.4 | -20.7 | |
| UKIP | Harry Askew | 561 | 19.5 | +19.5 | |
| Labour Co-op | Martyn George Morgan Sloman | 216 | 7.5 | -1.1 | |
| Green | Sharon Suzanne Harvey | 104 | 3.6 | +3.6 | |
| Majority | 823 | 28.6 | +19.4 | ||
| Turnout | 2878 | 41.9 | -5.3 | ||
| Liberal Democrat hold | Swing | +9.7 | |||
Norwich
Bowthorpe
| Party | Candidate | Votes | % | ± | |
|---|---|---|---|---|---|
| Labour | Mike Sands | 1144 | 50.64 | ||
| Conservative | Paul Anthony George Wells | 676 | 29.92 | ||
| Green | Jean Kathleen Bishop | 342 | 15.14 | ||
| Liberal Democrat | Felicity Elizabeth Hartley | 97 | 4.29 | ||
| Majority | 468 | 20.72 | |||
| Turnout | 2259 | 27.12 | |||
| Labour gain from Conservative | Swing | ||||
Catton Grove
| Party | Candidate | Votes | % | ± | |
|---|---|---|---|---|---|
| Labour | Steve Morphew | 945 | 43.91 | ||
| UKIP | Michelle Ho | 484 | 22.49 | ||
| Conservative | Christopher John Gray | 416 | 19.33 | ||
| Green | Tony Arthur Park | 208 | 9.67 | ||
| Liberal Democrat | Leigh John Tooke | 99 | 4.60 | ||
| Majority | 461 | 21.42 | |||
| Turnout | 2152 | 27.07 | |||
| Labour gain from Conservative | Swing | ||||
Crome
| Party | Candidate | Votes | % | ± | |
|---|---|---|---|---|---|
| Labour | George Nobbs | 1061 | 49.28 | ||
| UKIP | Ann Doris Williams | 506 | 23.50 | ||
| Conservative | Jonathan James Emsell | 342 | 15.88 | ||
| Green | Judith Marianna Ford | 173 | 8.04 | ||
| Liberal Democrat | Jane Denise Wright | 71 | 3.30 | ||
| Majority | 555 | 25.78 | |||
| Turnout | 2153 | 29.55 | |||
| Labour hold | Swing | ||||
Eaton
| Party | Candidate | Votes | % | ± | |
|---|---|---|---|---|---|
| Liberal Democrat | Brian Watkins | 1460 | 41.28 | ||
| Conservative | Antony Daniel Little | 1034 | 29.23 | ||
| Labour | Jack Valentine Sinclair | 647 | 18.29 | ||
| Green | Jane Isobel Saunders | 396 | 11.20 | ||
| Majority | 426 | 12.04 | |||
| Turnout | 3537 | 48.67 | |||
| Liberal Democrat hold | Swing | ||||
Lakenham
| Party | Candidate | Votes | % | ± | |
|---|---|---|---|---|---|
| Labour Co-op | Susan Jane Whitaker | 1149 | 50.62 | ||
| Liberal Democrat | David Angus Fairbairn | 539 | 23.74 | ||
| Green | Tim Michael Jones | 323 | 14.23 | ||
| Conservative | Mathew John Morris | 259 | 11.41 | ||
| Majority | 610 | 26.87 | |||
| Turnout | 2270 | 31.10 | |||
| Labour gain from Liberal Democrat | Swing | ||||
Mancroft
| Party | Candidate | Votes | % | ± | |
|---|---|---|---|---|---|
| Green | Richard Andrew Bearman | 1140 | 44.72 | ||
| Labour | Stephanie Ann Friend | 906 | 35.54 | ||
| Conservative | Thomas Samuel Stringer | 328 | 12.87 | ||
| Liberal Democrat | Jeremy Nigel Hooke | 175 | 6.87 | ||
| Majority | 234 | 9.18 | |||
| Turnout | 2549 | 31.76 | |||
| Green hold | Swing | ||||
Mile Cross
| Party | Candidate | Votes | % | ± | |
|---|---|---|---|---|---|
| Labour | Deborah Gihawi | 913 | 44.58 | ||
| Green | Richard Alan Edwards | 435 | 21.24 | ||
| UKIP | John Brian Youles | 397 | 19.38 | ||
| Conservative | Simon Harrison | 217 | 10.60 | ||
| Liberal Democrat | Sarah Cunningham | 86 | 4.20 | ||
| Majority | 478 | 23.34 | |||
| Turnout | 2048 | 26.12 | |||
| Labour gain from Green | Swing | ||||
Nelson
| Party | Candidate | Votes | % | ± | |
|---|---|---|---|---|---|
| Green | Andrew Philip Boswell | 1341 | 53.99 | ||
| Labour | Layla Dickerson | 775 | 31.20 | ||
| Conservative | Alexandra Rhiannon Davies | 221 | 8.90 | ||
| Liberal Democrat | Helen Anne Whitworth | 147 | 5.92 | ||
| Majority | 566 | 22.79 | |||
| Turnout | 2484 | 34.27 | |||
| Green hold | Swing | ||||
Sewell
| Party | Candidate | Votes | % | ± | |
|---|---|---|---|---|---|
| Labour | Julie Dawn Brociek-Coulton | 805 | 36.76 | ||
| Green | Jonathan Andrew Hill | 631 | 28.81 | ||
| UKIP | Glenn Stuart Tingle | 368 | 16.80 | ||
| Conservative | Evelyn Jean Collishaw | 322 | 14.70 | ||
| Liberal Democrat | Stuart Charles Beadle | 64 | 2.92 | ||
| Majority | 174 | 7.95 | |||
| Turnout | 2190 | 27.95 | |||
| Labour gain from Green | Swing | ||||
Thorpe Hamlet
| Party | Candidate | Votes | % | ± | |
|---|---|---|---|---|---|
| Green | Adrian Charles Dearnley | 959 | 38.13 | ||
| Labour | Eamonn Burgess | 772 | 30.70 | ||
| Conservative | Philip Allan Hardy | 567 | 22.54 | ||
| Liberal Democrat | Simon Richard Nobbs | 217 | 8.63 | ||
| Majority | 187 | 7.44 | |||
| Turnout | 2515 | 28.43 | |||
| Green hold | Swing | ||||
Town Close
| Party | Candidate | Votes | % | ± | |
|---|---|---|---|---|---|
| Labour Co-op | Emma Clare Corlett | 1234 | 39.08 | ||
| Green | Paul Vincent Neale | 1117 | 35.37 | ||
| Conservative | Barry Chochrane | 604 | 19.13 | ||
| Liberal Democrat | Roderic Beale | 203 | 6.43 | ||
| Majority | 117 | 3.70 | |||
| Turnout | 3158 | 37.39 | |||
| Labour gain from Green | Swing | ||||
University
| Party | Candidate | Votes | % | ± | |
|---|---|---|---|---|---|
| Labour | Bert Bremner | 1137 | 62.58 | +21.90 | |
| Green | Elliot Folan | 371 | 20.42 | -15.09 | |
| Conservative | Thomas Ireland Blackburne Cannon | 192 | 10.57 | -2.72 | |
| Liberal Democrat | Philip Jimenez | 117 | 6.44 | -4.09 | |
| Majority | 766 | 42.16 | |||
| Turnout | 1817 | 24.12 | |||
| Labour hold | Swing | ||||
Wensum
| Party | Candidate | Votes | % | ± | |
|---|---|---|---|---|---|
| Green | Elizabeth Morgan | 1035 | 45.94 | ||
| Labour | Martin Peek | 877 | 38.93 | ||
| Conservative | Joe David Ferris | 246 | 10.92 | ||
| Liberal Democrat | Alex Barry | 95 | 4.22 | ||
| Majority | 158 | 7.01 | |||
| Turnout | 2253 | 27.29 | |||
| Green hold | Swing | ||||
South Norfolk
Clavering
| Party | Candidate | Votes | % | ± | |
|---|---|---|---|---|---|
| Conservative | Margaret Florence Somerville | 906 | 31.36 | -8.23 | |
| UKIP | Carole Bryant | 712 | 24.65 | +7.32 | |
| Liberal Democrat | Andrew Paul Barber | 644 | 22.29 | -3.95 | |
| Labour | Stephen Charles Simmonds | 356 | 12.32 | +6.22 | |
| Green | Derek William West | 271 | 9.38 | -1.37 | |
| Majority | 194 | 6.72 | |||
| Turnout | 2889 | ||||
| Conservative hold | Swing | -7.775 | |||
Costessey
| Party | Candidate | Votes | % | ± | |
|---|---|---|---|---|---|
| Liberal Democrat | Tim East | 1108 | 38.04 | -16.77 | |
| UKIP | Tom Burkard | 614 | 21.08 | +21.08 | |
| Conservative | Andrew David Pond | 568 | 19.50 | -5.21 | |
| Labour | Cid Gibbs | 420 | 14.42 | +7.84 | |
| Green | Ian John Boreham | 203 | 6.97 | -6.64 | |
| Majority | 494 | 27.26 | |||
| Turnout | 2913 | ||||
| Liberal Democrat hold | Swing | ||||
Diss & Roydon
| Party | Candidate | Votes | % | ± | |
|---|---|---|---|---|---|
| Conservative | Jenny Chamberlin | 1115 | 44.18 | -12.85 | |
| UKIP | Sam Patel | 552 | 21.87 | +21.87 | |
| Labour | Scott Francis Huggins | 382 | 15.13 | +7.84 | |
| Liberal Democrat | Trevor Leonard Wenman | 243 | 9.63 | -26.05 | |
| Green | Jacob Andrew Eccleston | 232 | 9.19 | +9.19 | |
| Majority | 563 | 22.31 | |||
| Turnout | 2524 | ||||
| Conservative hold | Swing | ||||
East Depwade
| Party | Candidate | Votes | % | ± | |
|---|---|---|---|---|---|
| Conservative | Martin James Wilby | 1473 | 63.22 | +11.23 | |
| Liberal Democrat | Gillian Mary Artis | 459 | 19.70 | -22.26 | |
| Labour | Linda Ann Bellos | 398 | 17.08 | +11.04 | |
| Majority | 1014 | 43.52 | |||
| Turnout | 2330 | ||||
| Conservative hold | Swing | ||||
Forehoe
| Party | Candidate | Votes | % | ± | |
|---|---|---|---|---|---|
| Conservative | Colin Wayne Foulger | 825 | 28.97 | -21.30 | |
| Independent | John Herbert | 527 | 18.50 | +18.5 | |
| UKIP | Jeremy R Kent | 517 | 18.15 | +18.15 | |
| Liberal Democrat | Bob McClenning | 469 | 16.47 | -16.38 | |
| Labour | Nigel Crouch | 324 | 11.38 | +5.95 | |
| Green | Roy Arthur Walmsley | 186 | 6.53 | -4.92 | |
| Majority | 298 | 10.46 | |||
| Turnout | 2848 | ||||
| Conservative hold | Swing | ||||
Henstead
| Party | Candidate | Votes | % | ± | |
|---|---|---|---|---|---|
| Conservative | Roger Ackworth Smith | 1111 | 42.32 | -6.90 | |
| UKIP | Ronald John Murphy | 580 | 22.10 | +22.10 | |
| Labour | Nicola Jeannette Fowler | 436 | 16.61 | +9.31 | |
| Liberal Democrat | Philippa Gray Kathleen Grant | 299 | 11.39 | -19.47 | |
| Independent | Ingo Wagenknecht | 199 | 7.58 | +7.58 | |
| Majority | 531 | 20.23 | |||
| Turnout | 2625 | ||||
| Conservative hold | Swing | ||||
Hingham
| Party | Candidate | Votes | % | ± | |
|---|---|---|---|---|---|
| Conservative | Margaret Dewsbury | 1284 | 59.69 | +2.99 | |
| Green | Peter Alan Eldridge | 404 | 18.78 | +18.78 | |
| Labour | Graham George Hayden | 294 | 13.67 | +5.30 | |
| Liberal Democrat | Paul Wynter Blathwayt | 169 | 7.86 | -27.07 | |
| Majority | 880 | 40.91 | |||
| Turnout | 2151 | ||||
| Conservative hold | Swing | ||||
Humbleyard
| Party | Candidate | Votes | % | ± | |
|---|---|---|---|---|---|
| Conservative | Judith Margaret Virgo | 1306 | 45.46 | -6.49 | |
| UKIP | Ralph Harvey Evans | 577 | 20.08 | +20.08 | |
| Labour | Victoria Smillie | 390 | 13.57 | +5.56 | |
| Green | Andrew John Panes | 352 | 12.25 | -3.21 | |
| Liberal Democrat | Margaret Grimmer Pitcher | 248 | 8.63 | -15.95 | |
| Majority | 729 | 25.37 | |||
| Turnout | 2873 | ||||
| Conservative hold | Swing | ||||
Loddon
| Party | Candidate | Votes | % | ± | |
|---|---|---|---|---|---|
| Conservative | Adrian John Gunson | 2001 | 45.46 | -13.92 | |
| UKIP | Alan James Baugh | 594 | 18.91 | +18.91 | |
| Labour | David Reekie | 383 | 12.19 | +6.33 | |
| Liberal Democrat | Judith Ann Tryggvason | 163 | 5.19 | -6.91 | |
| Majority | 1407 | 44.79 | |||
| Turnout | 3141 | ||||
| Conservative hold | Swing | ||||
Long Stratton
| Party | Candidate | Votes | % | ± | |
|---|---|---|---|---|---|
| Conservative | Alison Mary Thomas | 1115 | 42.80 | -14.83 | |
| UKIP | David Thomas Thornton | 658 | 25.26 | +25.26 | |
| Labour Co-op | Deborah Helen Sacks | 371 | 14.24 | +6.85 | |
| Liberal Democrat | Linden Alan Parker | 269 | 10.33 | -24.65 | |
| Green | Daniel Paul Scott | 192 | 7.37 | +7.37 | |
| Majority | 457 | 17.54 | |||
| Turnout | 2605 | ||||
| Conservative hold | Swing | ||||
West Depwade
| Party | Candidate | Votes | % | ± | |
|---|---|---|---|---|---|
| Conservative | Bev Spratt | 1531 | 46.20 | -14.83 | |
| UKIP | Ashley Christopher | 829 | 25.02 | +25.02 | |
| Liberal Democrat | Ian Victor Spratt | 508 | 15.33 | -12.66 | |
| Labour | Pamela Ann Reekie | 446 | 13.46 | +5.94 | |
| Majority | 702 | 21.18 | |||
| Turnout | 3314 | ||||
| Conservative hold | Swing | ||||
Wymondham
| Party | Candidate | Votes | % | ± | |
|---|---|---|---|---|---|
| Conservative | Joe Mooney | 1392 | 38.13 | -25.29 | |
| Independent | Andy Gardiner | 1203 | 32.95 | +32.95 | |
| UKIP | Peter Colby | 503 | 13.78 | +13.78 | |
| Labour | Kevin Patrick O'Grady | 344 | 9.42 | +0.61 | |
| Liberal Democrat | Paul James Seeman | 85 | 2.33 | -14.65 | |
| Independent | Paco Davila Davila | 62 | 1.70 | +1.70 | |
| Independent | Mike Welton | 62 | 1.70 | +1.70 | |
| Majority | 189 | 5.18 | |||
| Turnout | 3651 | ||||
| Conservative hold | Swing | ||||
References
- ↑ "The Representation of the People (Form of Canvass) (England and Wales) Regulations 2006, Schedule Part 1". Legislation.gov.uk. 13 October 2011. Retrieved 18 April 2012.
- ↑ "I have two homes. Can I register at both addresses?". The Electoral Commission. Retrieved 5 January 2011.
- ↑ "Local elections 2013". BBC News. Retrieved 15 April 2013.
- ↑ Bristow, Tom. "Parties announce Norfolk County Council leaders". EDP24. Retrieved 8 May 2013.
- ↑ Grimmer, Dan. "Norfolk County Council's UKIP group picks its leader". EDP24. Retrieved 8 May 2013.
- ↑ http://www.bbc.co.uk/news/uk-england-norfolk-22652402
- ↑ "Candidates". Norfolk County Council. Retrieved 29 April 2013.
- ↑ "Table of Results". Norfolk County Council Elections 2013. Norfolk County Council. Retrieved 8 May 2013.
| Norfolk County Council | |
|---|---|
| Breckland District Council |
|
| Broadland District Council |
|
| Great Yarmouth Borough Council | |
| King's Lynn and West Norfolk Borough Council |
|
| North Norfolk District Council | |
| Norwich City Council | |
| South Norfolk District Council | |
| |