Missouri Democratic Primary, 2008
|
| February 5, 2008 (2008-02-05) |
|
|
|
|
The Missouri Democratic Presidential Primary took place on Super Tuesday, February 5, 2008, with 72 delegates at stake. The winner in each of Missouri's nine congressional districts was awarded all of that district's delegates, which totaled 47. Another 25 delegates were awarded to the statewide winner, Barack Obama. The 72 delegates represented Missouri at the Democratic National Convention in Denver, Colorado. Sixteen other unpledged delegates, known as superdelegates, also attended the convention and cast their votes as well.
Polls
Results
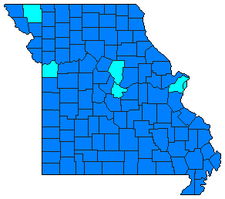
2008 Missouri Democratic primary county map.
Clinton had a large initial lead as the rural precincts began reporting, leading several news groups to call the primary for her.[1] However, Obama rallied from behind as the numbers began to come in from the heavily African American precincts in and around St. Louis to win by just under 12,000 votes. The pledged delegates were evenly split between the two candidates. Geographically, Clinton won 109 of the 115 counties in the state, while Obama carried St. Louis, Kansas City and the areas around the college towns of Columbia and Maryville.
Analysis
Elections in Missouri have historically always been rather close, and the Democratic Primary of 2008 proved no exception to that trend as Barack Obama of neighboring Illinois just barely nipped Hillary Rodham Clinton, who has roots in neighboring Arkansas, by fewer than 12,000 votes. The popular vote was so close, however, that both candidates ended up evenly splitting the state’s 72 delegates. According to exit polls, 76 percent of voters in the Missouri Democratic Primary were Caucasians and they opted for Clinton by a margin of 57-39 compared to the 17 percent of African Americans who backed Obama by a margin of 84-15. Regarding age, Obama won younger voters under the age of 40 by a margin of 64-32; Clinton won voters ages 40–49 by a margin of 52-47 and tied Obama among voters 50-64, and she won senior citizens ages 65 and over by a margin of 63-32. Pertaining to socioeconomic class, Clinton won extremely poor voters making less than $15,000 a year by a margin of 52-45 while Obama won voters making $15,000-$30,000 by a margin of 55-42. Clinton won middle class voters making $30,000-$50,000 by a margin of 49-48, while Obama won upper middle class and more affluent voters making over $50,000 by a margin of 54-43. As it relates to educational attainment, Clinton won less educated voters (those who did not graduate high school backed her by a margin of 55-42 compared to those who at least graduated high school who went for her 53-44) while Obama won more educated voters (those who had some college and/or an associate’s degree backed him 52-45; college graduates went for him 64-30, and those who had a postgraduate degree supported him 67-32). Self-identified Democrats, who made up 73 percent of the total turnout in the Democratic Primary, backed Clinton by a margin of 50-47 compared to the 22 percent of Independents who supported Obama by a margin of 67-30 and self-identified Republicans, who comprised 6 percent of the electorate, who supported Obama by a margin of 75-21. Obama won self-identified liberals by a margin of 58-39 and self-identified conservatives by a margin of 58-38 while Clinton won moderates by a margin of 49-48. Regarding religion, Obama won almost all major denominations – other Christians backed him by a margin of 63-33; other religions supported him by a margin of 61-36; and atheists/agnostics went for him by a margin of 51-46. Ironically, Roman Catholics in Missouri also supported Obama by a margin of 50-46; this religious bloc solidly favored Clinton nationwide. Conversely, Clinton won Protestants by a margin of 55-43, again ironic seeing as how most Protestants favored Obama nationwide.
Obama did best in and around St. Louis, particularly in the urbanized city with a substantial African American community which gave him 71.09 percent of the vote. He also performed extremely well in St. Louis County, taking in 62.78 percent of the vote in the most affluent county in Missouri which contains many of the St. Louis Suburbs. Obama also won Jackson County, which contains Kansas City, with 55.42 percent of the vote; Obama carried Kansas City but lost the rest of Jackson County. Obama also performed strongly in Boone County, which contains Columbia and is home to the University of Missouri-Columbia, the flagship of the Missouri public university system. He also won neighboring Cole County, which contains Jefferson City, as well as Nodaway County in Northwestern Missouri which contains Northwestern Missouri State University in Maryville.
Clinton performed extremely well geographically all throughout the rest of the state, especially in the more rural parts of the state outside of Kansas City and St. Louis. She won the Kansas City Suburbs, including St. Joseph in Buchanan County and some of the St. Louis Exurbs, including St. Charles County. Her best performance in the state was in Southeast Missouri where eight counties gave her over 70 percent of the vote. This area of the state, most of which is a part of the 8th District in the U.S. Congress, is heavily Democratic at the local level as Democrats control all county offices in all but four of the 28 counties in the congressional district. It is also fairly Democratic-leaning at the state level, going handily to Governor Jay Nixon in the Missouri Gubernatorial Election of 2008, and while Southeast Missouri was won by Republicans George W. Bush and John McCain from 2000–2008, the region gave Bill Clinton one of his largest margins of victory in 1992 and 1996. The area has many of the demographics in Clinton’s favor – it is predominantly white and made up of working-class individuals who tend to be politically moderate on several issues. She also performed well in Southwest Missouri, the most conservative part of the state, in and around Springfield and Joplin. Northern Missouri also strongly backed Clinton.
Endorsements
Democrats from Missouri’s congressional delegation were evenly split, a true testament to the outcome of the primary. U.S. Representative William Lacy Clay, Jr. of the 1st District, who is African American, as well as U.S. Representative Russ Carnahan of the 3rd District, endorsed Barack Obama. Both of their districts, which take in most and parts of St. Louis, were won by Obama in the Missouri Democratic Primary. U.S. Representative Emanuel Cleaver of the 5th District, who is African American, as well as U.S. Representative Ike Skelton of the 4th District, endorsed Hillary Rodham Clinton. Cleaver’s district went for Obama while Skelton’s district was handily won by Clinton.
U.S. Senator Claire McCaskill came out as an early endorser of Barack Obama as well, citing pressure from her younger daughter as the main reason why she decided to endorse him.
County by County Results
- Hillary Rodham Clinton's strongest performance in Missouri was Dunklin County, located in the Bootheel of Southeast Missouri. With its close proximity to Arkansas, Dunklin County backed Clinton with 78.44 percent of the vote while Barack Obama only received 18.31 percent. Dunklin County was also Obama's worst performance in Missouri.
- Barack Obama's strongest performance in Missouri was St. Louis City. Predominantly urban with a substantial African American population, St. Louis City backed Obama with 71.09 percent of the vote while Hillary Clinton only received 27.25 percent. It was both Clinton and John Edwards's worst performance in Missouri.
- Although he didn't carry it, Shelby County in Northeast Missouri was John Edwards's strongest performance in Missouri, as he received 7.57 percent of the vote here. Clinton, however, carried Shelby County with 54.37 percent of the vote.
- The closest county in Missouri was Howard County, located just west of Boone County. Clinton won Howard County with 48.37 percent of the vote while Obama received 46.61 percent, a 1.77-percent difference.
See also
References