Mass spectral interpretation

Mass spectral interpretation is the systematic analysis of mass spectra for molecule identification.[1][2] It is most often used for the identification of organic compounds from electron ionization mass spectrometry.[3][4] Organic chemists obtain mass spectra of chemical compounds as part of structure elucidation and the analysis is part of many organic chemistry curricula.
Electron ionization
Electron ionization (EI) is a type of mass spectrometer ion source in which a beam of electrons interacts with a gas phase molecule M to form an ion according to

with a molecular ion .[5] The superscript "+" indicates the ion charge and the superscript "•" indicates an unpaired electron of the radical ion. The energy of the electron beam is typically 70 electronvolts and the ionization process typically produces extensive fragmentation of the chemical bonds of the molecule.

The peak in the mass spectrum with the greatest intensity is called the base peak. The molecular ion is often, but not always, the base peak.
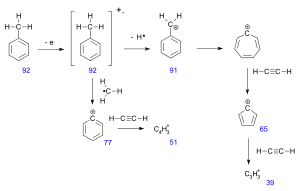
Identification of the molecular ion can be difficult. Examining organic compounds, the relative intensity of the molecular ion peak diminishes with branching and with increasing mass in a homologous series. In the spectrum for toluene for example, the molecular ion peak is located at 92 m/z corresponding to its molecular mass. Molecular ion peaks are also often preceded by a M-1 or M-2 peak resulting from loss of a hydrogen radical or dihydrogen.
More peaks may be visible with m/z larger than the molecular ion peak due to isotope distributions, called isotope peaks. The value of 92 in the toluene example corresponds to the monoisotopic mass of a molecule of toluene entirely composed of the most abundant isotopes (1H and 12C). The so-called M+1 peak corresponds to a fraction of the molecules with one higher isotope incorporated (2H or 13C) and the M+2 peak has two higher isotopes. The natural abundance of the higher isotopes is low for frequently encountered elements such as hydrogen, carbon and nitrogen and the intensity of isotope peaks subsequently low. In halogens on the other hand, higher isotopes have a large abundance which results in a specific mass signature in the mass spectrum of halogen containing compounds.
Peaks with mass less than the molecular ion are the result of fragmentation of the molecule. Many reaction pathways exist for fragmentation, but only newly formed cations will show up in the mass spectrum, not radical fragments or neutral fragments.
Metastable peaks are broad peaks with low intensity at non-integer mass values. These peaks result from ions with lifetimes shorter than the time needed to traverse the distance between ionization chamber and the detector.
Fragmentation

The fragmentation pattern of the spectra beside the determination of the molar weight of an unknown compound also suitable to give structural information, especially in combination with the calculation of the degree of unsaturation from the molecular formula (when available). Neutral fragments frequently lost are carbon monoxide, ethylene, water, ammonia, and hydrogen sulfide.
Fragmentation arises from a homolysis processes. An example is the cleavage of carbon-carbon bonds next to a heteroatom

In this depiction, single-electron movements are indicated by a single-headed arrow.

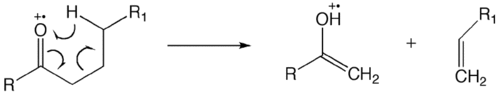
The McLafferty rearrangement can occur in a molecule containing a keto-group and involves β-cleavage, with the gain of the γ-hydrogen atom.[6][7][8]
Ion-neutral complex formation involves bond homolysis or bond heterolysis, in which the fragments do not have enough kinetic energy to separate and, instead, reaction with one another like an ion-molecule reaction.
Rules
Some general rules:
- Cleavage occurs at alkyl substituted carbons reflecting the order generally observed in carbocations.
- Double bonds and arene fragments tend to resist fragmentation.
- Allylic cations are stable and resist fragmentation.
Nitrogen rule
The nitrogen rule states that organic molecules that contain hydrogen, carbon, nitrogen, oxygen, silicon, phosphorus, sulfur, and the halogens have an odd nominal mass if they have an odd number of nitrogen atoms or an even mass if they have an even number of nitrogen atoms are present.[9][10] The nitrogen rule is true for structures in which all of the atoms in the molecule have a number of covalent bonds equal to their standard valency, counting each sigma bond and pi bond as a separate covalent bond.
Rings plus double bonds
From degree of unsaturation principles, molecules containing only carbon, hydrogen, halogens, nitrogen, and oxygen follow the formula

where C is the number of carbons, H is the number of hydrogens, X is the number of halogens, and N is the number of nitrogen.
Even electron rule
The even electron rule states that ions with an even number of electrons (cations but not radical ions) tend to form even-electron fragment ions and odd-electron ions (radical ions) form odd-electron ions or even-electron ions.[11] Even-electron species tend to fragment to another even-electron cation and a neutral molecule rather than two odd-electron species.
Rule of 13
The Rule of 13 is a simple procedure for tabulating possible chemical formula for a given molecular mass.[12] The first step in applying the rule is to assume that only carbon and hydrogen are present in the molecule and that the molecule comprises some number of CH "units" each of which has a nominal mass of 13. If the molecular weight of the molecule in question is M, the number of possible CH units is n and

where r is the remainder. The base formula for the molecule is

and the degree of unsaturation is

A negative value of u indicates the presence of heteroatoms in the molecule and a half-integer value of u indicates the presence of an odd number of nitrogen atoms. On addition of heteroatoms, the molecular formula is adjusted by the equivalent mass of carbon and hydrogen. For example, adding N requires removing CH2 and adding O requires removing CH4.
Isotope effects
Isotope peaks within a spectra can help in structure elucidation. Compounds containing halogens (especially chlorine and bromine) can produce very distinct isotope peaks. The mass spectrum of methylbromide has two prominent peaks of equal intensity at m/z 94 (M) and 96 (M+2) and then two more at 79 and 81 belonging to the bromine fragment.
Even when compounds only contain elements with less intense isotope peaks (carbon or oxygen), the distribution of these peaks can be used to assign the spectrum to the correct compound. For example, two compounds with identical mass of 150 Da, C8H12N3+ and C9H10O2+, will have two different M+2 intensities which makes it possible to distinguish between them.
Electrospray and atmospheric pressure chemical ionization
Electrospray and atmospheric pressure chemical ionization have different rules for spectrum interpretation due the different ionization mechanisms.[13]
See also
- COmponent Detection Algorithm (CODA), an algorithm used in mass spectrometry data analysis
- List of mass spectrometry software
References
- ↑ Terrence A. Lee (4 February 1998). A Beginner's Guide to Mass Spectral Interpretation. John Wiley & Sons. ISBN 978-0-471-97629-5.
- ↑ Fred W. McLafferty (1 January 1993). Interpretation of Mass Spectra. University Science Books. ISBN 978-0-935702-25-5.
- ↑ Spectrometric identification of organic compounds Silverstein, Bassler, Morrill 4th Ed.
- ↑ Organic spectroscopy William Kemp 2nd Ed. ISBN 0-333-42171-X
- ↑ IUPAC, Compendium of Chemical Terminology, 2nd ed. (the "Gold Book") (1997). Online corrected version: (2006–) "electron ionization".
- ↑ F. W. McLafferty (1959). "Mass Spectrometric Analysis. Molecular Rearrangements". Anal. Chem. 31 (1): 82–87. doi:10.1021/ac60145a015.
- ↑ Gross ML (2004). "Focus in honor of Fred McLafferty, 2003 Distinguished Contribution awardee, for the discovery of the "McLafferty Rearrangement"". J. Am. Soc. Mass Spectrom. 15 (7): 951–5. doi:10.1016/j.jasms.2004.05.009. PMID 15234352.
- ↑ Nibbering NM (2004). "The McLafferty rearrangement: a personal recollection". J. Am. Soc. Mass Spectrom. 15 (7): 956–8. doi:10.1016/j.jasms.2004.04.025. PMID 15234353.
- ↑ Tureček, František; McLafferty, Fred W. (1993). Interpretation of mass spectra. Sausalito, Calif: University Science Books. pp. 37–38. ISBN 0-935702-25-3.
- ↑ David O. Sparkman (2007). Mass Spectrometry Desk Reference. Pittsburgh: Global View Pub. p. 64. ISBN 0-9660813-9-0.
- ↑ Karni, Miriam; Mandelbaum, Asher (1980). "The 'even-electron rule'". Organic Mass Spectrometry. 15 (2): 53–64. doi:10.1002/oms.1210150202. ISSN 0030-493X.
- ↑ Bright, J. W.; Chen, E. C. M. (1983). "Mass spectral interpretation using the "rule of '13'"". Journal of Chemical Education. 60 (7): 557. doi:10.1021/ed060p557. ISSN 0021-9584.
- ↑ Holčapek, Michal; Jirásko, Robert; Lísa, Miroslav (2010). "Basic rules for the interpretation of atmospheric pressure ionization mass spectra of small molecules". Journal of Chromatography A. 1217 (25): 3908–3921. doi:10.1016/j.chroma.2010.02.049. ISSN 0021-9673.