Market segmentation
Market segmentation is the process of dividing a broad consumer or business market, normally consisting of existing and potential customers, into sub-groups of consumers (known as segments) based on some type of shared characteristics. In dividing or segmenting markets, researchers typically look for shared characteristics such as common needs, common interests, similar lifestyles or even similar demographic profiles. The overall aim of segmentation is to identify high yield segments – that is, those segments that are likely to be the most profitable or that have growth potential – so that these can be selected for special attention (i.e. become target markets). Many different ways to segment a market have been identified. Business-to-business (B2B) sellers might segment the market into different types of businesses or countries. While business to consumer (B2C) seller might segment the market into demographic segments, lifestyle segments, behavioral segments or any other meaningful segment.

Market segmentation assumes that different market segments require different marketing programs – that is, different offers, prices, promotion, distribution or some combination of marketing variables. Market segmentation is not only designed to identify the most profitable segments, but also to develop profiles of key segments in order to better understand their needs and purchase motivations. Insights from segmentation analysis are subsequently used to support marketing strategy development and planning. Many marketers use the S-T-P approach; Segmentation→ Targeting → Positioning to provide the framework for marketing planning objectives. That is, a market is segmented, one or more segments are selected for targeting, and products or services are positioned in a way that resonates with the selected target market or markets.
Market segmentation: Historical overview
The business historian, Richard S. Tedlow, identifies four stages in the evolution of market segmentation:[1]
.jpg)
- Fragmentation (pre 1880s): The economy was characterised by small regional suppliers who sold goods on a local or regional basis
- Unification or Mass Marketing (1880s-1920s): As transportation systems improved, the economy became unified. Standardised, branded goods were distributed at a national level. Manufacturers tended to insist on strict standardisation in order to achieve scale economies with a view to penetrating markets in the early stages of a product's life cycle. e.g. the Model T Ford
- Segmentation (1920s-1980s): As market size increased, manufacturers were able to produce different models pitched at different quality points to meet the needs of various demographic and psychographic market segments. This is the era of market differentiation based on demographic, socio-economic and lifestyle factors.
- Hyper-segmentation (1980s+): a shift towards the definition of ever more narrow market segments. Technological advancements, especially in the area of digital communications, allows marketers to communicate to individual consumers or very small groups.
Contemporary market segmentation emerged in the twentieth century as marketers responded to two pressing issues. Demographic and purchasing data were available for groups but rarely for individuals and secondly, advertising and distribution channels were available for groups, but rarely for single consumers and so brand marketers approached the task from a tactical viewpoint. Thus, segmentation was essentially a brand-driven process. Until recently, most segmentation approaches have retained this tactical perspective in that they address immediate short-term questions; typically decisions about the current “market served” and are concerned with informing marketing mix decisions.
Criticisms of market segmentation
The limitations of conventional segmentation have been well documented in the literature.[2] Perennial criticisms include:
- that it is no better than mass marketing at building brands [3]
- that in competitive markets, segments rarely exhibit major differences in the way they use brands [4]
- that it fails to identify sufficiently narrow clusters [5]
- geographic/demographic segmentation is overly descriptive and lacks sufficient insights into the motivations necessary to drive communications strategy [6]
- difficulties with market dynamics, notably the instability of segments over time [7][8] and structural change which leads to segment creep and membership migration as individuals move from one segment to another [9]
Market segmentation has many critics. But in spite of its limitations, market segmentation remains one of the enduring concepts in marketing and continues to be widely used in practice. One American study, for example, suggested that almost 60 percent of senior executives had used market segmentation in the past two years.[10]
Market segmentation strategy
(Also see niche market and mass marketing)
A key consideration for marketers is whether to segment or not to segment. Depending on company philosophy, resources, product type or market characteristics, a businesses may develop an undifferentiated approach or differentiated approach. In an undifferentiated approach (also known as mass marketing), the marketer ignores segmentation and develops a product that meets the needs of the largest number of buyers.[11] In a differentiated approach the firm targets one or more market segments, and develops separate offers for each segment.[12]

In consumer marketing, it is difficult to find examples of undifferentiated approaches. Even goods such as salt and sugar, which were once treated as commodities, are now highly differentiated. Consumers can purchase a variety of salt products; cooking salt, table salt, sea-salt, rock salt, kosher salt, mineral salt, herbal or vegetable salts, iodized salt, salt substitutes and if that is not enough choice, at the brand level, gourmet cooks are likely to make a major distinction between Maldon salt and other competing brands.The following table outlines the main strategic approaches.
Table 1: Main Strategic Approaches to Segmentation[13]
| Number of Segments | Segmentation Strategy | Comments |
|---|---|---|
| Zero | Undifferentiated strategy | Mass marketing: no segmentation |
| One | Focus strategy | Niche marketing: focus efforts on a small, tightly defined target market |
| Two or more | Differentiated strategy | Multiple niches: focus efforts on 2 or more, tightly defined targets |
| Thousands | Hypersegmentation | One-to-one marketing: customise the offer for each individual customer |
A number of factors are likely to affect a company's segmentation strategy:[14]
- Company resources: When resources are restricted, a concentrated strategy may be more effective.
- Product variability: For highly uniform products (such as sugar or steel) an undifferentiated marketing may be more appropriate. For products that can be differentiated, (such as cars) then either a differentiated or concentrated approach is indicated.
- Product life cycle: For new products, one version may be used at the launch stage, but this may be expanded to a more segmented approach over time. As more competitors enter the market, it may be necessary to differentiate.
- Market characteristics: When all buyers have similar tastes, or are unwilling to pay a premium for different quality, then undifferentiated marketing is indicated.
- Competitive activity: When competitors apply differentiated or concentrated market segmentation, using undifferentiated marketing may prove to be fatal. A company should consider whether it can use a different market segmentation approach.
Market segmentation process: S-T-P
The process of segmenting the market is deceptively simple. Seven basic steps describe the entire process including segmentation, targeting and positioning. In practice, however, the task can be very laborious since it involves poring over loads of data, and requires a great deal of skill in analysis, interpretation and some judgement. Although a great deal of analysis needs to be undertaken, and many decisions need to be made, marketers tend to use the so-called S-T-P process, that is Segmentation→ Targeting → Positioning, as a broad framework for simplifying the process [15] and outlined here:
Segmentation
1. Identify market (also known as the universe) to be segmented.
2. Identify, select and apply base or bases to be used in the segmentation
3. Develop segment profiles
Targeting
4. Evaluate each segment's attractiveness
5. Select segment or segments to be targeted
Positioning
6. Identify optimal positioning for each segment
7. Develop the marketing program for each segment
Identifying the market to be segmented
See also Total addressable market Serviceable available market Bass diffusion model
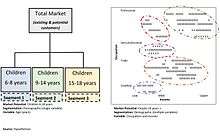
The market for a given product or service known as the market potential or the Total Addressable Market (TAM). Given that this is the market to be segmented, the market analyst should begin by identifying the size of the potential market. For existing products and services, estimating the size and value of the market potential is relatively straight forward. However, estimating the market potential can be very challenging when a product or service is totally new to the market and there are no historical data on which to base forecasts.
A basic approach is to first assess the size of the broad population, then estimate the percentage likely to use the product or service and finally to estimate the revenue potential. For example, when the ride-sharing company, Uber, first entered the market, the owners assumed that Uber would be a substitute for taxis and hire cars. Accordingly they calculated Uber’s TAM based on the size of the existing taxi and car service business, which they estimated at $100 billion. They then made a conservative estimate that the company could reach 10 percent share of market and used this to estimate the expected revenue.[16]

Another approach is to use historical analogy.[17] For example, the manufacturer of HDTV might assume that the number of consumers willing to adopt high definition TV will be similar to the adoption rate for Color TV. Data for household penetration of TV, Radio, PCs and other communications technologies is readily available from government statistics departments to support this type of analysis. Finding useful analogies can be challenging because every market is unique. However, analogous product adoption and growth rates can provide the analyst with benchmark estimates, and can be used to cross validate other methods that might be used to forecast sales or market size.
A more robust technique for estimating the market potential is known as the Bass Model. The Bass equation is as follows:[18]
- N(t) – N(t−1) = [p + qN(t−1)/m] x [m – N(t−1)]
- Where:
- N(t)= the number of adopters in the current time period (t)
- N(t−1)= the number of adopters in the previous time period (t-1)
- p = the coefficient of innovation
- q = the coefficient of imitation (the social contagion influence)
- m = an estimate of the number of eventual adopters
- Where:
The major challenge with the Bass model is estimating the parameters for p and q. However, the Bass model has been so widely used in empirical studies that the values of p and q for more than 50 consumer and industrial categories have been determined and are widely published in tables. [19] The average value for p is 0.037 and for q is 0.327.
Bases for segmenting consumer markets
A major step in the segmentation process is the selection of a suitable base. In this step, marketers are looking for a means of achieving internal homogeneity (similarity within the segments), and external heterogeneity (differences between segments).[20] In other words, they are searching for a process that minimises differences between members of a segment and maximises differences between each segment. In addition, the segmentation approach must yield segments that are meaningful for the specific marketing problem or situation. For example, a person's hair colour may be a relevant base for a shampoo manufacturer, but it would not be relevant for a seller of financial services. Selecting the right base requires a good deal of thought and a basic understanding of the market to be segmented.
In reality, marketers can segment the market using any base or variable provided that it is identifiable, measurable, actionable and stable.[21] For example, some fashion houses have segmented the market using women's dress size as a variable.[22] However, the most common bases for segmenting consumer markets include: geographics, demographics, psychographics and behavior. Marketers normally select a single base for the segmentation analysis, although, some bases can be combined into a single segmentation with care. For example, geographics and demographics are often combined, but other bases are rarely combined. Given that psychographics includes demographic variables such as age, gender and income as well as attitudinal and behavioral variables, it makes little logical sense to combine psychographics with demographics or other bases. Any attempt to use combined bases needs careful consideration and a logical foundation.
| Segmentation Base | Brief explanation of base (with examples of variables used) | Typical segments |
| Demographic | Quantifiable population characteristics. (e.g. age, gender, income, education, socio-economic status, family size or situation). | e.g Young, Upwardly-mobile, Prosperous, Professionals (YUPPY); Double Income No Kids (DINKS); Greying, Leisured And Moneyed (GLAMS); Empty- nester, Full-nester |
| Geographic | Physical location or region (e.g. country, state, region, city, suburb, postcode). | e.g New Yorkers; Remote, outback Australians; Urbanites, Inner-city dwellers |
| Geo-demographic or geoclusters | Combination of geographic & demographic variables. | e.g Rural farmers, Urban professionals, 'sea-changers', 'tree-changers' |
| Psychographics | Lifestyle, social or personality characteristics. (typically includes basic demographic descriptors) | e.g Socially -Aware; Traditionalists, Conservatives, Active 'club-going' young professionals |
| Behavioural | Purchasing, consumption or usage behaviour. (e.g. Needs-based, benefit-sought, usage occasion, purchase frequency, customer loyalty, buyer readiness). | e.g Tech-savvy (aka tech-heads); Heavy users, Enthusiasts; Early adopters, Opinion Leaders, Luxury-seekers, Price-conscious, Quality-conscious, Time-poor |
Source: Based on Wikiversity,Marketing [E-Book], c. 2015
The following sections provide a detailed description of the most common forms of consumer market segmentation.
Geographic segmentation
(Also see Geodemographic segmentation)
Geographic segmentation divides markets according to geographic criteria. In practice, markets can be segmented as broadly as continents and as narrowly as neighborhoods or postal codes. Typical geographic variables include:
- Country e.g. USA, UK, China, Japan, South Korea, Malaysia, Singapore, Australia, New Zealand
- Region e.g. North, North-west, Mid-west, South, Central
- Population density: e.g. central business district (CBD), urban, suburban, rural, regional
- City or town size: e.g. under 1,000; 1,000- 5,000; 5,000 – 10,000... 1,000,000 – 3,000,000 and over 3,000,000
- Climatic zone: e.g. Mediterranean, Temperate, Sub-Tropical, Tropical, Polar,
The geo-cluster approach (also called geo-demographic segmentation) combines demographic data with geographic data to create richer, more detailed profiles.[23] Geo-cluster models break down an area into groups of households based on the assumption that people in any given neighbourhood are likely to exhibit similarities in their demographic composition and other household characteristics.
Geographic segmentation may be considered the first step in international marketing, where marketers must decide whether to adapt their existing products and marketing programs for the unique needs of distinct geographic markets. Tourism Marketing Boards often segment international visitors based on their country of origin. By way of example, Tourism Australia undertakes marketing in 16 core geographic markets; of which China, UK, US, NZ and Japan have been identified as priority segments because they have the greatest potential for growth and are extremely profitable segments with higher than average expenditure per visit. Tourism Australia carries out extensive research on each of these segments and develops rich profiles of high priority segments to better understand their needs and how they make travel decisions.[24] Insights from this analysis are used in travel product development, allocation of promotional budgets, advertising strategy and in broader urban planning decisions. For example, in light of the numbers of Japanese visitors, the city of Melbourne has erected Japanese signage in tourist precincts.
A number of proprietary geo-demographic packages are available for commercial use. Examples include Acorn in the United Kingdom, Experian's Mosaic (geodemography) Segmentation (active in North America, South America, UK, Europe, South Africa and parts of Asia-Pacific ) [25] or Helix Personas (Australia, New Zealand and Indonesia).[26] It should be noted that all these commercial packages combine geographics with behavioural, demographic and attitudinal data and yield a very large number of segments. For instance, the NZ Helix Personas segments New Zealand's relatively small population into 51 discrete personality profiles across seven geographic communities ( too numerous to itemise on this page). These commercial databases typically allow prospective clients access to limited scale demonstrations, and readers interested in learning more about how geo-demographic segmentation can benefit marketers and planners, are advised to experiment with the online demonstration software via these companies' websites.
Geographic segmentation is widely used in direct marketing campaigns to identify areas which are potential candidates for personal selling, letter-box distribution or direct mail. Geo-cluster segmentation is widely used by Governments and public sector departments such as urban planning, health authorities, police, criminal justice departments, telecommunications and public utility organisations such as water boards.
Demographic segmentation
Segmentation according to demography is based on consumer- demographic variables such as age, income, family size, socio-economic status, etc.[27] Demographic segmentation assumes that consumers with similar demographic profiles will exhibit similar purchasing patterns, motivations, interests and lifestyles and that these characteristics will translate into similar product/brand preferences. In practice, demographic segmentation can potentially employ any variable that is used by the nation's census collectors. Typical demographic variables and their descriptors are as follows:
- Age: e.g. Under 5, 5–8 years, 9–12 years, 13–17 years, 18-24, 25-29, 30-39, 40-49, 50-59, 60+
- Gender: Male, Female
- Occupation: Professional, self-employed, semi-professional, clerical/ admin, sales, trades, mining, primary producer, student, home duties, unemployed, retired
- Social class (or socio-economic status):
- Marital Status: Single, married, divorced, widowed
- Family Life-stage: Young single; Young married with no children; Young family with children under 5 years; Older married with children; Older married with no children living at home, Older living alone
- Family size/ number of dependants: 0, 1-2, 3-4, 5+
- Income: Under $10,000; 10,000- 20,000; 20,001- 30,000; 30,001-40,000, 40,001- 50,000 etc
- Educational attainment: Primary school; Some secondary, Completed secondary, Some university, Degree; Post graduate or higher degree
- Home ownership: Renting, Own home with mortgage, Home owned outright
- Ethnicity: Asian, African, Aboriginal, Polynesian, Melanesian, Latin-American, African-American, American Indian etc
- Religion: Catholic, Protestant, Muslim, Jewish, Buddhist, Hindu, Other

The Scouting movement offers an excellent example of demographic segmentation in practice. Scouts develops different products based on relevant age groups. In Australia, the segments are Joeys for boys and girls aged 6–7 years; Cubs for children ages 8– 10 years; Scouts for those aged 11–14 years; Venturers ages 15–17 years and Rovers aged 18–25 years.[28] The Scouting movement provides members of each cohort with different uniforms and develops different activity programs for each segment. Scouts even cater to the needs of the over 25s offering them roles as scout leaders or volunteers. Scouts' segmentation is an example of a simple demographic segmentation analysis which utilises just a single variable, namely age.
In practice, most demographic segmentation utilises a combination of demographic variables. For instance, a segmentation approach developed for New Zealand by Nielsen Research combines multiple demographic variables including age, life-stage and socio-economic status. The proprietary segmentation product, known as geoTribes, segments the NZ market into 15 tribes, namely: Rockafellas- Affluent mature families; Achievers-Ambitious younger and middle aged families; Fortunats- Financially secure retirees and pre-retirees; Crusaders-Career-oriented singles and couples; Preppies- Mature children of affluent parents; Independents- Young singles and couples; Suburban Splendour- Middle class mature families; Twixters- Mature children living at home; Debstars-Financially extended younger families; Boomers -White collar post family pre-retirees; True Blues -Blue collar mature families and pre-retiree singles or couples; Struggleville -Struggling young and middle aged families; Grey Power-Better off retirees; Survivors-Retirees living on minimal incomes and Slender Meanz-People living in underprivileged circumstances.[29]
The use of multiple segmentation variables normally requires analysis of databases using sophisticated statistical techniques such as cluster analysis or principal components analysis. It should be noted that these types of analysis require very large sample sizes. However, data-collection is expensive for individual firms. For this reason, many companies purchase data from commercial market research firms, many of whom develop proprietary software to interrogate the data. Proprietary packages, such as that mentioned in the preceding geoTribes by Nielsen example, offer clients access to an extensive database along with a program that allows users to interrogate the data via a 'user-friendly' interface. In other words, users do not need a detailed understanding of the 'back-end' statistical procedures used to analyse the data and derive the market segments. However, users still need to be skilled in the interpretation of findings for use in marketing decision-making.
The labels applied to some of the more popular demographic segments began to enter the popular lexicon in the 1980s.[30][31][32] The following popular terms can be found in any good dictionary of popular language:[33][34]
- DINKS: Double (or dual) Income, No Kids. describes one member of a couple with above average household income and no dependent children, tend to exhibit discretionary expenditure on luxury goods and entertainment and dining out
- GLAMs: Greying, Leisured and Moneyed. Retired older persons, asset rich and high income. Tend to exhibit higher spending on recreation, travel and entertainment
- GUPPY: (aka GUPPIE) Gay, Upwardly Mobile, Prosperous, Professional; blend of gay and YUPPY (can also refer to the London-based equivalent of YUPPY)
- MUPPY: (aka MUPPIE) Mid-aged, Upwardly Mobile, Prosperous, Professional
- PREPPY: (American) Well educated, well-off, upper class young persons; a graduate of an expensive school. Often distinguished by a style of dress.
- SITKOM: Single Income, Two Kids, Oppressive Mortgage. Tend to have very little discretionary income, struggle to make ends meet
- TWEEN: (contraction of in-between). Young person who is approaching puberty, aged approximately 9 -12 years; too old to be considered a child, but too young to be a teenager.
- WASP: (American) White, Anglo-Saxon Protestant. Tend to be high-status and influential white Americans of English Protestant ancestry.
- YUPPY: (aka YUPPIE) Young, Urban/ Upwardly-mobile, Prosperous, Professional. Tend to be well-educated, career-minded, ambitious, affluent and free spenders.
Psychographic segmentation
(Also see Psychographics )
Psychographic segmentation, which is sometimes called lifestyle segmentation, is measured by studying the activities, interests, and opinions (AIOs) of customers. It considers how people spend their leisure,[35] and which external influences they are most responsive to and influenced by. Psychographics is a very widely used basis for segmentation, because it enables marketers to identify tightly defined market segments and better understand the motivations for selecting particular products.
One of the most well-known psychographic segmentation analyses is the so-called Values And Lifestyles Segments (VALS), a proprietary psychometric method that measures attitudes, behaviours and demographics that align with brand preferences and new product adoption. The approach was originally developed by SBI International in the 1970s, and the typologies or segments have undergone several revisions over the years. As it currently stands, the VALs segments that describe the adult American population are: Achievers (26%), Strivers (24%), Experiencers (21%), Innovators, Thinkers, Believers, Makers and Survivors.[36] The VALs segments are country specific and the developer offers VALs segmentation typologies for use in China, Japan, the Dominican Republic, Nigeria, UK and Venezuela.[37]
Outside the USA, other countries have developed their own brand of proprietary psychographics segmentation. In Australia and New Zealand, Roy Morgan Research has developed the Values Segments which describes ten segments based on mindset, demographics and behaviours. The Values Segments are: Visible Achievers (20%); Traditional Family Life (19%); Socially Aware (14%); Look-At-Me (11%); Conventional Family Life (10%); Something Better (9%); Young Optimists (7%); Fairer Deal (5%); Real Conservatives (3%) and Basic Needs (2%).[38] Market research company, Nielsen offers PALS (Personal Aspirational Lifestyle Segments), a values-based segmentation that ranks future lifestyle priorities, such as the importance of career, family, wanting to have fun, or the desire for a balanced lifestyle. PALS divides the Australian market into six groups, namely Success Driven (25%); Balance Seekers (23%); Health Conscious (22%), Harmony Seekers (11%), Individualists (11%) and Fun Seekers (8%).[39]
In Britain, the following segments based on British lifestyles were developed by McCann-Erickson: Avant-Guardians (interested in change); Pontificators (traditionalists); Chameleons (follow the crowd) and Sleepwalkers (contented underachievers).[40]
While many of these proprietary psychographic segmentation analyses are well-known, the majority of studies based on psychographics are custom designed. That is the segments are developed for individual products at a specific time. One common thread among psychographic segmentation studies is that they use quirky names to describe the segments.
Behavioral segmentation
Behavioral segmentation divides consumers into groups according to their observed behaviors. Many marketers believe that behavioral variables are superior to demographics and geographics for building market segments.[41] Typical behavioral variables and their descriptors include:
- Purchase/Usage Occasion: e.g. regular occasion, special occasion, festive occasion, gift-giving
- Benefit-Sought: e.g. economy, quality, service level, convenience, access
- User Status: e.g. First-time user, Regular user, Non-user
- Usage Rate/ Purchase Frequency: e.g. Light user, heavy user, moderate user
- Loyalty Status: e.g. Loyal, switcher, non-loyal, lapsed
- Buyer Readiness: e.g. Unaware, aware, intention to buy
- Attitude to Product or Service: e.g. Enthusiast, Indifferent, Hostile; Price Conscious, Quality Conscious
- Adopter Status: e.g. Early adopter, late adopter, laggard
Note that these descriptors are merely commonly used examples. Marketers must ensure that they customize the variable and descriptors for both local conditions and for specific applications. For example, in the health industry, planners often segment broad markets according to 'health consciousness' and identify low, moderate and highly health conscious segments. This is an example of behavioral segmentation, using attitude to product or service as a key descriptor or variable.
Purchase/ usage occasion
Purchase or usage occasion segmentation focuses on analyzing occasions when consumers might purchase or consume a product. This approach customer-level and occasion-level segmentation models and provides an understanding of the individual customers’ needs, behavior and value under different occasions of usage and time. Unlike traditional segmentation models, this approach assigns more than one segment to each unique customer, depending on the current circumstances they are under.
For example, Cadbury has segmented the market into five segments based on usage and behavior: [42]

- Immediate Eat (34%): Driven by the need to snack, indulge or an energy boost. Products that meet these needs include brands such as Kit-Kat, Mars Bars
- Home Stock (25%): Driven by the need to have something in the pantry to share with family in front of TV or for home snacking. Products that meet these needs are blocks or multi-packs
- Kids (17%): Driven by need for after school snacks, parties, treats. Products that meet these needs include Smarties and Milky Bars.
- Gift-giving (15%): Products purchased as gifts, needs include a token of appreciation, a romantic gesture or a special occasion. Products that meet these needs include boxed chocolates such as Cabury's Roses or Quality Street
- Seasonal (3.4%): Driven by need to give a present or create a festive atmosphere. The products are mainly purchased on feast days such as Christmas, Easter, Advent. Products that meet these needs include Easter eggs and Christmas tree decorations.
Benefit-Sought
Benefit sought (sometimes called needs-based segmentation) divides markets into distinct needs or benefits sought by the consumer.
Other types of consumer segmentation
In addition to geographics, demographics, pyschographics and behavioral bases, marketers occasionally turn to other means of segmenting the market, or to develop segment profiles.
Generational segments
(Also see Baby boomers, Millennials, Generation Z)
A generation is defined as "a cohort of people born within a similar span of time (15 years at the upper end) who share a comparable age and life stage and who were shaped by a particular span of time (events, trends and developments)."[43] Generational segmentation refers to the process of dividing and analysing a population into cohorts based on their birth date. Generational segmentation assumes that people's values and attitudes are shaped by the key events that occurred during their lives and that these attitudes translate into product and brand preferences.
Demographers, studying population change, disagree about precise dates for each generation.[44] Dating is normally achieved by identifying population peaks or troughs, which can occur at different times in each country. For example, in Australia the post-war population boom peaked in 1960,[45] while the peak occurred somewhat later in the USA and Europe,[46] with most estimates converging on 1964. Accordingly, Australian Boomers are normally defined as those born between 1945–1960; while American and European Boomers are normally defined as those born between 1945–64. Thus, the generational segments and their dates discussed here must be taken as approximations only.
The primary generational segments identified by marketers are:[47]
- Builders: born 1920 to 1945
- Baby Boomers: born about 1945–1965
- Generation X: born about 1966–1976
- Generation Y: also known as Millenials; born about 1977–1994
- Generation Z: also known as Centennials; born 1995–2015
Table 2: Unique Characteristics of Selected Generations [48]
| Millenials | Generation X | Baby Boomers |
|---|---|---|
| Technology use (24%) | Technology use (12%) | Work Ethic (17%) |
| Music/ popular culture (11%) | Work ethic (11%) | Respectful (14%) |
| Liberal/ tolerant (7%) | Conservative/ traditional (7%) | Values/ morals (8%) |
| Smarter (6%) | Smarter (6%) | Smarter (5%) |
| Clothes (5%) | Respectful (5%) | n.a. |
Cultural segmentation
Cultural segmentation is used to classify markets according to cultural origin. Culture is a major dimension of consumer behavior and can be used to enhance customer insight and as a component of predictive models. Cultural segmentation enables appropriate communications to be crafted to particular cultural communities. Cultural segmentation can be applied to existing customer data to measure market penetration in key cultural segments by product, brand, channel as well as traditional measures of recency, frequency and monetary value. These benchmarks form an important evidence-base to guide strategic direction and tactical campaign activity, allowing engagement trends to be monitored over time.
Cultural segmentation can also be mapped according to state, region, suburb and neighborhood. This provides a geographical market view of population proportions and may be of benefit in selecting appropriately located premises, determining territory boundaries and local marketing activities.
Census data is a valuable source of cultural data but cannot meaningfully be applied to individuals. Name analysis (onomastics) is the most reliable and efficient means of describing the cultural origin of individuals. The accuracy of using name analysis as a surrogate for cultural background in Australia is 80-85%, after allowing for female name changes due to marriage, social or political reasons or colonial influence. The extent of name data coverage means a user will code a minimum of 99 percent of individuals with their most likely ancestral origin.
Selecting target markets
(Also see Target markets )

Another major decision in developing the segmentation strategy is the selection of market segments that will become the focus of special attention (known as target markets). The marketer faces a number of important decisions:
- What criteria should be used to evaluate markets?
- How many markets to enter (one, two or more)?
- Which market segments are the most valuable?
When a marketer enters more than one market, the segments are often labelled the primary target market, secondary target market. The primary market is the target market selected as the main focus of marketing activities. The secondary target market is likely to be a segment that is not as large as the primary market, but has growth potential. Alternatively, the secondary target group might consist of a small number of purchasers that account for a relatively high proportion of sales volume perhaps due to purchase value or purchase frequency.
In terms of evaluating markets, three core considerations are essential:[49]
- Segment size and growth
- Segment structural attractiveness
- Company objectives and resources.
There are no formulas for evaluating the attractiveness of market segments and a good deal of judgement must be exercised. Nevertheless, a number of considerations can be used to evaluate market segments for attractiveness.
Segment Size and Growth:
- How large is the market?
- Is the market segment substantial enough to be profitable?
- Segment size can be measured in number of customers, but superior measures are likely to include sales value or volume
- Is the market segment growing or contracting?
- What are the indications that growth will be sustained in the long term? Is any observed growth sustainable?
- Is the segment stable over time? (Segment must have sufficient time to reach desired performance level)
Segment Structural Attractiveness:
- To what extent are competitors targeting this market segment?
- Can we carve out a viable position to differentiate from any competitors?
- How responsive are members of the market segment to the marketing program?
- Is this market segment reachable and accessible? (i.e., with respect to distribution and promotion)
Company Objectives and Resources:
- Is this market segment aligned with our company's operating philosophy?
- Do we have the resources necessary to enter this market segment?
- Do we have prior experience with this market segment or similar market segments?
- Do we have the skills and/or know-how to enter this market segment successfully?
Developing the marketing program and positioning strategy
Also see Marketing mix Positioning (marketing) Perceptual mapping

When the segments have been determined and separate offers developed for each of the core segments, the marketer's next task is to design a marketing program (also known as the marketing mix) that will resonate with the target market or markets. Developing the marketing program requires a deep knowledge of key market segment's purchasing habits, their preferred retail outlet, their media habits and their price sensitivity. The marketing program for each brand or product should be based on the understanding of the target market (or target markets) revealed in the market profile.
Table 3 provides a brief summary of the marketing mix used by Black and Decker, manufacturer of three brands of power tools and household appliances. Each brand is pitched at different quality points and targets different segments of the market. This table is designed to illustrate how the marketing program must be fine-tuned for each market segment.
| Segment | Product/ Brand | Product Strategy | Price Strategy | Promotion Strategy | Place Strategy |
|---|---|---|---|---|---|
| Home-owners/ D-I-Y | Black & Decker | Quality Adequate for occasional use | Lower priced | TV advertising during holidays | Mass distribution (lower-tier stores) |
| Weekend Warriors | Firestorm | Quality Adequate for regular use | Higher priced | Ads in D-I-Y magazines, shows | Selective distribution (top tier hardware stores) |
| Professional users | De Walt | Quality adequate for daily use | Highest price | Personal selling (sales reps call on job sites) | Selective distribution (top tier hardware stores) |
Positioning is the final step in the S-T-P planning approach; Segmentation→ Targeting → Positioning; a core framework for developing marketing plans and setting objectives. Positioning refers to decisions about how to present the offer in a way that resonates with the target market. During the research and analysis that forms the central part of segmentation and targeting, the marketer will have gained insights into what motivates consumers to purchase a product or brand. These insights will form part of the positioning strategy.
According to advertising guru, David Ogilvy, "Positioning is the act of designing the company’s offering and image to occupy a distinctive place in the minds of the target market. The goal is to locate the brand in the minds of consumers to maximize the potential benefit to the firm. A good brand positioning helps guide marketing strategy by clarifying the brand’s essence, what goals it helps the consumer achieve, and how it does so in a unique way." [51]
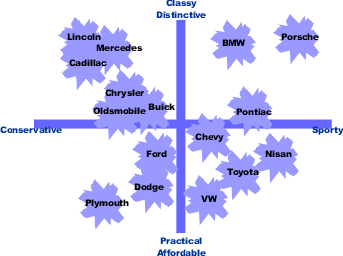
The technique known as perceptual mapping is often used to understand consumers' mental representations of brands within a given category. Traditionally two variables (often, but not necessarily, price and quality) are used to construct the map. A sample of people in the target market are asked to explain where they would place various brands in terms of the selected variables. Results are averaged across all respondents, and results are plotted on a graph, as illustrated in the figure. The final map indicates how the average member of the population views the brand that make up a category and how each of the brands relates to other brands within the same category. While perceptual maps with two dimensions are common, multi-dimensional maps are also used.

There are a number of different approaches to positioning:[52]

(a) Positioning against a competitor: e.g Hungry Jack's tastes better
(b) Positioning within a category: e.g. Within the prestige car category, Volvo is the safe alternative
(c) Positioning according to product benefit: e.g. Toothpaste with whitening
(d) Positioning according to product attribute: e.g. Dove is one quarter moisturizer
(e) Positioning for Usage Occasion: Cadbury Roses Chocolates - for gift giving or saying 'Thank-you'
(f) Positioning along price lines e.g. a luxury brand or premium brand
(g) Positioning for a User: Johnson and Johnson range of baby products (No Tears Shampoo)
(h) Positioning by cultural symbols e.g. Australia's Easter Bilby (as a culturally appropriate alternative to the Easter Bunny)
Bases for segmenting business markets
(Also see Industrial market segmentation )

Businesses may be segmented according to industry, business size, turnover, number of employees or any other relevant variables.
Firmographics
(Also see Firmographics)
Firmographics (also known as emporographics or feature based segmentation) is the business community's answer to demographic segmentation. It is commonly used in business-to-business markets (it’s estimated that 81% of B2B marketers use this technique). Under this approach the target market is segmented based on features such as company size (either in terms of revenue or number of employees), industry sector or location (country and/or region).[53]
Multi-variable account segmentation
In Sales Territory Management, using more than one criterion to characterize the organization’s accounts,[54] such as segmenting sales accounts by government, business, customer, etc. and account size or duration, in effort to increase time efficiency and sales volume.
Using segmentation in customer retention
(Also see Relationship marketing)
The basic approach to retention-based segmentation is that a company tags each of its active customers with four values:
- Is this customer at high risk of canceling the company's service?
One of the most common indicators of high-risk customers is a drop off in usage of the company's service. For example, in the credit card industry this could be signaled through a customer's decline in spending on his or her card.
- Is this customer at high risk of switching to a competitor to purchase product?
Many times customers move purchase preferences to a competitor brand. This may happen for many reasons those of which can be more difficult to measure. It is many times beneficial for the former company to gain meaningful insights, through data analysis, as to why this change of preference has occurred. Such insights can lead to effective strategies for winning back the customer or on how not to lose the target customer in the first place.
- Is this customer worth retaining?
This determination boils down to whether the post-retention profit generated from the customer is predicted to be greater than the cost incurred to retain the customer, and includes evaluation of customer lifecycles.[55][56]
- What retention tactics should be used to retain this customer?
This analysis of customer lifecycles is usually included in the growth plan of a business to determine which tactics to implement to retain or let go of customers.[57] Tactics commonly used range from providing special customer discounts to sending customers communications that reinforce the value proposition of the given service.
Segmentation: algorithms and approaches
The choice of an appropriate statistical method for the segmentation, depends on a number of factors including, the broad approach (a-priori or post-hoc), the availability of data, time constraints, the marketer's skill level and resources.
A-priori segmentation
According to the Market Research Association (MRA),a priori research occurs when "a theoretical framework is developed before the research is conducted".[58] In other words, the marketer has an idea about whether to segment the market geographically, demographically, psychographically or behaviorally before undertaking any research. For example, a marketer might want to learn more about the motivations and demographics of light and moderate users in an effort to understand what tactics could be used to increase usage rates. In this case, the target variable is known – the marketer has already segmented using a behavioral variable – user status. The next step would be to collect and analyse attitudinal data for light and moderate users. Typical analysis includes simple cross-tabulations, frequency distributions and occasionally logistic regression or CHAID analysis.
The main disadvantage of a-priori segmentation is that it does not explore other opportunities to identify market segments that could be more meaningful.
Post-hoc segmentation
In contrast, post-hoc segmentation makes no assumptions about the optimal theoretical framework. Instead, the analyst's role is to determine the segments that are the most meaningful for a given marketing problem or situation. In this approach, the empirical data drives the segmentation selection. Analysts typically employ some type of clustering analysis or structural equation modeling to identify segments within the data. The figure alongside illustrates how segments might be formed using clustering, however note that this diagram only uses two variables, while in practice clustering employs a large number of variables. Post-hoc segmentation relies on access to rich data sets, usually with a very large number of cases.
Statistical Techniques Used in Segmentation
Marketers often engage commercial research firms or consultancies to carry out segmentation analysis, especially if they lack the statistical skills to undertake the analysis. Some segmentation, especially post-hoc analysis, relies on sophisticated statistical analysis.

Common statistical techniques for segmentation analysis include:
- Clustering algorithms such as K-means or other Cluster analysis [59]
- Conjoint Analysis[60]
- Logistic Regression (also known as Logit Regression) [61]
- Chi-square Automatic Interaction Detector CHAID; a type of decision-tree [62]
- Structural Equation Modeling (SEM)
- Multidimensional scaling and Canonical Analysis[63]
- Statistical mixture models such as Latent Class Analysis
- Ensemble approaches such as Random Forests
- Other algorithms such as Neural Networks
Data Sources Used for Segmentation
Marketers use a variety of data sources for segmentation studies and market profiling. Typical sources of information include:
Internal databases
- Customer transaction records e.g. sale value per transaction, purchase frequency
- Patron membership records e.g. active members, lapsed members, length of membership
- Customer relationship management (CRM) databases
- In-house surveys
External sources
- Commercial Surveys or tracking studies (available from major research companies such as Nielsen and Roy Morgan)
- Government agencies or Professional/ Industry associations
- Census data
- Observed purchase behavior – collected from online agencies such as Google
- Data-mining techniques
See also
- Acorn (demographics)
- Demographic profile
- Experian
- Mass marketing
- Mosaic (geodemography)
- Niche market
- Persona (user experience)
- Precision marketing
- Psychographics
- Target market
- Industrial market segmentation
- Sagacity Segmentation
- VALS US psychographic segmentation service
- Values Modes UK psychographic segmentation service
External links
- Acorn (UK) geo-demographic segmentation services
- Cameo (UK) demographic segmentation services
- Experian Mosaic Segments, UK geo-demographic segmentation services
- Experian Mosaic Segments, US geo-demographic segmentation services
- Mosaic Portal geo-demographic segmentation services
- Geotribes geo-demographic segmentation services
- Helix Personas geo-demographic segmentation services (Australia, NZ and Indonesia)
- Strategic Business Insights (US), VALS segmentation psychographic segmentation services
- Roy Morgan Research, Values Segments (Australia and NZ) psychographic/ psychometric segmentation services
References
- ↑ In his oft-cited work, New and Improved: The Story of Mass Marketing in America, Basic Books, N.Y. 1990 pp 4-12, Richard Tedlow outlines first three stages: fragmentation, unification and segmentation. In a subsequent work, published three years later, Tedlow and his co-author thought that they had seen evidence of a new trend and added a fourth era, termed Hyper-segmentation (post 1980s); See Tedlow, R.A. and Jones, G., The Rise and Fall of Mass Marketing, Routledge, N.Y., 1993 Ch 2
- ↑ Hoek, J., Gendall, P. and Esslemont, D., Market segmentation: A search for the Holy Grail?, Journal of Marketing Practice Applied Marketing Science, Vol. 2, no. 1, pp 25-34, 1996
- ↑ Addison, T. and O'Donohue, M., "Understanding the Customer’s Relationship With a Brand: The Role of Market Segmentation in Building Stronger Brands," Market Research Society Conference, London, 2001, Online: http://www.warc.com/fulltext/MRS/49705.htm
- ↑ Kennedy, R. and Ehrenberg, A., "What’s in a brand?" Research, April, 2000, pp 30–32
- ↑ Bardakci, A. and Whitelock, L., "Mass-customisation in Marketing: The Consumer Perspective," Journal of Consumer Marketing' vol. 20, no.5, 2003, pp. 463-479.
- ↑ Smit, E. G. and Niejens, P. C., 2000. "Segmentation Based on Affinity for Advertising," Journal of Advertising Research, vol. 40, no. 4, 2000, pp. 35-43.
- ↑ Albaum, G. and Hawkins, D. I., "Geographic Mobility and Demographic and Socioeconomic Market Segmentation," Journal of the Academy of Marketing Science, vol. 11, no. 2. 1983, pp. 97-114.
- ↑ Blocker, C. P. and Flint, D. J., 2007. "Customer Segments as Moving Targets: Integrating Customer Value Dynamism into Segment Instability Logic," Industrial Market Management, vol. 36, no. 6., 2007, pp. 810-822.
- ↑ Board, T. "Ten Lessons Learned from Cybersegmentation," Technology & Communications practice for IIR – The Market Research Event IPSOS Insight. 2004 [On-line] http://www.ipsosinsight.com/pdf/IpsosInsight_PD_TenTips.pdf
- ↑ Yankelovich, D., Meer, D. "Rediscovering Market Segmentation", Harvard Business Review vol. 84. no 2, 2006, pp. 122-13
- ↑ Business Dictionary Online: http://www.businessdictionary.com/definition/undifferentiated-marketing.html
- ↑ Business Dictionary , http://www.businessdictionary.com/definition/differentiated-marketing.html
- ↑ Based on Weinstein, A., Market Segmentation Handbook: Strategic Targeting for Business and Technology Firms, 3rd ed., Haworth Press, Binghampton, m.Y., 2004, p. 12
- ↑ Marketing Insider, Market Targeting: Target Segments Effectively and Efficiently, https://marketing-insider.eu/marketing-explained/part-i-defining-marketing-and-the-marketing-process/market-targeting/
- ↑ Moutinho, L., "Segmentation, Targeting, Positioning and Strategic Marketing," Chapter 5 in Strategic Management in Tourism, Moutinho, L. (ed), CAB International, 2000, pp 121-166
- ↑ Gurley,B., “How to Miss By a Mile: An Alternative Look at Uber’s Potential Market Size,” Above the Crowd, July 11, 2014
- ↑ Lesser,B. and Vagianos,L. Computer Communications and the Mass Market in Canada, Institute for Research on Public Policy, 1985, p. 37
- ↑ Mauboussin, M.J. and Callahan, D., Total Addressable Market: Methods to Estimate a Company’s Potential Sales, [Occasional Paper], Credit-Suisse - Global Financial Strategies, 1 September, 2015
- ↑ See for example, Lilien,G., Rangaswamy, A. and Van den Bulte, C., “Diffusion Models: Managerial Applications and Software,” ISBM Report 7, May 20, 1999.
- ↑ Sarin, S., Market Segmentation and Targeting, Wiley International Encyclopedia of Marketing, 2010
- ↑ Gavett, G., "What You Need to Know About Segmentation," Harvard Business Review, Online: July 09, 2014 https://hbr.org/2014/07/what-you-need-to-know-about-segmentation
- ↑ In the early 1980s, Australian fashion designer, Maggie T, was the recipient of a Hoover Award for a segmentation study which showed that women with dress size 16+ underspent on clothes because they were unable to find suitable garments. This insight led to the establishment of 'plus-sized' fashion outlets. Case study reported in Australian marketing projects : the Hoover Award for Marketing, West Ryde, Australia, 1982
- ↑ 'What is geographic segmentation' Kotler, Philip, and Kevin Lane Keller. Marketing Management. Prentice Hall, 2006. ISBN 978-0-13-145757-7
- ↑ Tourism Australia, Global Marketing Strategy, http://www.tourism.australia.com/markets/market-strategy.aspx; For those interested in learning about geo-demographic segmentation in practice might like to explore the Tourism Australia website which provides profiles and strategies on its site for the benefit of travel operators, hotels and tourist operators
- ↑ Experian Mosaic Portal, http://www.experian.com/marketing-services/mosaicportal.html
- ↑ "Helix Personas – By Roy Morgan Research – Helix Personas – By Roy Morgan Research". helixpersonas.com.au.
- ↑ Reid, Robert D.; Bojanic, David C. (2009). Hospitality Marketing Management (5 ed.). John Wiley and Sons. p. 139. ISBN 978-0-470-08858-6. Retrieved 2013-06-08.
[...].
- ↑ Scouts Australia, http://www.scouts.com.au. Although Scouts Worldwide uses similar segmentation approaches, the labels given to each segment exhibit some geographic variation. In the United Kingdom, the comparable segments are Beavers 6-8 yrs; Cubs 8-10.5 yrs; Scouts 10.5-14 yrs; Explorers 14-18 yrs and the Scout Network refers to those aged 18-25 yrs (See http://scouts.org.uk/home/)
- ↑ Nielsen NZ, "Nielsen Launches geoTribes", Media Release, 23 July 2014 Online: http://www.nielsen.com/nz/en/press-room/2014/nielsen-launches-geotribes-segmentation.html
- ↑ Boushey, H., Finding Time, Boushey, 2016
- ↑ Courtwright, D.T., No Right Turn, Harvard University Press, 2010, p. 147
- ↑ Dension, D. and Hogg, R., (eds), A History of the English Language, Cambridge, Cambridge University Press, 2008, p. 270
- ↑ Thorne, T., Dictionary of Contemporary Slang, 4th ed, London, Bloomsbury, 2014,
- ↑ Burridge, K., Blooming English: Observations on the Roots, Cultivation and Hybrids of the English Language, Cambridge, Cambridge University Press, 2004, pp 54-55
- ↑ "Market Segmentation and Targeting". Academic.brooklyn.cuny.edu. 2011. Retrieved 15 July 2014.
- ↑ Strategic Business Insights, VALs US, Online:http://www.strategicbusinessinsights.com/vals/ustypes.shtml
- ↑ Strategic Business Insights International, VALs, Online: http://www.strategicbusinessinsights.com/vals/international/
- ↑ Roy Morgan Research, Values Segments,http://www.roymorgan.com/products/values-segments/about-values-segments
- ↑ "Connecting with Aspirations", AdNews, 28 March 2003
- ↑ Kotler, P., Marketing Management, (Millenium edition), Upper Saddle River, N.J., Pearson, 2011, p.93
- ↑ Philip Kotler and Gary Armstrong : Principles of Marketing Pearson Education Limited 2014, 2012
- ↑ Cadbury Trebor Bassett, "How is the Confectionery Market Segmented, [Fact Sheet], n.d. circa 2005
- ↑ McCrindle, M., Generations Defined [Booklet] n.d. circa 2010 Online: http://mccrindle.com.au/BlogRetrieve.aspx?PostID=146968&A=SearchResult&SearchID=9599835&ObjectID=146968&ObjectType=55
- ↑ Cran, C., The Art of Change Leadership: Driving Transformation In a Fast-Paced World, Wiley, Hoboken, N.J. 2016, pp 174-75
- ↑ Salt, B., The Big Shift , South Yarra, Vic.: Hardie Grant Books, 2004 ISBN 978-1-74066-188-1
- ↑ U.S. Census Bureau, American Fact Finder: Age Groups and Sex, 2010
- ↑ McCrindle Research, Seriously Cool- Marketing & Communicating with Diverse Generations, Norwest Business Park, Australia, n.d. c. 2010
- ↑ Pew Research Centre, 2010, Online: http://www.pewresearch.org/fact-tank/2014/06/05/generation-x-americas-neglected-middle-child/
- ↑ Marketing Insider, "Evaluating Market Segments", Online: http://targetmarketsegmentation.com/target-market/secondary-target-markets/
- ↑ Based on Hunt, S.D. and D.B. Arnett, "Market Segmentation Strategy, Competitive Advantage and Public Policy: Grounding Segmentation Strategy in Resource-Advantage Theory," Australasian Marketing Journal, vol 12, no1, 2004, pp 7-25.
- ↑ David Ogilvy, Ogilvy on Advertising, (1983) Vintage Books, 1985
- ↑ Based on Belch, G., Belch, M.A, Kerr, G. and Powell, I., Advertising and Promotion Management: An Integrated Marketing Communication Perspective, McGraw-Hill, Sydney, Australia, 2009, pp 205-206
- ↑ "B2B Market Segmentation Research" (PDF). Circle Research. Circle Research. Retrieved 9 June 2015.
- ↑ "CHAPTER 14 – Time, Territory, and Self-Management: Keys to Success". People.tamu.edu. Retrieved 15 July 2014.
- ↑ Gupta, Sunil. Lehmann, Donald R. Managing Customers as Investments: The Strategic Value of Customers in the Long Run, pages 70-77 (“Customer Retention” section). Upper Saddle River, NJ: Pearson Education/Wharton School Publishing, 2005. ISBN 0-13-142895-0
- ↑ Goldstein, Doug. “What is Customer Segmentation?” MindofMarketing.net, May 2007. New York, NY.
- ↑ Hunt, Shelby; Arnett, Dennis (16 June 2004). "Market Segmentation Strategy, Competitive Advantage, and Public Policy". 12 (1). Australasian Marketing Journal: 1–25. Retrieved 18 March 2016.
- ↑ Market Research Association, Glossary of Terms, Online:http://www.marketingresearch.org/issues-policies/glossary
- ↑ http://evgeniou,T., Cluster Analysis and Segmentation, Online: inseaddataanalytics.github.io/INSEADAnalytics/Report_s45.html [with worked example]
- ↑ Desarbo, W.S., Ramaswamy, V. and Cohen, S. H., "Market segmentation with choice-based conjoint analysis," Marketing Letters, vol. 6, no. 2 pp 137-147. <http://hdl.handle.net/2027.42/47171>
- ↑ Burinskiene, M. and Rudzkiene, V., "Application of Logit Regression Models for the Identification of Market Segments", Journal of Business Economics and Management, vol. 8, no. 4, 2008, pp 253-258
- ↑ Dell Software, Statistics Textbook, Online: https://documents.software.dell.com/statistics/textbook/customer-segmentation
- ↑ T.P. Beane and D.M. Ennis, "Market Segmentation: A Review", European Journal of Marketing, Vol. 21 no. 5, pp 20-42