MIPI Debug Architecture
MIPI Alliance Debug Architecture provides a standardized infrastructure for debugging deeply embedded systems in the mobile space. The MIPI Debug Working Group[1] released therefore a portfolio of specifications.
Their objective is to provide:
- Standard protocols for debug
- Standard interfaces from the SoC to the debug tool
The whitepaper Architecture Overview for Debug [2] summarizes all efforts of the MIPI Debug Working Group.
The Term "Debug"
Debug is used within the MIPI Debug Architecture for standard debug and trace.
Standard Debug

Standard Debug includes:
- Core debugging (run control, breakpoints, ...)
- Memory and register access
- Trace configuration
- Additional debug features (performance counter, run-time memory access, ...)
Standard debug is performed via classic JTAG or via memory-mapped debug registers:
- Classic JTAG (Scan Interface)
- Memory-mapped debug registers (Bus Interface) - Option 1
Bus Interface is directly connected to Debug Interconnect (dashed line). Here only the external debug tool has access to the debug registers. - Memory-mapped debug registers (Bus Interface) - Option 2
Debug Interconnect is connected to System Interconnect (solid line). This connection provides, in addition to an external debug tool, also other system components an access path to the debug registers.
Both, classic JTAG debugging and debugging via memory-mapped debug registers, can provide read/write access to system components (e.g. memory). This requires that Scan Interface/Bus Interface is connected to System Interconnect. If this connection is not available the external debug tool can only access the system components via the core(s) under debug.
Standard debug is currently always performed via a dedicated interface.
Trace

Traces allow an in-depth analysis of the behavior and the timing characteristics of the embedded system. Trace data is generated by two types of trace sources within a SoC.
- Core Trace
A core trace provides detailed visibility of the program execution on an embedded core. Trace data are generated for the instruction execution sequence and/or data bus transfers. A SoC may contain several core traces. - System Trace
A system trace provides visibility of various events/states inside the embedded system. Trace data can be generated by instrumented application code and/or by hardware modules within the SoC. A SoC may contain several system traces.
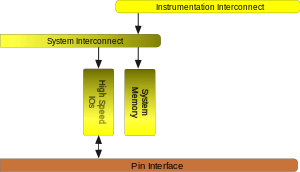
Trace data streams from different trace sources are usually merged (Instrumentation Interconnect):
- They can be recorded by an external debug tool after they were exported off-chip via a dedicated Debug Export Interface
(parallel trace port). - They can be recorded by an external debug tool after they were exported off-chip via High-Speed I/Os (standard I/O or network).
- They can be stored in a dedicated Debug Buffer (on-chip trace buffer).
- They can be stored within System Memory (e.g. on-chip SRAM or off-chip SDRAM).
Trace data are usually postprocessed with a debug tool.
SneakPeek Protocol
MIPI Approved Specification: Specification for SneakPeek Protocol (SPP)[3]
SneakPeek opens up a path away from a dedicated interface for basic debug towards a protocol-driven interface.
- It translates incoming command packets into read/write accesses to memory, memory-mapped debug registers and other memory-mapped system resources.
- It translates command results (status information and read data coming from memory, memory-mapped debug registers and other memory-mapped system resources) to outgoing response packets.
Since SneakPeek accepts packets coming through an input buffer and delivers packets through an output buffer it can be easily connected to any standard I/O or network.
The MIPI Alliance Specification for SneakPeek Protocol describes the basic concepts, the required infrastructure, the packets and the data flow.
Trace Protocols
System Trace Protocol

MIPI Approved Specification: Specification for System Trace Protocol (STP)[4]
For a deeply embedded system with multiple cores a system trace is an indispensable mean to find and eliminate inefficiencies. A system trace provides the following features:
- A hardware-accelerated method to export diagnostic information generated by instrumented code (SW Instrumentation)
- A method to export details on hardware events/states such as performance, power consumption, bus load (HW Instrumentation)
The MIPI System Trace Protocol provides the following trace facilities:
- Standard data payload format
- A flexible mapping of the multiple trace sources to a master/channel system
- Stream synchronization and alignment
- Trigger markers
- Global timestamping
- Multiple stream time synchronization
The protocol generates packets with the following content:
- A master/channel ID
- Payload data
- A global hardware-generated timestamp
ARM´s CoreSight System Trace Macrocell [5] which is compliant with MIPI STP is today an integral part of most multi-core chips used in the mobile space.
Trace Wrapper Protocol
MIPI Approved Specification: MIPI Alliance Specification for Trace Wrapper Protocol,[6]
The Trace Wrapper Protocol (TWP) enables multiple source trace streams to be merged into a single trace stream. The basic principle is that the source trace streams (byte streams) can be assigned system unique IDs. The following features are provided by the Trace Wrapper Protocol:
- Wrapping
A wrapping protocol is used to encapsulate all the streams in the SoC identifying them with IDs. - Synchronization
The encoding allows to detect byte/word boundaries even if the data is transmitted as a stream of bits.
- Padding
Inert packets can be used for SoCs that require a continuous export of trace data.
The Trace Wrapper Protocol merges multiple source trace streams
- to export them via a dedicated Debug Export Interface
- for storing them in a dedicated Debug Buffer or System Memory
- to export them via High-Speed differential I/Os
- to export them via a network shared with other applications in the mobile terminal
Trace Wrapper Protocol is based on ARM´s Trace Formatter Protocol [7] specified for ARM® CoreSightTM.
Dedicated Interfaces
Debug Connectors

MIPI Approved Recommendation: MIPI Alliance Recommendation for Debug and Trace Connectors [8]
Board developers and debug tools vendors benefit from standard debug connectors and standard pin mappings.
Standard Debug Connectors
Recommended are 10-/20-/34-pin board-level connectors (1.27 mm 050"). Seven different pin mappings are specified that address a wide variety of debug use scenarios. They include:
- Standard JTAG (IEEE 1149.1)
- cJTAG (IEEE 1149.7)
- 4-bit parallel trace interface (mainly used for System Traces)
Supplemented by the ARM-specific standard SWD [9] (Serial Wire Debug) MIPI10/20/34 debug connector became the standard debug connectors for ARM-based embedded designs.
High-speed Parallel Trace Connector
Many embedded designs in the mobile space use high-speed parallel trace ports (up to 600 Mbit/s/pin). MIPI recommends a 60-pin Samtec QSH/QTH connector named MIPI60. It allows JTAG/cJTAG for run control, up to 40 trace data signals and up to 4 trace clocks. To minimize complexity, the recommendation defines four standard configurations with one, two, three or four trace channels of varying width.
Debugging via a Functional Interface

MIPI Approved Specification: Specification for Narrow Interface for Debug and Test (NIDnT) [10]
Historically product development in the mobile space is done using development boards. These boards provide dedicated and readily-accessible interfaces for connecting the debug tools. These interfaces are not available at the product’s final form factor. This hampers the identification of bugs and performance optimization in the end product.
Since the debug logic is still present in the end product, an alternative access path is needed. An effective way is to equip a mobile terminal´s standard interface (e.g. Micro SD) with a multiplexer that allows access the debug logic. The switching between the interface´s native function and the added debug function can be done by the connected debug tool or by the mobile terminal’s software.
This solution allows the use of standard debug tools:
- If an adapter from the standard interface in use (e.g. Micro SD) to a MIPI Standard Debug Connector is available.
- If a switching protocol is implemented on the debug tool.
Parallel Trace Interface
MIPI Approved Specification: MIPI Alliance Specification for Parallel Trace Interface [11]
A standard practice to export trace data off-chip is to use a dedicated Debug Export Interface (single-ended pins). The task of the Debug Export Interface is to pass the trace data to multiple data and a clock pin (parallel trace interface). The MIPI Alliance Specification for Parallel Trace Interface specifies the behavior of a MIPI Parallel Trace Interface. This includes:
- Signal names and functions
- Timing constraints and electrical constraints
- Clock modes and data modes
Interfaces to Standard I/Os or Networks
The Gigabit Debug Specification Family is providing details for mapping debug and trace protocols to standard I/Os or networks available in mobile terminals.
These details include (not an exhaustive list):
- Endpoint addressing
- Link initialization and management
- Data packaging
- Data flow management
- Error detection and recovery
MIPI Approved Specification: Specification for Gigabit Debug for USB [12]
MIPI Approved Specification: Specification for Gigabit Debug for Internet Protocol Sockets [13]
References
- ↑ MIPI Debug Working Group
- ↑ Architecture Overview for Debug, 17-Aug-2016, publicly available
- ↑ Specification for SneakPeek Protocol (SPP), 03-Mar-2016], MIPI membership required
- ↑ Specification for System Trace Protocol (STP), 21-Aug-2015, MIPI membership required
- ↑ ARM® CoreSight STM-500 System Trace Macrocell
- ↑ MIPI Alliance Specification for Trace Wrapper Protocol, 03-Sept-2014, MIPI membership required
- ↑ ARM® CoreSight Architecture
- ↑ MIPI Alliance Recommendation for Debug and Trace Connectors, 16-Mar-2011, publicly available
- ↑ ARM® Serial Wire Debug
- ↑ Specification for Narrow Interface for Debug and Test (NIDnT), 26-Aug-2015, MIPI membership required
- ↑ MIPI Alliance Specification for Parallel Trace Interface, 03-May-2011, MIPI membership required
- ↑ Specification for Gigabit Debug for USB, 17-Aug-2015, MIPI membership required
- ↑ Specification for Gigabit Debug for Internet Protocol Sockets, 20-May-2016, MIPI membership required